Phosphorus Transport in World Rivers: History
Please note this is an old version of this entry, which may differ significantly from the current revision.
Contributor:

Data on the geochemistry of phosphorus in the continental runoff of dissolved and solid substances were systematized and generalized, with a separate consideration of the processes of runoff transformation in river mouth areas. It has been established that atmospheric deposition, which many authors consider to be an important source of phosphorus in river runoff and not associated with mobilization processes in catchments, actually contains phosphorus from soil-plant recycling. This is confirmed by the fact that the input of phosphorus from the atmosphere into catchments exceeds its removal via water runoff. An analysis of the mass ratio of phosphorus in the adsorbed form and in the form of its own minerals was carried out. It was shown that the maximum mass of adsorbed phosphorus is limited by the solubility of its most stable minerals. The minimum concentrations of dissolved mineral and total phosphorus were observed in the rivers of the Arctic and subarctic belts; the maximum concentrations were confined to the most densely populated temperate zone and the zone of dry tropics and subtropics. In the waters of the primary hydrographic network, the phosphorus concentration exhibited direct relationships with the population density in the catchments and the mineralization of the river water and was closely correlated with the nitrogen content. This strongly suggests that economic activity is one of the main factors in the formation of river phosphorus runoff. The generalization of the authors’ and the literature’s data on the behavior of phosphorus at the river–sea mixing zone made it possible to draw a conclusion about the nonconservative distribution of phosphorus, in most cases associated with biological production and destruction processes. The conservative behavior of phosphorus was observed only in heavily polluted river mouths with abnormally high concentrations of this element.

  • geochemistry of phosphorus
  • continental runoff
  • river mouth

1. Phosphorus Mobilization at the Stage of River Runoff Formation

The initial stage in the formation of the chemical composition of surface waters is often associated with atmospheric precipitation on the earth’s surface and their subsequent interaction with soil and vegetation cover and rocks. However, due to the constant presence of terrigenous aerosols (mainly the products of the wind erosion of soils) in the surface air layers, this interaction begins already in the atmosphere immediately after the condensation of water vapor. Therefore, it is expedient to divide the mobilization of dissolved substances at the initial stage of river runoff formation into the mobilization in the atmosphere and in the catchments.

1.1. Phosphorus Mobilization in the Atmosphere

Chemical elements are delivered from the atmosphere to the catchments in the form of wet (rain, snow) and dry (aerosols) precipitation. The chemical composition of wet precipitation is due to leaching from the atmosphere and the partial dissolution of aerosols, which are represented by substances of terrigenous and marine genesis. The contribution of marine aerosols to the transport of phosphorus into the land is apparently small. This is indicated by an exponential decrease in the content of aerosol phosphorus in the lower atmosphere when moving from the coast to the central regions of the ocean and a significantly lower content of phosphorus in the rains over the ocean compared to land [1,2,3]. The estimates of phosphorus input into the atmosphere from various sources confirm this conclusion and show that the main role is played by the aeolian erosion of the soil cover and the combustion of terrestrial vegetation (Table 1). Another source associated with the products of plant metabolism (spores, pollen, volatile organic compounds, and small particles of plant residues) is currently not quantifiable, but observations unambiguously indicate the widespread occurrence of plant metabolism products present in atmospheric aerosols.
Table 1. Sources of phosphorus in the atmosphere [4].
Source Mass of Aerosols Entering the Atmosphere, Gt/yr Phosphorus Content in Aerosols, % Phosphorus Input into the Atmosphere, Mt/yr
Aeolian soil erosion 4.6–8.3 0.08 3.7–6.6
Splashing of seawater 1.8–1.9 0.001 ~0.02
Burning of vegetation 0.15–0.60 1.5 1 2.3–9.0
Volcanism ≤0.003
Combustion of solid fuels 0.03–0.06 0.1 0.03–0.06
Combustion of liquid fuels 0.003 0.01 0.0003
1 By the composition of terrestrial vegetation at 10% ash content.
The total phosphorus concentration in aerosols varies from 600 to 4700 µg/g, averaging ~2000 µg/g [5], which is 2–5 times higher than the phosphorus content in the rocks of the earth’s crust and soils, the main sources of terrigenous material in the atmosphere. The increased phosphorus concentrations in atmospheric aerosols are logically explained by the presence of the solid products of plant biomass combustion in the amount of 0.6–1.1% of the total aerosol mass [4]. A significant part of the phosphorus in aerosols is present in water-soluble form, which, as a rule, accounts for 20–50% of its total content [6]. Apparently, the soluble forms of phosphorus in aerosols are associated with the products of combustion of plant biomass and its destruction.
In atmospheric precipitation, the concentrations of mineral and total phosphorus (Pmin and Ptotal) are distributed in accordance with the lognormal law. The average median concentrations of these forms are 15 and 33 μg/L and the values of their input with atmospheric precipitation to the earth’s surface are 0.11 and 0.25 kg/ha yr (Table 2). The percentage of the soluble forms of the total phosphorus in atmospheric precipitation is in the range of 20–80%, with an average value of 55% [6], which is in good agreement with the percentage of soluble phosphorus in aerosols, the main source of dissolved substances.
Table 2. Concentration of phosphorus in atmospheric precipitation and its input on the earth’s surface with wet precipitation [7].
Parameter Concentration, μg/L Input, kg/ha yr
Pmin Ptotal Pmin Ptotal
Number of observation sites 130 97 104 77
Arithmetic mean 30 73 0.22 0.36
Median mean 13 34 0.093 0.23
Geometric mean 15 33 0.11 0.25
Atmospheric precipitation is considered by many authors as an important source of phosphorus in river runoff, which is not associated with the processes of its mobilization in the catchments. However, the balance of total phosphorus in the catchments shows that the input of this element with atmospheric precipitation usually exceeds the removal with water runoff [4]. The opposite situation, when the phosphorus runoff exceeds its input, is observed, as a rule, under the conditions of a strong anthropogenic load. The positive value of the difference between the phosphorus input from the atmosphere and its removal from the catchments is an artifact that is associated with the lack of reliable methods for quantifying the masses of substances remobilized from the earth’s surface into the atmosphere and returned back as a part of atmospheric precipitation (Figure 1).
Figure 1. Scheme of phosphorus fluxes in the catchments.

1.2. Phosphorus Mobilization in the Catchment Areas

The primary sources of phosphorus are igneous, metamorphic, and sedimentary rocks, which differ significantly in the content of this element (Table 3). The maximum phosphorus concentrations are characteristic of basic and intermediate magmas; with an increase and decrease in acidity, the phosphorus content in igneous rocks decreases. In sedimentary rocks, the phosphorus concentration does not vary so much, and in general, for the sedimentary deposits it is slightly higher than in granites. In metamorphic processes, phosphorus behaves as an inert component, and its content is inherited from the parent rocks.
Table 3. Content of phosphorus in rocks [8,9].
Rock [P], μg/g Rock [P], μg/g
Igneous rocks: Sedimentary rocks:
Ultrabasic rocks 280 Sands and sandstones 620
Basic rocks 1300 Clays and clay shales 790
Andesites, diorites 1350 Carbonate rocks 480
Granodiorites 980 Siliceous rocks 660
Granites 600 Evaporites 4
Syenites 800 Volcanic rocks 900
Volcanic rocks 900 Sedimentary deposits in general 710
Surface of the continental lithosphere 1 690
1 Based on results of [9].
Apatite is the main phosphorus mineral in all types of igneous, metamorphic, and sedimentary rocks. The abundance of two other important phosphorus minerals, xenotime YPO4 and monazite CePO4, is 100–1000 times lower than that of apatite and can reach 10% only in acid rocks [10]. According to mineralogical analysis, in igneous rocks, apatite accounts for 1.7–5.7% of the total phosphorus, whereas in sedimentary carbonate, clayey, and sandy rocks, apatite contains 22.9, 0.5, and 7.1% of phosphorus, respectively [10,11]. In magmatic and metamorphic silicates, phosphorus can isomorphically replace silicon with charge compensation (Na+ + P5+ = Ca2+ + Si4+ and Al3+ + P5+ = 2 Si4+) or with the formation of cation vacancies. In the Critical Zone, the bulk of phosphorus is in the sorbed state, as well as in the form of apatite and various iron and aluminum phosphates. The composition of apatite is different for various types of rocks. Fluorapatite predominates in igneous and metamorphic rocks, with fluoro-carbonate-apatite pervading in sedimentary rocks, and bone phosphate is represented by hydroxyl-apatite and carbonate-hydroxyl-apatite.
Biological metabolites and the products of dead organisms’ destruction are an important source of phosphorus in continental runoff. The phosphorus content in land plants (on average 1500–2000 μg/g dry weight) is almost an order of magnitude lower than the content in animals and bacteria [12,13,14]. Therefore, the destruction of animal and bacterial biomasses can lead to the emergence of high local concentrations of dissolved phosphorus.
The most obvious factor in phosphorus mobilization is the solubility of the phosphorus-containing mineral phases. According to calculations [15], the concentration of dissolved mineral phosphorus in the waters of the Rhine and Rhone rivers is controlled by the solubility of hydroxylapatite. However, under the conditions of the earth’s surface, hydroxylapatite is unstable and transforms into a less soluble fluoro-carbonate-apatite. The dissolution of fluorapatite in fresh waters leads to a concentration of dissolved mineral phosphorus at the level of 14 ± 3 μg/L [16], which, as will be shown below, approximately corresponds to the average median value for the world rivers.
The acidity of the aquatic environment is apparently the main factor controlling the stability of the mineral forms of phosphorus. In a moderately alkaline medium, the stable phase is fluoro-carbonate-apatite; in a moderately acidic medium, iron (III) and aluminum phosphates are stable under oxidizing conditions and iron (II) and aluminum phosphates are stable under reducing conditions [6]. According to the experimental data [17], in waters with a reaction close to neutral, the monophosphates of iron (III) and aluminum transform into more stable iron-calcium and aluminum-calcium phosphates with the hypothetical chemical formulas CaFe(OH)3HPO4 and CaAl(OH)3HPO4. In the neutral medium, the dissolved iron (III) and aluminum are mainly in the form of the electroneutral hydroxocomplexes Fe(OH)and Al(OH)3, and the bulk of the phosphorus is represented by HPO4. Therefore, in accordance with the dissolution reactions
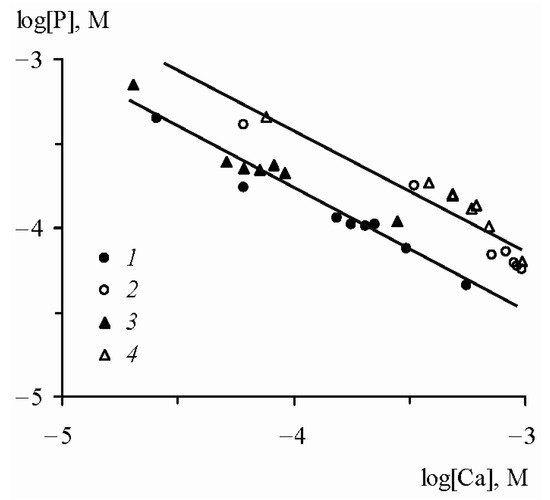
an inverse relationship between the logarithms of the concentrations of mineral phosphorus and calcium is observed (Figure 2).
Figure 2. Relationship between logarithms of the concentrations of dissolved phosphates and calcium in the interaction of FePO4 and AlPO4 with fresh waters [17]. FePO4: (1) water from the Moscow River, (2) water from the Don River mouth; AlPO4: (3) water from the Moscow River, (4) water from the Don River mouth.
In equilibrium with iron-calcium and aluminum-calcium phosphates, the concentration of dissolved mineral phosphorus is significantly higher than its content in river and ground waters. Therefore, it should be assumed that the presence of these solid phases is possible only where high local concentrations of dissolved phosphorus can be maintained for a long time. These can be bottom sediments with an extremely slow rate of water exchange or soils in which a high concentration of dissolved phosphorus is provided by the destruction of organic matter during the biological cycle. In all other cases, iron-calcium and aluminum-calcium phosphates must be replaced by hydroxides containing adsorbed phosphorus.
At sufficiently high concentrations of phosphates, arising, for example, during the destruction of animal or bacterial biomass, the silicate phosphatization reaction can occur, in which the silicon of the solid phase is replaced by phosphorus from the solution. This process was experimentally studied by us, using rock-forming minerals of different structural types (hornblende, orthoclase, labradorite, kaolinite, and montmorillonite) and background buffer solutions with variable concentrations of orthophosphates (0.25–6.0 mM), maintaining the pH at ~1.8, 3.7, 4.9, 6.8, 7.8, and 8.8 [18,19,20].
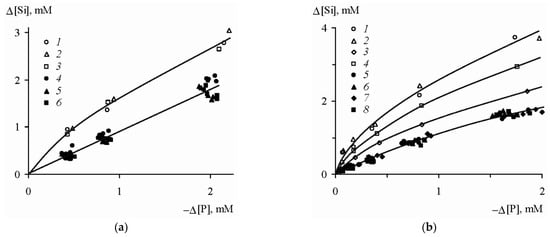
The results of the experiments demonstrated the following features. First, all the samples were characterized by approximately equivalent variations in the concentrations of phosphorus and silicon in the solution in the pH range of 3.7–8.8:
whereas at pH 1.8 the supply of the dissolved silicon was 1.3–2 times higher than the removal of the phosphates (Figure 3), which was likely explained by the change in the stoichiometry of the phosphatization reaction. Second, the amount of phosphorus absorbed by the silicates was linearly dependent on its final concentration in the solution,
with almost the same values of the proportionality coefficient k for the different minerals, slightly decreasing with a decrease in the acidity of the medium (Table 4).
Figure 3. Correlation between variations in the concentrations of phosphorus and silicon in the solution upon phosphotization of silicates [19]. (a) pH 1.8: (1) hornblende, (2) orthoclase, (3) labradorite; pH 3.7–8.8: (4) hornblende, (5) orthoclase, (6) labradorite. (b) pH 1.8: (1) kaolinite, Glukhovetsk, (2) the same, Podol’sk, (3) montmorillonite, Askania, (4) the same, near Askania; pH 3.7–8.8: (5) kaolinite, Glukhovetsk, (6) the same, Podol’sk; (7) montmorillonite, Askania, (8) the same, near Askania.
Table 4. Proportionality coefficient k in Equation (4) as a function of solution pH.
pH 1.8 3.7 4.9 6.8 7.8 8.8
k 0.57 0.57 0.54 0.51 0.46 0.46

According to the data in Table 5, the amount of silicon removed from the studied silicates and replaced by phosphates at pH 3.7–8.8 reached 6.5–11.0% of the initial silicon content in the minerals. Even more silicon (up to 9.4–19.9%) entered the solution at pH 1.8, when the process of phosphatization was accompanied by the acid leaching of silicates, which led to an additional release of silicon and violation of equivalence (3). Such large amounts of removed silicon and absorbed phosphorus, which were much higher than the limiting values of the sorption removal of phosphates, definitely indicated the occurrence of a chemical reaction which replaced the silicate with a phosphate mineral.

Table 5. Amount of silicon passed into solution in the experiments on phosphatization of silicates at the maximum initial concentration of phosphates 1, % of the initial concentration in the mineral [19].
Mineral pH
1.8 3.7–8.8
Hornblende 19.4 11.0
Orthoclase 11.2 8.1
Labradorite 12.3 8.0
Kaolinite, Glukhovetsk 18.0 7.8
As above, Podol’sk 19.9 8.6
Montmorillonite, Askania 9.4 6.5
As above, near Askania 12.4 6.9

1 5 mM for hornblende, orthoclase, and labradorite; 6 mM for kaolinite and montmorillonite.

In previous studies [21,22,23,24,25], the negative correlation between the variations in the concentrations of dissolved phosphates and silicon was associated with the adsorption exchange of phosphate ions and silica on the surface of silicates. Since the duration of the experiments did not exceed several days, this time was sufficient to establish the adsorption equilibrium but was not long enough for noticeable progress in the phosphatization reaction of the bulk silicate phase. Our experiments proceeded for more than one year, so the amount of phosphorus absorbed from the solution and the silicon displaced from the solid phase indicated the participation in the process of not only the surface layer, but also the volume of the solid phase.
The same quantitative characteristics of the process of phosphatization for all the studied silicates, corresponding to different structural types and with different chemical compositions, were an unusual result. It can be assumed that the initial minerals were not subject to phosphatization, but that the secondary silicate phases formed during the interaction of the silicates with water and were stable in a certain pH range. The parameters of the phosphatization reaction at pH 1.8 varied due to the stability under these conditions of the surface silicate phase, which was different to that in the area of higher pH values.
A powerful factor of the phosphorus mobilization in the Critical Zone is the activity of living organisms. Primary producers annually synthesize about 140 Gt of dry organic matter on land, 98–99% of which is mineralized. With the average phosphorus content in plants equal to ~1500 μg/g dry matter, about 210 Mt of phosphorus participates in the biotic cycle, which forms soluble phosphates at the stage of mineralization and becomes a potential source of dissolved phosphorus in continental runoff. However, mineralized phosphorus is almost completely reincluded in the biotic cycle and used to create new organic matter. The highest degree of completeness of the biotic cycle is inherent in mature biogeocenoses (Table 6).
Table 6. Phosphorus input with litter and removal with subsurface runoff in forest biogeocenoses [26].
Process Oak Forest Aspen Forest
Input with litter, kg/ha yr 7.85 9.9
Removal with subsurface runoff, kg/ha yr ~0.001 ~0.0015
Phosphorus removal, % of input with litter 0.013 0.015
If all mineralized phosphorus was a part of river runoff, the volume of which is 41,700 km3/yr [27], its concentration due to this source alone would be 5 mg/L. Such high concentrations of dissolved phosphorus are extremely rare and usually associated with the reducing conditions of the environment or anthropogenic pollution. The average concentration of dissolved phosphates in unpolluted river waters is equal 30–50 µg P/L [28,29,30], which is 0.6–1.0% of the calculated value of 5 mg P/L. This means that continental runoff contains a very small portion of the labile phosphorus that is formed as a result of organic matter degradation.
It is known that when phosphorus fertilizers are applied to soils, the behavior of the phosphorus differs significantly depending on the properties of the soil and the fertilizers themselves. Poorly soluble phosphorite flour increases the content of biologically available phosphorus if the soil conditions are conducive to the transformation of apatite into more soluble forms. With the addition of highly soluble fertilizers, over time, phosphorus immobilization occurs due to chemosorption and the formation of poorly soluble compounds, including apatite phases. It is assumed that phosphates of iron, aluminum, and calcium make up ~90% of the immobilized phosphorus of fertilizers [31].
Whereas the final products of the transformation of fertilizers are represented by poorly soluble mineral phases, there is usually no direct relationship between the amount of applied phosphorus and its removal. The amount of removed phosphorus from fertilizers, as a rule, does not exceed 1–2% [32,33,34,35].
Formally, the mobility of chemical elements in the Critical Zone is characterized by the coefficients of water migration Ki, equal to the ratio of the concentrations of element i in the dry residue of water (ai) and in drained rocks
Phosphorus belongs to the group of low-mobility elements with 0.01 < Ki < 0.1 [36].
In (5), it is implicitly assumed that all the substances in the dry residue of water enter it as a result of the dissolution of drained rocks. However, there are two other powerful sources of dissolved matter: cyclic sea salts, transported from the ocean to land through the atmosphere, and anthropogenic substances. Taking into account the contribution of these sources leads to a significant change in the values of the coefficients of water migration, in particular, to an approximately tenfold increase of this coefficient for phosphorus (Table 7).
Table 7. Coefficients of water migration of chemical elements in the Critical Zone taking into account the contribution of cyclic sea salts and anthropogenic substances [37].
Cl S Na F C Mg Ca K P Si Mn Fe Ti Al
9.6 9.2 4.0 3.3 3.3 2.4 2.4 0.93 0.81 0.27 0.22 0.02 0.01 0.01

2. Phosphorus in River Runoff

2.1. Phosphorus in the Waters of the Primary Hydrographic Network

The primary hydrographic network consists of small catchments, which are characterized by the significant spatial variability of the chemical composition of the waters, caused by the territorial heterogeneity of geomorphological, lithological, and biological soil conditions. The enlargement of rivers and pooling of small catchments leads to the “averaging” of the local conditions for runoff formation. Therefore, the larger-scale regularities associated with the implementation of the periodic law of geographic zonality are acquiring decisive importance.
The lithological characteristics of the catchments have a strong influence on the phosphorus concentration in the waters of the primary hydrographic network, because rocks are the main source of dissolved phosphorus. The highest concentrations of dissolved mineral phosphorus are found in catchments located on basalts, in which the phosphorus content is greater than in other types of rocks (Table 8). The runoff of dissolved phosphorus from drainage basins composed of sedimentary rocks is usually greater than for igneous rocks. In the small, almost completely forested catchments on the Canadian Crystalline Shield, the dissolved phosphorus runoff was 4.8 (2.5–7.7) mg/m2 yr for igneous rocks and twice as large (10.7 (6.0–14.5) mg/m2 yr) for sedimentary rocks [38].
Table 8. Relationship between the concentration of dissolved mineral phosphorus in the waters of the primary hydrographic network and phosphorus content in the catchment rocks.
Lithological Composition of Catchments Phosphorus Concentration
in Water, μg/L [29] in Rock, μg/g [8,9]
Sandstones 2 620
Granites 3 600
Limestones 2 480
Basalts 20 1300
Carbonaceous shales 3
Mica schists 4 550
Gypsum-bearing clays 1
Another important factor of phosphorus migration is the climate, which affects the rate of weathering and, consequently, the intensity of the phosphorus mobilization from rocks. For example, the runoff of dissolved phosphorus from the territory of Karelia (NW Russia, temperate climate) due to the pure weathering of crystalline rocks is 2 mg/m2 yr [39], while the average intensity of dissolved phosphorus removal during the weathering of crystalline rocks for three catchments in Brazil (humid tropical climate) is 5 times higher: 10 (5–14) mg/m2 yr [40].
The presence of areas with slow water exchange in catchments leads to a decrease in the phosphorus content in the waters of the primary hydrographic network. Indeed, Conley et al. [41] showed an exponential dependence of the concentration of total dissolved phosphorus ([Ptotal], μg/L) on the relative area of lakes (S, %) in catchments:
Data on the content of dissolved phosphorus in the waters of the primary hydrographic network, to which catchments with an area ≤50 km2 were assigned, were collected during observations that lasted for at least a year and were systematized in [42]. Based on the differences in the sources of phosphorus input, the conditions of runoff formation, and the processes in the catchments, all catchments were divided into four groups: (1) natural (forest) catchments; (2) mixed agricultural–forest catchments with land use <50%; (3) agricultural catchments with land use >50%; (4) urban catchments. For a number of catchments, the group could not be determined due to the lack of the necessary data.
Table 9 shows that the values of the arithmetic and median mean concentrations of mineral and total phosphorus in solution for all the accounted catchments differed several times, indicating the positive asymmetry of the probability distribution functions, which corresponds to the lognormal law. When the small catchments were combined into groups, the asymmetry of the probability distribution functions for the phosphorus concentrations remained. Therefore, the average median concentrations of mineral and total phosphorus, equal to 31 and 95 μg/L, can be considered as the global average concentrations of these forms of dissolved phosphorus in the waters of the primary hydrographic network under modern conditions.
Table 9. The average content and concentration range of dissolved phosphorus (μg/L) in the waters of the primary hydrographic network [42].
Component Number of Catchments Arithmetic Mean Median Mean Minimum Maximum
Forest catchments
Pmin 67 15 7 0 114
Ptotal 40 58 28 3 806
Mixed agricultural–forest catchments
Pmin 23 88 48 6 435
Ptotal 24 142 90 17 589
Agricultural catchments
Pmin 34 218 116 2 1145
Ptotal 26 535 250 7 3255
Urban catchments
Pmin 6 708 700 101 1572
Ptotal 5 1605 1500 163 3300
All accounted catchments, including catchments of unknown type
Pmin 137 115 31 0 1572
Ptotal 103 301 95 3

3300

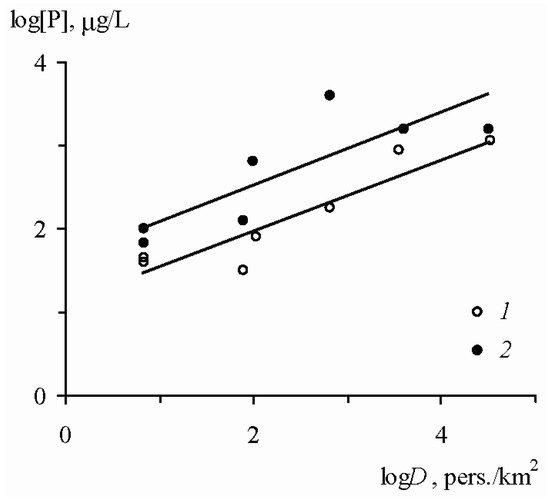
The lowest concentrations of the dissolved forms of mineral and total phosphorus in the surface waters (7 and 28 μg/L) were observed in the forest landscapes with the least anthropogenic impact. As the economic activity intensified, the phosphorus content increased. For the mixed agricultural–forest catchments, the average concentrations of Pmin and Ptotal were 48 and 90 μg/L, while for the agricultural catchments they increased to 116 and 250 μg/L. An even higher content of dissolved phosphorus was characteristic of the urban catchments, where the average concentrations of Pmin and Ptotal reached 700 and 1500 μg/L. In general, there was a tendency towards an increase in the concentrations of Pmin and Ptotal in the surface waters of the small catchments as the population density increased (Figure 4).
Figure 4. Relationship between the average annual concentrations of dissolved forms of mineral (1) and total (2) phosphorus in the waters of the primary hydrographic network and the population density D [6].

2.2. Phosphorus in River Waters

The rivers of the world carry into the ocean ~3 Gt/yr of dissolved matter and 15–20 Gt/yr of solid matter. The phosphorus runoff in the form of particulate suspended matter significantly exceeds its dissolved flux, which plays an extremely important role for biota and biogeochemical processes.

2.2.1. Phosphorus of Suspended Matter and Bed Load

The distribution function of the phosphorus content in suspensions of 77 large, medium, and small rivers of the world corresponds to a lognormal law; the arithmetic and geometric mean concentrations of phosphorus equal 1500 and 1000 µg/g [43], respectively, which is close to the estimate [44]: 1270 µg/g. About 3% of the phosphorus in river suspended matter is represented by bioavailable soluble/exchangeable forms that can be used by living organisms [45,46].
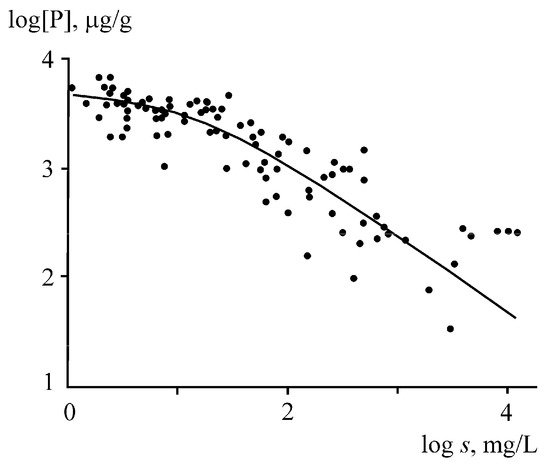
Phosphorus runoff in the form of suspended solids is affected by the ratio of fine and coarse fractions. The phosphorus content in the fine fractions of the suspended matter and bottom sediments of rivers is 2–10 times higher than that in the coarse fractions. The consequence of this is apparently a decrease in the phosphorus concentration in river suspensions, with an increase in the total content of suspended solids (turbidity), which is accompanied by an increase in the proportion of the coarse fractions (Figure 5). The highest phosphorus concentrations (~4000 μg/g) are observed at a turbidity <20 mg/L, while at a turbidity >100 mg/L, the phosphorus concentration begins to decline sharply, reaching 400 μg/g at a suspended matter content of 1000 mg/L. The same reason leads to an inverse relationship between the concentration of phosphorus in suspended matter and the water discharge or erosion rate. At small discharges during the low-water period, the relative contribution of fine suspensions increases and the phosphorus concentration reaches its maximum values, while in the high-water period, the bulk of suspended solids are represented by coarse suspensions with low phosphorus content.
Figure 5. Relationship between the phosphorus content in suspended matter and the turbidity (s) of river waters [43].
The use of fertilizers is accompanied by an immobilization of the phosphorus in the upper soil horizons, which are the main supplier of suspended matter. As a result, the phosphorus content in suspensions denudated from cultivated lands is approximately 2 times higher than in the runoff of solids from forest catchments: 2500 and 1100 μg/g, respectively [47].
Forests prevent the erosion of the earth’s surface and should reduce phosphorus runoff. This is confirmed by the data for seven small catchments in Southern Quebec [48], where the relationship between the concentration of suspended phosphorus ([Psusp], μg/L) and the degree of forest coverage of the territory (X, %) was established:
Deforestation should lead to an increase in suspended phosphorus runoff on a global scale, but it is still very difficult to quantify this effect.
It is estimated that 10 to 30% of the river runoff of solid matter is carried in the form of bed load, in which the phosphorus content is on average 800 µg/g [49]. This value is lower than the phosphorus content in river suspended matter (1000 μg/g), which corresponds to the larger hydraulic size of the bed load.

2.2.2. Dissolved Phosphorus

In [50,51], the average annual and long-term average annual data on the content of the dissolved forms of mineral and total phosphorus in 179 rivers of the world (>200 observation stations) are summarized. The arithmetic and median mean concentrations of dissolved mineral phosphorus are 113 and 28 μg/L, respectively, and those of total dissolved phosphorus are equal to 241 and 85 µg/L (Table 10). The distribution of the concentrations of dissolved phosphorus obeys the lognormal law; therefore, the median mean concentrations are preferred for obtaining average values.
Table 10. The average content of dissolved phosphorus (μg/L) in the river waters of different geographic zones [50,51].
Geographic Zone Number of Stations Arithmetic Mean Median Mean
Pmin
Arctic and subarctic zones 7 76 6
Temperate zone 123 132 32
Humid tropics and subtropics 19 39 16
Dry tropics and subtropics 33 93 31
Whole world 182 113 28
Ptotal
Arctic and subarctic zones 3 235 19
Temperate zone 68 247 106
Humid tropics and subtropics 12 226 91
Dry tropics and subtropics 14 228 175
Whole world 97 241 85
Most of the natural factors affecting the content of chemical elements in river water are closely related to the geographic zonality, which determines the features and intensity of the weathering processes, biological activity, etc. In this regard, to analyze the spatial distribution of phosphorus content, all rivers were divided into four groups according to their geographical zones: Arctic region and subarctic zone, temperate zone, humid tropics and subtropics, and dry tropics and subtropics.
The minimum median mean concentrations of the dissolved forms of mineral and total phosphorus were observed in the rivers of the Arctic and subarctic belts, where the biological cycle of elements is much slower and the anthropogenic impact on the aquatic environment is not pronounced, given that there are no extensive sources of phosphorus input associated with agricultural industries, fewer large cities, and, therefore, less industrial and domestic wastewater. The highest median mean concentrations of dissolved mineral phosphorus were characteristic of the rivers of the temperate zone and the zone of dry tropics and subtropics. This is explained by the powerful anthropogenic impact on the nature of these regions, as well as the favorable conditions for the involvement of phosphorus in the biological cycle and its rapid turnover therein. A similar situation is typical for total dissolved phosphorus.
The average annual concentrations of the dissolved forms of mineral and total phosphorus for the rivers of the world correlate with the mineralization of river water (r = 0.94 and 0.89, respectively) and with the concentration of total nitrogen (r = 0.81 and 0.79, respectively) [51]. The cycles of nitrogen and phosphorus are closely linked in the biological cycle of matter and liable to similar anthropogenic changes. Like phosphorus, nitrogen is used in mineral fertilizers and its concentration in wastewater also increases tens and hundreds of times. A rather close correlation between dissolved phosphorus and the mineralization of waters is interesting. It can be assumed that it arises due to an increase in the mineralization of river water in the north–south direction parallel to an increase in the population density, which is an indicator of the anthropogenic load and, in particular, of the intensity of anthropogenic phosphorus sources. Indeed, the average concentrations of mineral and total phosphorus in the river water regularly increase with an increase in the population density in the catchments (Table 11).
Table 11. The average content of dissolved phosphorus in the water of rivers with different population densities in their catchments [51].
Population Density D, pers./km2 Concentration, μg/L
Pmin Ptotal
<1 21 81
1–10 28 76
10–50 34 157
50–100 39 139
100–200 193 120
200–700 556 598
According to [52], for large rivers there is only a weakly expressed tendency towards an increase in the runoff of dissolved mineral phosphorus with an increase in the population density in the catchments. However, if one takes into account the presence of a directly proportional dependence of phosphorus removal from catchments on the value of specific water discharge, a significant correlation (r = 0.78) is found between the runoff of dissolved mineral phosphorus and the population density in the catchments, normalized to the specific water discharge.
The intensification of economic activity is accompanied by an increase in the phosphorus content in river runoff. Systematic observations carried out in 1936–1980 on the territory of the USSR showed a noticeable increase in the concentration and runoff of dissolved mineral phosphorus over time (Table 12). The same was established for other large rivers of the world, including the coastal parts of the sea basins into which these rivers flow [53].
Table 12. Change in water runoff (Q, km3/yr), concentration ([Pmin], μg/L) and runoff (JPmin, thous. t/yr) of dissolved mineral phosphorus in the USSR in 1936–1980 [54].
Drainage Basin 1936–1970 1970–1980
Q [Pmin] JPmin Q [Pmin] JPmin
Arctic Ocean 2746 6.2 16.9 2849 13.5 38.5
Pacific Ocean 866 12.8 11.1 726 27.2 19.8
Atlantic Ocean 261 24.6 6.4 235 38.2 9.0
Aral–Caspian 381 29.4 11.2 315 45.3 14.2
Former USSR territory 4250 10.7 45.6 4120 19.8 81.5
Environmental protection measures can not only stop the increase in dissolved phosphorus concentrations but also cause its significant decrease. In particular, due to a reduction in the volumes of municipal wastewater and the use of phosphorus-containing detergents, the total phosphorus runoff into Lake Erie decreased from 27.9 to 10.5 thous. t/yr during 1968–1981 [55]. The deepening of wastewater treatment and a decrease in its volume led to a decrease in the phosphorus runoff into the Rhine and Elbe rivers from 51.1 and 20.5 thous. t/yr, respectively, in 1983–1987 to 20.5 and 12.5 thous. t/yr in 1993–1997 [56].

2.3. Phosphorus in Groundwater in the Zone of Active Water Exchange

The surface waters of the primary hydrographic network, rivers and lakes, are in direct hydrodynamic connection with groundwater, which plays an important role in the formation of the chemical composition of the continental runoff of dissolved matter. The greatest influence is exerted by the groundwater of the zone of active water exchange, the discharge of which is the main source of river runoff during the low-water period. The phosphorus content in groundwater is of the same order of magnitude as in the waters of the primary hydrographic network.
The average content of dissolved mineral phosphorus in the groundwater of the Critical Zone varies within the same order of magnitude: from 18 to 191 µg/L (Table 13). The maximum concentrations (191 and 127 μg P/L) were found in the waters of bog landscapes and steppes (dry savannah). The lowest phosphorus content was observed in the waters of permafrost zones and mountainous areas, in which the fluorine mobilization from rocks is impeded by the low temperature and relatively high water velocity, respectively. The concentrations of dissolved mineral phosphorus in the groundwater in areas of leaching and continental salinization, despite the significant difference in their mineralization, are relatively equal, amounting to 56.9 and 62.6 μg/L, respectively.
Table 13. The content of dissolved phosphorus in groundwater of the Critical Zone [57].
Groundwater Type [Pmin], μg/L
Groundwater of the provinces of permafrost  
Northern bog landscapes 26.3
Tundra landscapes 19.1
Northern taiga landscapes 21.7
Groundwater of the provinces of temperate climate  
Bog landscapes 191
Mixed forest landscapes 59.5
Southern taiga landscapes 57.1
Forest-steppe and steppe landscapes 75.8
Groundwater of the provinces of tropical and subtropical climate  
Wet savannah landscapes 29.4
Rainforest landscapes 65.3
Subtropical forest landscapes 58.7
Landscapes of dry savannah and steppes 127
Groundwater of the provinces of arid climate  
Landscapes of the temperate continental zone:  
soda waters 20.6
sulphate waters 63.3
chloride waters 21.7
Landscapes of the dry tropical zone 76.7
Groundwater of the mountainous areas  
High-mountain and mountain–meadow landscapes 18.0
Mountain–forest and mountain–taiga landscapes 40.1
Mountain–steppe landscapes 46.8
Average concentrations  
Groundwater of the leaching areas: 56.9
permafrost 22.6
temperate climate 98.2
tropical and subtropical climate 71.8
mountainous areas 34.9
Groundwater of the areas of continental salinization 62.6
Average for groundwater of the Critical Zone 58.0

2.4. Integral Characteristic of the Phosphorus River Runoff

2.4.1. Phosphorus Runoff in the Composition of Suspended Matter and Bed Load

The average phosphorus concentrations in the suspended matter and bed load of world rivers are 1000 and 800 μg/g, respectively [49]. The most detailed calculations of the global runoff of suspended matter give a value of 15.5 Gt/yr [58,59]. The mass of the bed load, according to various estimates, is from 10 to 30% of the mass of suspended matter, and 20% can be taken as an average value. Hence, the total continental runoff of suspended and drawn phosphorus is equal to 18.0 Mt/yr. This value is in close agreement with earlier estimates, 16.1 [44] and 20.4 [60] Mt P/yr; however, these did not take into account the runoff of bed load.
Phosphorus is also carried out from land via ice runoff and coastal abrasion. Here, phosphorus is mainly contained in the lithogenic material, while the contribution of its dissolved forms is negligible. The phosphorus content in the products of glacial erosion and coastal abrasion can be taken to equal that in the rocks of the land surface: 690 μg/g. A.P. Lisitsyn [61] estimates the removal of the solid products of ice runoff and coastal abrasion to be 1.5 and 0.5 Gt/yr, which corresponds to a phosphorus mass of 1.4 Mt/yr.

2.4.2. Dissolved Phosphorus in River Runoff

A detailed assessment of river phosphorus runoff was made in [50,51], where data for more than 100 medium and large rivers of the world were used and a correction for the value of the accounted water runoff for each continent was applied (Table 14). The total volume of continental water runoff in these works was taken to be equal to 38,500 km3/yr. The more correct value is 41,700 km3/yr [27], which would mean that the river runoff of dissolved mineral and total phosphorus increases to 1.6 and 4.5 Mt/yr, respectively.
Table 14. River runoff of dissolved forms of mineral and total phosphorus [50,51] 1.
Continent Water Runoff, km3/yr % of Accounted Water Runoff Phosphorus Runoff, thous. t/yr
Pmin Ptotal
Pmin Ptotal Accounted Full Accounted Full
Europe 2365 80 52 92.3 116 160 310
Asia 10,152 53 484 913 1094
North America 7840 12 24 9.8 82 237 988
South America 11,700 84 22 124 148 286 1300
Australia and Oceania 2370 4 1 1.9 48 1.2 205
Africa 4110 49 34 58 120 85 249
Whole world 38,537
(41,700)
52 19 770 1481
(1603)
769 4154
(4495)
1 Values in parentheses are calculated for water runoff of 41,700 km3/yr.

2.4.3. Dissolved Phosphorus in Groundwater Runoff

Groundwater phosphorus runoff is difficult to estimate due to the limited amount of available information. According to calculations [62], the proportions of the dissolved forms of mineral and total phosphorus in the groundwater and river runoff into the seas of the Russian Arctic are approximately the same, at 11–13% (Table 15). A similar proportion of dissolved mineral phosphorus in groundwater and river runoff also follows from the global estimates [63]. With an average concentration of phosphorus in the groundwater of the Critical Zone of 58 μg/L [57] and a groundwater runoff value of 2200 km3/yr, the phosphorus removal into the ocean is 0.13 Mt/yr, or ~8% of the river runoff of dissolved mineral phosphorus.
Table 15. The proportion of dissolved phosphorus in groundwater and river runoff into the marginal seas of the Russian Arctic [62].
Receiving Water Body Proportion of Groundwater Runoff from River Runoff, %
Water Pmin Ptotal
White and Barents Seas 14.6 15.3 15.5
Kara Sea 10.3 12.3
Laptev Sea 7.6 6.9 5.1
East Siberian Sea 6.7 5.8 6.6
Average for the Arctic seas of Russia 10.0 12.8 1 10.7 1
1 Weighted mean for water runoff.

3. Phosphorus in the Mixing Zone of River and Sea Waters

The final stage of the transformation of the river runoff of dissolved and suspended matter is carried out in the mouth area of rivers, as a result of which the ratio of the dissolved and suspended forms of chemical elements entering the ocean changes.
The dissolved components with conservative behavior are involved in intrabasin chemical and biological processes to an insignificant extent, and their content linearly depends on the ratio of the proportions of the sea and river water masses in the mixing zone. The components with nonconservative behavior are also added into the solution or are removed from it as a result of their involvement in different processes occurring in the water column or at the water–air and water–bottom boundaries. In this case, the linearity of the relationship between the component concentration and the ratio of the water mass proportions is violated. The best indicator of the ratio of the sea and river water mass proportions is the isotopic composition of water; however, the concentration of chemically inert chlorides, which is more accessible for measurements, is used more often.
The conservative behavior of the dissolved component i in the mixing zone of river and sea waters is described by the linear relationship between its concentration [i]mix and chloride content [Cl]mix:

[i]mix = a + b[Cl]mix,

where a ≈ [i]rw is a constant parameter; b is the slope ratio taking positive or negative values at a higher or lower concentration of the component i in seawater in comparison with river runoff; and the subscript “rw” denote the concentrations in river water. If the componenti is removed from the solution or, on the contrary, its internal source is present, the line showing the actual distribution of the concentrations of the relevant component is located, respectively, below or above the calculated line of conservative behavior (Figure 6). This equation is widely used to determine the type of behavior of chemical components in the mixing zones of river and sea waters.
Figure 6. Relationships between the concentration of dissolved component i and chloride content by the conservative behavior (1) and availability of processes of additional input (2) or removal (3) of this component in the mixing zone of river and sea waters: (a,b) are cases when the concentration of component i in the river water is accordingly below or above that in the seawater.
Active participation in biological processes brings about the nonconservative behavior of phosphorus, which is observed in most river mouths of the world. The consumption of dissolved mineral phosphorus by phytoplankton leads to a decrease in its content in the water down to “analytical zero”. The mineralization of the precipitated organic detritus causes the input of phosphorus into a solution in the lower layers of the water column and at the water–bottom boundary. Approximately half of the phosphorus entering the bottom as part of the organic detritus, after the mineralization of organic matter, can return back to the water with circulating currents or during the stirring up of the bottom sediments [64]. In addition to the production–destruction processes, an important role in the transformation of dissolved phosphorus runoff in the mixing zone of river and sea waters is played by the transformation processes of phosphorus-containing solid phases, sorption–desorption, and coprecipitation, as well as the diagenetic processes that control the phosphorus fluxes at the water–bottom boundary [6].
Table 16 summarizes the data on the distribution of the concentrations of the dissolved forms of mineral, organic, and total phosphorus in the mouth areas of large and small rivers of the world. The behavior of phosphorus in river mouths can be both nonconservative and conservative. In some cases, a complex type of phosphorus distribution was established exhibiting different behavior in various parts of the mixing zone.
Table 16. The behavior of dissolved phosphorus in the mouth areas of world rivers.
River Receiving Sea Area Phosphorus Form Observation Period Salinity, ‰ [P], μg/L Phosphorus Runoff Transformation, % Supposed Cause of nonconservative Behavior Refe
rence
Observation Zone Transformation Zone River Boundary Sea Boundary
Severn Bristol Channel of the Atlantic Ocean Pmin June 1975 0–28 16–26 610 80 +10 Wastewater inflow [65]
February 1976 0–32 5–28 310 100 +20 As above
Clyde Irish Sea Pmin April 1973 0–32 1–8 242 15 −68 Sorption on suspended matter [66]
March 1974 0–32 40 242 ~0
Scheldt North Sea Pmin January 1978 0–35 280 62 ~0 [67]
Rhine–
Meuse
As above Pmin 0–35 465 62 ~0
Ems Pmin October 1981 14–30 40 ~0 [68]
Weser Pmin 0–32 520 62 ~0
Elbe Pmin 0–31 200 68 ~0
Neva Baltic Sea Pmin August 1990 0–5 0–3 13 31 −82 Biological consumption [69]
Ptotal 0–5 0–3 36 17 −49 As above
Keret White Sea Ptotal July 1992 0–23 0–18 5.0 14 −62 [70]
Pulonga As above Ptotal 0–25 0–5 7.0 14 −48
Knyazhaya Pmin June 2000 0–26 5.3 3.3 ~0 [71]
Niva Ptotal July 1992 0–20 9.0 11 ~0 [70]
Pmin 0–20 0–10 3.8 1.3 −33 Biological consumption
June 2000 0–27 0–10 9.7 3.5 −46 As above [71]
June 2016 0–19 0–13 5.5 12 +35 Destruction of organic matter A.S. 1
Kolvitsa Pmin June 2000 0–28 5.7 3.3 ~0 [71]
June 2016 0–21 0–13 5.4 12 +35 Destruction of organic matter A.S.
Stream in the Por’ya Inlet Pmin July 2008 0–23 0–12 4.4 2.1 −21 Biological consumption [72]
Kuzreka Pmin February 2020 0–23 0–2 2.5 6.8 +70 Destruction of organic matter A.S.
Indera Pmin September 2008 0–24 0–12 5.6 2.1 −25 Biological consumption [72]
Chavanga Pmin 0–24 0–12 3.0 2.1 −46 As above
Strelna Pmin February 2010 0–10 0–10 4.3 2.5 −18 A.S.
Onega Pmin August 2004 0–21 0–12 11 4.7 −20
June 2011 0–18 0–2 1.4 0.5 −43 [73]
January 2017 0–6 6.9 12 ~0 A.S.
August 2017 0–18 0–10 3.0 5.0 +56 Destruction of organic matter
Porg June 2011 0–18 0–10 3.9 5.6 +51 As above [73]
January 2017 0–6 0–4 43 7.0 +100 A.S.
0–6 4–6 43 7.0 −30 Mineralization
August 2017 0–18 0–6 16 6.0 −21 As above
Ptotal June 2011 0–18 0–10 5.3 6.1 +26 Biological consumption and destruction of organic matter [73]
January 2017 0–6 0–4 50 19 +44 Destruction of organic matter A.S.
0–6 4–6 50 19 −40 Mineralization
August 2017 0–18 0–4 19 11 −10 As above
Kyanda Pmin August 2016 0–21 0–18 16 5.3 −8 Biological consumption
Porg 0–21 0–4 25 6.5 −15 Mineralization
Ptotal 0–21 0–14 41 12 −18 Biological consumption and mineralization
Northern Dvina Pmin April 2003 0–25 0–18 32 9.0 −17 Biological consumption [74]
June 2003 0–23 0–6 18 7.3 −22 As above
July 2016 0–14 0–2 3.1 2.3 −22 A.S.
Porg 0–14 0–7 11 5.3 +110 Destruction of organic matter
Ptotal 0–14 0–7 14 7.6 +93 As above
Mezen Pmin July 2009 0–21 0–1 27 10 +88 Input from bottom sediments [73]
August 2015 0–21 0–1 25 6.0 +93 As above [75]
Porg July 2009 0–21 2.5 0.5 ~0 [73]
Ptotal 0–21 0–1 30 11 +82 Input from bottom sediments
Semzha Pmin August 2018 0–17 8.7 6.6 ~0 A.S.
Indiga Barents Sea Pmin April 1981 0–30 2.0 18 ~0 [76]
September 1981 0–30 6.0 4.0 ~0
Pechora Pechora Sea Pmin July 1984 0–30 0–7 16 20 −75 Biological consumption
Ob Kara Sea Pmin September 1993 0–34 0–20 43 50 −28 As above [77]
0–34 20–34 43 50 +120 Destruction of organic matter
August 1999 0–33 0–15 45 90 −33 Biological consumption
0–33 15–33 45 90 +150 Destruction of organic matter
Yenisei As above Pmin September 1993 0–34 0–20 5.0 50 ~0
0–34 20–34 5.0 50 +50 Destruction of organic matter
September 2009 0–30 0–12 20 33 −30 Biological consumption [78]
0–30 12–30 20 33 +100 Destruction of organic matter
September 2010 0–17 0–2 7.1 1.5 −57 Biological consumption
April 2016 0–26 0–10 19 22 −6 As above
0–26 10–26 19 22 +47 Destruction of organic matter
Rhone Mediterra-
nean Sea
Pmin 1983–
1984
1–37 170 6 ~0 [79]
Tiber Tyrrhenian Sea Pmin July 1984 0–37 93 280 ~0 [80]
November 1984 0–37 93 22 ~0
Ptotal July 1984 0–37 93 310 ~0
November 1984 0–37 155 22 ~0
Salgir Azov Sea Pmin February 2016 0–15 0–8 540 116 −29 Biological consumption A.S.
Porg 0–15 0–4 70 90 +54 Destruction of organic matter
Ptotal 0–15 0–4 610 206 −19 Biological consumption and destruction of organic matter
Chernaya (Crimea) Black Sea Pmin February 2004 0–17 0–2 7.1 1.8 −65 Biological consumption [81]
Anapka As above Pmin May 2014 0–16 0–3 18 13 +700 Input from bottom sediments [82]
Porg 0–16 0–7 8.8 0.7 −58 Mineralization
Ptotal 0–16 0–3 27 14 +450 Input from bottom sediments
Ashamba Pmin July 2010 0–15 0–11 14 11 +35 Destruction of organic matter
August 2010 2–13 2–9 82 25 −11 Biological consumption
January 2011 0–10 0–3 2.2 14 +950 Input from bottom sediments
Porg July 2010 0–15 0–11 1.0 5.0 −320 Mineralization
August 2010 2–13 2–9 21 6.4 −8 As above
January 2011 0–10 0–1 1.7 1.4 −80
Ptotal July 2010 0–15 0–11 15 16 ~0
August 2010 2–13 2–9 103 31 −8 Biological consumption
January 2011 0–10 0–3 3.9 15 +430 Input from bottom sediments
Mezyb Pmin September 2010 0–15 2–9 5.5 7.7 +180 Desorption from suspended matter
Porg 0–15 0–11 4.0 5.3 −37 Mineralization
Ptotal 0–15 2–5 9.5 13 +100 Desorption from suspended matter
Hotetsai Pmin September 2010 0–12 2–9 4.7 7.1 +170 As above
Porg 0–12 0.3 0.3 ~0
Ptotal 0–12 2–9 5.0 7.4 +170 Desorption from suspended matter
Vulan Pmin July 2006 0–16 0–2 8.0 1.9 −32 Biological consumption
Volga Caspian Sea Pmin August 2003 0–11 0–1 37 10 −60 As above [83]
August 2004 0–10 0–1 12 4.0 −63
August 2005 0–5 0–1 41 2.6 −91
September 2006 0–9 0–1 14 3.4 −64
Ural As above Pmin April 2016 0–8 0–5 16 29 +150 Input from bottom sediments [84]
April 2017 0–5 0–3 1.6 1.1 +300 As above
Mandovi Arabian Sea Pmin February 1981 0–36 0–12 3.0 6.0 −100 Sorption on suspended matter [85]
Cauvery Bay of Bengal Pmin July 1986 0–15 0–2 267 108 −98 Unspecified [86]
Chilka Lake As above Pmin November 1988 0–21 0–6 22 14 −24 Sorption on suspended matter [87]
Mekong South China Sea Pmin November 1987 0–26 0–2 25 9.0 −84 As above [88]
0–26 2–15 25 9.0 +300 Desorption from suspended matter
Yangtze East China Sea Pmin June 1980 0–27 18–22 15 <3 −100 Biological consumption [89]
November 1981 0–33 0–24 7.0 11 +63 Desorption from suspended matter
August 1981 0–32 25–28 23 <1 −44 Biological consumption [90]
Razdolnaya Sea of Japan Pmin July 2001 0–32 0–25 60 <5 −27 Biological consumption [91]
0–32 0–9 80 <3 −70 As above
August 2005 0–32 0–24 25 <3 −52 [92]
February 2008 0–34 0–7 75 15 −28 [93]
Serebryanka As above Pmin July 2009 1–18 1–15 8.4 8.4 +13 Desorption from suspended matter [94]
Porg 1–18 0.3 5.2 ~0
Ptotal 1–18 1–15 8.7 14 +12 Desorption from suspended matter
Usalgin Sea of Okhotsk Pmin July 2016 0–25 54 9.0 ~0 [95]
Ptotal 0–25 70 25 ~0
Uda As above Pmin 0–27 0–24 9.0 29 +100 Destruction of organic matter
Ptotal 0–27 0–24 10 30 +70 As above
Sacramento Pacific Ocean Pmin May 1976 0–29 0–20 84 43 +74 Unspecified [96]
July 1976 0–30 0–30 77 43 +56 As above
September 1976 0–30 0–28 81 15 +108
November 1976, March 1977 0–29 0–18 62 62 +125
Mississippi Gulf of Mexico Pmin March 1971 10–33 71 15 ~0 [97]
January 1973 6–33 81 5.0 ~0
May 1973 0–20 8–20 90 5.0 −68 Biological consumption
October 1983 0–34 0–3 248 3.0 +24 Dissolution of calcium phosphates [98]
Peace As above Pmin October 1981 0–30 0–25 2790 496 −80 Biological consumption [99]
Raritan Atlantic Ocean Pmin June 1982 0–22 0–3 12 50 −100 Sorption on suspended matter [100]
October 1982 0–27 0–9 600 31 −50 As above
Hudson As above Pmin March 1974 0–29 0–4 25 46 +156 Wastewater inflow [101]
August 1974 0–29 0–15 50 56 +250 As above
August 1988 0–29 0–12 62 68 +90
Old Mill Creek Pmin December 1978 0–27 0–9 6.0 12 +195 Desorption from suspended matter [102]
Orinoco Pmin November 1979 0–35 0–6 7.0 <3 +42 As above [89]
0–35 6–20 7.0 <3 −100 Biological consumption
Amazon Pmin May 1976 0–35 8–15 15 3.0 −80 Biological consumption [103]
December 1982 0–36 0–2 20 6.0 −15 Sorption on suspended matter [104]
0–36 2–20 20 6.0 +118 Desorption from suspended matter
May 1983 0–32 28 12 ~0
Zaire (Congo) Pmin November 1976 0–35 0–20 28 6.0 +100 Desorption from suspended matter [105]
May 1978 0–36 0–25 28 6.0 +100 As above
1 Data of A.V. Savenko.

3.1. Nonconservative Behavior of Phosphorus

Biological processes are the main reason for the nonconservative behavior of dissolved phosphorus in the mixing zones of river and sea waters. This is shown in the interrelated change in the phosphorus content and the various characteristics of the biological processes: the concentrations of nutrients, oxygen, chlorophyll, and organic detritus, and the pH value.
The leading role of production–destruction processes in the transformation of dissolved phosphorus runoff has been established for the mouths of many rivers (Table 16): Neva, the small rivers of the Kandalaksha Bay of the White Sea, Onega, Kyanda, Northern Dvina, Mezen, Pechora, Ob, Yenisei, most of the small rivers in the Black and the Azov Sea catchments, Volga, Ural, Yangtze, the Far Eastern rivers Razdolnaya and Uda, and Peace (USA). Due to the seasonal and interannual dynamics of phytoplankton development, the distribution of nutrients in the mixing zones of river and sea waters is also subject to seasonal and interannual variability.
The consumption of dissolved mineral phosphorus by biota occurs in the surface layer or in the vertically mixing water column throughout the entire salinity range and varies from 6 to 100% of its content in river runoff. The most intensive consumption of mineral phosphorus by aquatic organisms is observed during the vegetative season and is most often accompanied by the extraction from the solution of another biogenic element, silicon [71,72,73,74,82,83,91,92]. Along with this, in the mouths of some rivers (Strelna of the Kandalaksha Bay of the White Sea, Chernaya of the Sevastopol Bay of the Black Sea, and Razdolnaya of the Amur Bay of the Sea of Japan), the removal of dissolved mineral phosphorus was found even in winter, with relatively low biological activity.
Under stratification conditions, the plots of river and sea water mixing show the influence of two processes that regulate the concentration of dissolved mineral phosphorus at different depths. Either the behavior of phosphorus in surface waters is conservative, or it is removed as a result of biological assimilation, while in the deep layers, phosphorus, on the contrary, enters the solution due to the destruction of the organic matter deposited on the bottom. As a result, the relationships between the concentration of dissolved mineral phosphorus and the chlorinity (salinity) acquire orderliness only when the points are grouped along the horizons [77,78,103,106]. This distribution is typical for the estuaries of the Ob and Yenisei Rivers, in which aquatic organisms consume 6–57% of the mineral phosphorus supplied via river runoff, and the destruction of organic matter provides an increase in its concentration by 50–150%, relative to the content in the river water. A distinctive feature of the release of mineral phosphorus into the solution during the destruction of organic matter is the simultaneous entry into the water column of the mineral forms of nitrogen [77,96].
The predominance of destruction processes over production processes is also often found throughout the entire water column, periodically occurring in the mouths of the Onega River, some rivers of the Kandalaksha Bay of the White Sea, the Ashamba River of the Black Sea coast of Russia, and the Uda River of the Sea of Okhotsk, and leading to an increase in the flux of dissolved mineral phosphorus by 35–100%. An even greater transformation of river runoff under the influence of destruction processes occurs when pore solutions from stirred up sediments enter the mixing zone. This situation is typical for the mouths of the Mezen and the Ural Rivers and in some periods is observed in the mouths of the Black Sea rivers Anapka and Ashamba, where the additional input of mineral phosphorus into the solution exceeds its removal via river runoff by 90%, 150–300%, 7.0 times, and 9.5 times, respectively. Firstly, the organic matter in the bottom sediments is remineralized with the release of phosphates, and secondly, it can reduce iron (III) phosphates to iron (II) phosphates, which causes the input of part of the phosphorus into a dissolved state.
The behavior of dissolved organic phosphorus characterizes the process of the destruction of organic matter in the mixing zone of river and sea waters. Its additional intake indicates the excess of the rate of the release of dissolved organic forms over the rate of complete phosphorus recycling and is observed in the mouths of the Northern Dvina and Salgir Rivers. A decrease in the concentration of dissolved organic phosphorus relative to the line of the conservative mixing of water masses occurs at a higher rate of its mineralization than its release into the solution during destruction and was noted in the mouths of the Kyanda River and rivers of the Black Sea coast of Russia (Anapka, Ashamba, Mezyb, and Hotetsai). Both losses and excesses of dissolved organic phosphorus were recorded at the mouth of the Onega River in different periods and at different salinity intervals. The distribution of dissolved organic phosphorus is close to conservative at the Mezen River estuary and the Serebryanka River mouth (Sikhote Alin Reserve).
A significant part of the phosphorus in suspended matter in rivers is represented by reactive mineral and organic compounds, which can be sources of dissolved phosphorus in the mixing zones of river and sea waters. From the experimental data [107], it follows that the amount of phosphorus passing from river suspensions into the dissolved state increases with an increasing salinity.
Some curves of the distribution of dissolved phosphorus concentration have a deflection in the salinity range from 0 to 9‰ [103]. In this case, the similar form of such relationships for dissolved iron and aluminum in the absence of clear signs of the biological consumption of phosphorus indicates the physicochemical removal of the latter from the solution as a result of coprecipitation with iron and aluminum hydroxides.
It can be expected that the terrigenous hydroxophosphates of iron and aluminum in the marine environment will be unstable due, firstly, to an increase in the pH value, accompanied by the displacement of phosphates by hydroxyl ions, and, secondly, to an increase in the concentration of dissolved calcium, which promotes the formation of apatite phases typical for ocean sediments. This assumption is confirmed by the results of observations [108], which showed that iron–calcium hydroxophosphates in oceanic pelagic sediments decompose during diagenesis into more stable iron oxyhydroxides and apatite. The replacement of the terrigenous hydroxophosphates of iron and aluminum with apatite should begin already in the river mouth areas and cause an increase in the concentration of dissolved phosphorus. Therefore, the input of iron and aluminum phosphates into the salinized portion of the river mouth area as a component of the suspended matter and bed load can lead to a partial release of dissolved phosphorus and, in some cases, be the cause of its nonconservative behavior. From these positions, one can explain the decrease in phosphorus content with the increase in salinity in the bottom sediments of the mouths of the Pamlico and Potomac Rivers [109,110].
Phosphorus removal as a result of sorption and coprecipitation processes occurs, as a rule, at the initial stage of river and sea water mixing during the period of low biological activity and is observed in the mouths of the rivers Clyde (Great Britain), Mandovi and Chilka Lake (India), Mekong (Vietnam), Raritan (USA), and Amazon, accounting for 15–100% of the removal of dissolved mineral phosphorus via river runoff (Table 16). The input of dissolved phosphorus due to desorption from river suspensions penetrating into the marine environment is also a common phenomenon established for the mouths of the Black Sea rivers Mezyb and Hotetsai, Mekong in the area of medium salinity, Yangtze, Serebryanka (Sikhote Alin Reserve), Old Mill Creek (USA), Orinoco (Venezuela), Amazon at medium salinity, and Zaire (Table 16). The maximum desorption values (13–300% of the content in river water, or 1–75 μg P/L) are reached at a salinity of 7–15‰, and the mixing curves have a convex shape.
The spatial separation of the processes of phosphorus sorption and desorption (predominance of sorption in the freshwater part of the mixing zone, and desorption in the area of intermediate salinity) confirms the distribution of phosphorus and iron in the bottom sediments of the river mouth areas. Thus, at the Pamlico River mouth, the concentrations of phosphorus and iron in the bottom sediments of the riverine part of the mixing zone closely correlate with each other (r = 0.98), whereas when approaching the sea boundary of the mouth area, this relationship becomes less pronounced (r = 0.86–0.77). The same concentrations of iron correspond to lower phosphorus concentrations in the marine part of the mouth, which indicates the release of the latter from the bottom sediments [111]. This combination of sorption and desorption in the estuaries is called the phosphate buffer mechanism [60,112,113,114]. Many authors have tried to determine the concentration of dissolved mineral phosphorus at which an equilibrium between the water and bottom sediments is established. According to experiments [99,112,113], the equilibrium concentrations of dissolved phosphates are in the range of 22–46 μg P/L. Convincing results of field observations proving the existence of such a concentration limit have not yet been obtained, although in the studied estuaries, with the exception of the Mekong River mouth, the concentrations of desorbed phosphorus do not really exceed the values recorded in the experiments and amount to 1–28 μg/L [82,89,94,102,104,105].

3.2. Conservative Behavior of Phosphorus

Despite the active participation of phosphorus in the intrabasin biological and chemical processes, cases of its conservative behavior were established (Table 16), which were observed either under conditions of the severe pollution of the aquatic environment (the mouths of the European rivers Clyde, Scheldt, Rhine–Meuse, Ems, Weser, Elbe, Rhone, and Tiber), or during periods of low biological activity (the mouths of the Mississippi River; Amazon River; the rivers of the Arctic; and the Far Eastern rivers Knyazhaya, Niva, Kolvitsa, Onega, Semzha, Indiga, Pechora, and Usalgin).
The concentration of dissolved mineral phosphorus in the waters of polluted rivers (93–520 μg/L) is an order of magnitude higher than its average content in the rivers of the world. Increased concentrations of dissolved mineral phosphorus were also found at the sea boundary of the mouth areas of these rivers: up to 242 and 280 μg/L on the near-shore zone of the Clyde and Tiber River mouths. The conservative behavior of phosphorus in the mouths of these European rivers can be explained by the fact that the absolute values of the fluctuations in its concentration in the mixing zones at such a high content in river or sea waters are comparable to the amount of phosphorus involved in the intrabasin processes. In addition, most of the observations in which the conservative behavior of phosphorus was recorded were carried out in the autumn–winter period, when the intensity of production processes in the temperate zone decreases with the intensification of the biological processes, and the conservative behavior of phosphorus can turn into nonconservative behavior within several weeks, which was noted, for example, for the Rhone River delta [115]. The conservative distribution of dissolved mineral phosphorus in the mouths of the Onega, Mississippi, and Amazon Rivers that appeared in the winter–spring period is also, apparently, caused by the low activity of aquatic organisms.
Separately, we should consider the conservative behavior of dissolved phosphorus during the vegetative season in the mouths of the small Arctic and Far Eastern rivers that are not subject to strong anthropogenic impact. The concentration of suspended matter in the mouths of these rivers in spring and early summer is small due to the slow thawing of soils in the catchments and the low water temperature preventing phytoplankton development, which limits the participation of phosphorus in physicochemical and biological processes.
Thus, the conservative behavior of dissolved phosphorus in the mixing zone of river and sea waters is an atypical phenomenon and occurs in special conditions when the biological and chemical processes at river mouths are suppressed as a result of an unfavorable combination of natural and anthropogenic factors.

3.3. Phosphorus Balance in the Mixing Zones of River and Sea Waters

An analysis of the mixing curves indicates the complex nature of the dynamics of dissolved phosphorus fluxes in river mouth areas, with the combination of conservative and nonconservative distribution and the spatiotemporal variability of the latter, including a change in the direction of transformation. Therefore, the calculations of the values of the removal or input of phosphorus in the mixing zones of river and sea waters based on data for relatively short time intervals turn out to be insufficiently representative for balance estimates.
To obtain more reliable estimates, Savenko and Zakharova [116] summarized the results of balance studies carried out in river mouths and bays for a year or more (Table 17). As follows from the data presented, on average, a significant part of the phosphorus is removed per year. The maximum removal (80–94%) is characteristic of the total phosphorus, including the suspended fraction (Pdissol + Psusp), and only a third of this value is associated with physical sedimentation, while the rest of the phosphorus is removed as a result of biosedimentation [117,118]. Biological processes also play a major role in the extraction of mineral phosphorus from the solution (40–80%) due to its transfer to the composition of suspended organic matter, which is subsequently deposited at the bottom. Total dissolved phosphorus (Ptotal) is retained in river mouths in much smaller amounts (7–38%). This is corresponds to the observational data presented in Table 16, according to which the losses of the dissolved forms of mineral and total phosphorus during biological consumption in the mixing zones of river and sea waters are on average 46 and 25%.
Table 17. Balance estimates of phosphorus losses in the river mouth areas and bays.
Object Phosphorus Form Observation
Period
[P], μg/L Phosphorus Balance, % Supposed Cause of Transformation Reference
River Boundary Sea Boundary
Gulf of Riga,
Baltic Sea
Pmin 1989 −57 Biological consumption [119]
Ptotal −7 As above
Vigo Bay, Spain Pmin 1986 394 12 −40 Biological consumption and sedimentation [64]
Ptotal −38 As above
Mikawa River mouth, Japan Pdissol + Psusp July 1983 930 −80 [118]
Delaware River mouth, USA Pmin April 1986–July 1988 −61 Biological consumption [120]
As above, winter −75 As above
As above, spring −135
As above, summer −70
As above, autumn +33 Destruction of organic matter
Ptotal April 1986–July 1988 −23 Biological consumption
As above, winter −53 As above
As above, spring −56
As above, summer −37
As above, autumn +52 Destruction of organic matter
Potomac River mouth, USA Pmin 1979–1981 −81 Biological consumption [121]
Huizache-Caimanero Lagoon, Mexico Pdissol + Psusp 1969–1981 93 170 −94 Biological consumption and sedimentation [117]

4. Conclusions

The formation of the chemical composition of surface waters begins already in the atmosphere during the interaction of aerosols with the condensates of water vapor: cloudy water and the water of atmospheric precipitation. The average median concentrations of mineral and total phosphorus in atmospheric precipitation are 15 and 33 μg/L, respectively; the values of the input of these forms into the earth’s surface are equal to 0.11 and 0.25 kg/ha yr. The content of the soluble forms of total phosphorus in atmospheric precipitation is in the range of 20–80%, with an average value of 55%.
The average median concentrations of dissolved mineral and total phosphorus in the waters of the primary hydrographic network are 31 and 95 μg/L, respectively. The concentrations of both forms increase with an increasing anthropogenic load: natural (forest) catchments < agricultural–forest catchments with land use less than 50% < agricultural catchments with land use over 50% < urban catchments. The concentration of dissolved mineral phosphorus, all other conditions being equal, increases with an increase of the phosphorus content in the catchment rocks.
The average median concentrations of dissolved mineral and total phosphorus in world rivers are 28 and 85 μg/L, respectively. The minimum values are observed in the rivers of the Arctic and subarctic zone; the maximum values are found in the most densely populated temperate zone and the zone of dry tropics and subtropics. The anthropogenic load is a dominant factor for riverine export, which is confirmed by the presence of a direct relationship between the concentrations of mineral and total phosphorus, on the one hand, and the population density, on the other hand.
The distribution of dissolved mineral and total phosphorus in the mixing zones of river and sea waters in the overwhelming majority of cases corresponds to nonconservative behavior. The conservative type of distribution is rarely observed and is found in the mouths of polluted rivers with high phosphorus concentrations, which significantly exceed the possible changes that occur as a result of biological and chemical processes. The decreases in the fluxes of dissolved mineral and total dissolved phosphorus at the river–sea geochemical barrier are 40–80% and 7–38%, respectively.

This entry is adapted from the peer-reviewed paper 10.3390/w14010016

This entry is offline, you can click here to edit this entry!
Video Production Service