Количественное определение циркулирующих микроРНК затруднено из-за их низкой концентрации, эффектов загрязнения клеток и отсутствия эндогенных элементов для нормализации [ 27 ]. Жидкости организма, такие как сыворотка крови, плазма и спинномозговая жидкость, содержат низкие концентрации общей РНК, из которых микроРНК составляют лишь небольшую часть. Кроме того, изучение профиля микроРНК в ЦСЖ затруднено из-за небольшого объема полученных образцов [ 58 ]. Несмотря на сложности выделения РНК из спинномозговой жидкости, описанные выше, были предприняты значительные усилия по разработке более эффективных методов выделения РНК.
В исследовании Burgos et al. (2013) была протестирована эффективность выделения РНК с помощью девяти коммерческих наборов, определяющих концентрацию тотальной РНК, полученной из образцов сыворотки, плазмы и ЦСЖ человека с неуточненным диагнозом. Образцы спинномозговой жидкости готовили в виде аликвот от 500 до 1500 мкл, к которым добавляли известное количество синтетических экзогенных малых РНК (называемых впрыскиванием) в качестве положительного контроля. Во всех тест-наборах использовались смеси гуанидин-тиоцианат и/или фенол-хлороформ, позволяющие разделить образец на водную фазу с РНК и органическую фазу, содержащую белки и ДНК. Для выделения РНК из водной фазы используются некоторые наборы (Max Recovery Bioopure RNA, TRI Reagent RT, TRI RT Blood, TRI Reagent RT — Liquid Samples и RNAzol) были основаны на осаждении РНК этанолом (или изопропанолом), в то время как другие (mirVana, mirVana Paris и miRNeasy) использовали твердофазную экстракцию и последующую адсорбцию на стекловолоконной мембране. Предполагается, что использование наборов для выделения РНК в водной фазе с последующим осаждением позволяет получить более высокий выход РНК по сравнению с колоночными наборами для выделения. Поскольку считается, что РНК с фильтров на колонках может не полностью вымываться, возможны потери в общем количестве суммарной РНК. Несмотря на эти предположения, три из четырех наиболее эффективных наборов были основаны на колонках с мембранным фильтром для выделения РНК. Наборы для выделения РНК продемонстрировали выход общей РНК из спинномозговой жидкости от 15 до 30 нг на мл. Кроме того, было показано, что концентрация РНК различалась среди технических повторов при использовании всех наборов. Несмотря на то, что авторы определили наиболее эффективные наборы для выделения РНК из ЦСЖ (MaxRecovery BiooPure RNA Isolation Reagent, mirVana miRNA Isolation Kit, mirVana PARIS), количество полученной РНК было слишком мало для последующего секвенирования.
Considering the above, Burgos et al. (2013) further optimized RNA extraction from plasma and CSF samples by rehydrating the interfacial and organic phases and re-extracting the RNA. It was found that with repeated extraction with phenol-chloroform, it is possible to increase the yield of miRNA by almost two times. However, repeating this step a third or fourth time did not lead to a significant increase in the amount of miRNA isolated. A volume of 500 μL of CSF was found to be sufficient for the extraction of RNA required to obtain reproducible miRNA analysis results [
58]. Subsequent studies have sought to further enhance the yield of recovered RNA through the use of glycogen or exogenous RNA (east + RNA or MS2 phage RNA) to act as a carrier to increase the RNA yield at the isolation stage [
59,
60]. The results obtained were somewhat ambiguous, as the increase in the concentration of RNA after the addition of glycogen only occurred with some of the extraction kits [
59].
In Akers et al. (2017) the authors investigated extracellular vesicle (EV) -derived miRNA from tumor tissue and CSF of patients with glioblastoma. The EV fraction from the CSF was isolated by a differential centrifugation method. EV pellets were resuspended in PBS; then, miRNA was isolated using the miRCURY RNA Isolation Kit. The amount of obtained miRNAs was estimated using real-time PCR since the concentration of the isolated RNA did not exceed 20 ng/μL. In addition to EV-derived miRNA, the authors examined miRNA from whole CSF and found that more miRNA species were found in whole CSF compared to the EV-enriched fraction. The authors also identified, for the first time, nine miRNAs from CSF as potential biomarkers of glioblastoma [
61]. A similar study was carried out by Kopkova et al. (2018a) [
62], who compared several approaches for the isolation of miRNA from CSF patients with glioblastoma and identified the most efficient miRNA purification kit as Norgen Biotek.
In a study by Gui et al. (2015) EV-derived miRNA from the CSF of patients with AD and PD obtained by differential centrifugation were extracted using the Qiagen miRNeasy Serum/Plasma Kit according to the manufacturer’s instructions. The authors tried to profile the expression of 746 miRNAs using TaqMan arrays. However, only 132 miRNAs (17.7%) were found, of which 27 and 6 miRNAs were differentially expressed in PD and AD, respectively, compared to the control group [
52].
Circulating and EV-derived miRNAs in the CSF (1 mL samples) of patients with various neurological disorders were investigated by Saugstad et al. (2017). For comparative analysis of the efficiency of isolation of total and EV-derived miRNA, four commercial kits were used. As expected, the RNA yield was higher when using kits specific to the isolation of total miRNA. The greatest difference was observed in CSF samples from patients with glioblastoma multiforme, where the total RNA obtained using the mirVana and miRCURY kits was in the range of 1.5–3.2 ng/μL, compared to 0.00–2.22 ng/μL of total RNA isolated using exoRNeasy and Total Exosome [
63].
To determine biomarkers in acute ischemic stroke, next-generation sequencing was performed using miRNAs isolated from 100 μL CSF using TRIzol reagent [
64] and compared to real-time PCR analysis of miRNAs isolated from 200 μL of CSF from a similar sample set using the miRCURY RNA Isolation kit for biofluids or the Norgen Biotek Total RNA Purification kit. The two analysis platforms, sequencing and real-time PCR, did not lead to identical results. The authors considered the reasons for this to be the relatively small sample set and a heterogeneous control group. Patients in the control group had different diagnoses, which may have influenced the changes calculated in relation to the group of people with stroke. The authors were also unable to confirm the results of their earlier pilot study [
65], highlighting the importance of further research, especially with a small sample of patients.
Obviously, obtaining high-quality RNA is the first step in studying miRNAs in CSF. The stage of RNA isolation from CSF plays an important role because it determines how complete the understanding of the miRNA profile will be. Since the concentration of miRNA in CSF is low, its isolation is difficult. Despite the fact that a fairly large number of different commercial kits for the isolation of RNA from various tissues and biological fluids have been developed, researchers are constantly looking for new protocols with good reproducibility and efficiency. Until now, there is no single standard, well-proven protocol for the isolation of RNA from CSF, which can lead to low interlaboratory reproducibility of the results and the objectivity of the data obtained.
3. Assessment of the Quality of the Obtained miRNA
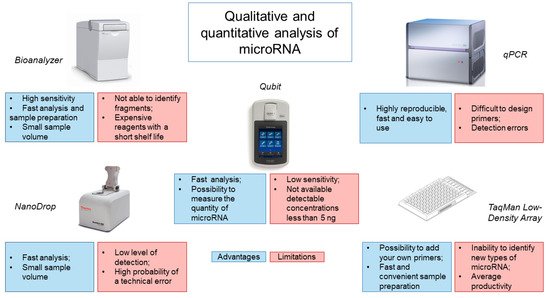
Analysis of the obtained miRNA isolated from CSF is most often performed using the Bioanalyzer capillary electrophoresis system (
Figure 1). This system has a high sensitivity of 50 pg/μL for RNA and requires minimal sample volumes (1 μL) to obtain accurate results [
66]. In addition, the system requires a minimum number of manipulations from the operator and is economical in terms of analysis time (25–45 min), depending on the number of samples and the chip used [
67]. However, the Bioanalyzer only shows the size of the RNA but does not identify RNA fragments, which may be disrupted rRNA, mRNA or long non-coding RNA. It is also worth noting the high cost of the device and reagents, which have a short shelf life, making this type of analysis less accessible.
Figure 1. Analysis of methods for determining the quantity and quality of microRNA from CSF.
Evaluation of the isolated miRNA is also possible using spectrophotometers, such as the NanoDrop. However, the NanoDrop is rather limited in its ability to detect the low levels of miRNA obtained from CSF. Our experience has shown that NanoDrop measurement accuracy depends on the frequency of instrument use/calibration and the nature of the samples being analyzed. A common alternative to the NanoDrop is the Qubit fluorometer. It works by adding a fluorescent probe to the sample, which specifically binds the target molecule to form a fluorescent complex. The light source produces an intensity of fluorescence that is proportional to the concentration of the analyte. The device measures the intensity of the glow and calculates the concentration. Using a fluorometer, the concentration of RNA can be quickly and accurately determined, while new models of the device allow for measurement of the amount of miRNA. However, the sensitivity of the instrument is low and the range of quantitation starts at 5 ng. Use of a spectrophotometer, a fluorimeter and microfluidic electrophoresis can provide information on the integrity and the amount of miRNAs, but unfortunately, there is a possibility of obtaining data with significant variability [
38,
42,
48,
63].
The low sensitivity of the above systems for assessing the quantity and quality of miRNA from CSF has led to the use of other microfluidic technologies, such as TaqMan Low-Density Array (TLDA), based on real-time PCR (
Figure 1). TLDA uses single-plex PCR with mapped primers for analysis. In this case, it is possible to add your own primers and probes, as well as to use a ready-made calibration curve. The advantage of this system is the speed and convenience of sample preparation, since reagents for each assay are already applied to the well [
68]. The disadvantage of this system is the inability to identify and measure new types of miRNAs and the average productivity by the criterion of the number of samples analyzed per day [
67].
The use of qRT-PCR is an alternative method. When used with a known amount of control miRNAs, it is possible to establish the efficiency of RNA extraction [
67]. This method is highly reproducible, fast and easy to use [
69]. However, existing commercial qRT-PCR kits use a strategy based on reverse transcription of mature miRNA molecules, which can lead to various detection errors. Another obstacle to qRT-PCR is that reaction conditions can vary and miRNA primers are difficult to design [
70]. The latter is associated with the length of mature miRNAs, which is insufficient for annealing with traditional primers designed for reverse transcription and PCR. In addition, miRNAs do not have a common sequence, for example, as poly (A) tail, which can be used for enrichment or as a universal primer-binding site for reverse transcription [
67].
Of course, the analysis of miRNA obtained after RNA extraction from CSF is very important since inaccurate assessment can greatly affect the diagnostic ability of these molecules [
69]. Therefore, further development of the most efficient and reproducible method for quantitative and qualitative assessment of the obtained miRNA is required.
4. Methods for Studying the miRNA Expression Profile
There are several approaches to studying miRNA expression. It is possible to study the expression of one or several specific miRNAs or perform total genome-wide profiling of miRNAs. To date, the expression of specific types of miRNA in CSF is measured using real-time PCR [
69]. The most common method is specific reverse transcription with stem-loop primers and measurement of real-time PCR expression using a probe-based detection system, such as TaqMan [
38,
43,
58,
71,
72]. Another method for measuring miRNA expression is based on universal reverse transcription, followed by SYBR Green quantitative PCR with specific forward and reverse primers [
47,
60]. Digital PCR can also be used with the TaqMan chemical protocol to analyze the level of miRNA expression [
62,
73]. Digital PCR data were confirmed using next-generation sequencing analysis [
73]. The above technologies based on qRT-PCR are effective methods for determining the level of miRNA expression in samples with low RNA content, such as CSF and serum. Real-time PCR is also used as the main method for validating sequencing- and microarray-based analyses discussed below [
67,
74].
One of the first methods for simultaneous analysis of a large number of specific miRNAs was based on hybridization with microarrays. The advantage of miRNA microarrays lies in their low cost and in the possibility of simultaneous analysis of a large number of samples. The disadvantages of this method are the limited range of quantification, imperfect specificity for miRNAs that differ from each other by one nucleotide and the inability to perform an absolute quantification of the miRNA profile. Thus, the optimal field of application of microarray technology is considered to be in determination of the relative amounts of specific miRNAs between two different states [
67].
The NanoString nCounter multiplex system uses oligonucleotide tags for barcoding, followed by target detection by hybridization with color-coded probes. The system can quantify up to 800 different targets. The advantages of the NanoString nCounter system are the direct measurement of the expression levels of molecules without amplification and the ability to investigate the expression of formalin-fixed and paraffin-embedded samples [
75]. One of the main advantages of this method is the ability to discriminate miRNAs differing in one nucleotide with high accuracy. However, data analysis using the NanoString nCounter system is more expensive than using existing counterparts [
67,
76].
For total profiling of miRNA expression, next-generation RNA-seq sequencing technology is used. The initial stage is the preparation of a cDNA library from small RNAs of the test sample, followed by sequencing. Bioinformatic analysis of sequence reads identifies both known and new miRNAs within the sample and provides relative quantification. The main advantages of next-generation sequencing for miRNA profiling are the ability to identify new miRNAs and the precise differentiation of miRNAs that differ by one nucleotide [
77]. Limitations of next-generation sequencing can be the high cost and limited amount of “barcoding” cDNA, which does not allow for the loading of multiple samples in one run [
67]. Sorensen et al. (2017) concluded that the study of miRNA expression in CSF using RNA-seq is less sensitive when compared with qPCR. At the same time, Tigchelaar et al. (2019) confirmed the relationship between the severity of SCI and the level of miR-10b-5p expression in CSF using both NGS RNA-seq and qPCR [
19,
64].
Выбор метода изучения профиля и экспрессии микроРНК зависит от количества и качества выделенной РНК. Чипы для гибридизации, технологии на основе ПЦР в реальном времени, платформа nCounter и секвенирование нового поколения отличаются концентрацией и объемом образца микроРНК, необходимым для анализа, а также чувствительностью, специфичностью и стоимостью. В то время как все аспекты профилирования должны быть рассмотрены перед платформой [ 69 ], мы предполагаем, что использование технологии miRNA-Seq для обнаружения miRNAs и их последующей проверки с использованием qPCR может действовать как эффективный метод для установления надежных биомаркеров SCI и нейродегенеративных заболеваний.