Your browser does not fully support modern features. Please upgrade for a smoother experience.
Please note this is an old version of this entry, which may differ significantly from the current revision.
Subjects:
Agriculture, Dairy & Animal Science
Hydroxycinnamylated anthocyanins (or simply ‘acylated anthocyanins’) increase color stability in grape products, such as wine.
- coumaroylated anthocyanins
- QTL mapping
- rhAmpSeq
- fruit chemistry
1. Introduction
Anthocyanin pigments are widespread in the plant kingdom, including grapevines (Vitis spp.), where they contribute to the coloration of red/black grape berries and resulting products such as juices and wines [1]. Anthocyanins consist of a flavonoid aglycone (an anthocyanidin, e.g., malvidin) covalently linked to one or more sugars [2]. Anthocyanins may be further modified by the acylation of their sugar group(s) by one or more organic acid moieties. The dominant acylated forms in most V. vinifera cultivars are derivatives of hydroxycinnamic acids (e.g., anthocyanidin-3-O-ferulylglucosides, anthocyanidin-3-O-coumarylglucosides) [1]. These hydroxycinnamylated anthocyanins, referred to in this paper simply as ‘acylated anthocyanins’, are of interest because of their enhanced color stability relative to non-acylated anthocyanins in typical food or beverage matrices [3]. For example, as compared to non-acylated analogs, acylated anthocyanins show little change in their absorption profiles over the pH range 3–5 and are less susceptible to thermal hydrolysis [4], purportedly due to intramolecular stacking between the flavonoid and hydroxycinnamyl rings.
The proportion of anthocyanins that exist in acylated forms can vary widely among grape cultivars. For example, a survey of 50 Spanish V. vinifera cultivars reported that the acylated anthocyanin fraction (specifically, the coumarylated fraction) varied from 4.2% to 53.5% [5], and some black-fruited cultivars such as Pinot noir are reported to have no detectable acylated anthocyanins. Similar variation in the degree of acylation has been reported among wild Vitis accessions [6]. DNA markers predicting acylation could be of interest to breeders, e.g., to select for grapes with high proportions of acylated species to achieve greater color stability in grape-derived products or to select for lower acylation to increase anthocyanin bioavailability [7][8] and consequent health benefits [9][10][11].
The biosynthetic pathway of anthocyanins in grapes and other plants is well understood [2], and several markers associated with anthocyanin-related traits have been discovered through mapping studies. MYB transcription factors are critical for regulating total anthocyanin production [12]. Studies with transgenic grapes have demonstrated that VvMYBA is a positive regulator of the later stages of anthocyanin biosynthesis and modification, including the formation of acylated anthocyanins by an anthocyanin acyltransferase (VvAT) [13]. Moreover, work led by Massonnet et al. 2017 [14] identified that the expression of VvAT, as well as other anthocyanin biosynthesis-related genes, was unique to red grape cultivars. QTL analysis of a ‘Syrah’ × Pinot noir mapping population identified several minor QTLs for anthocyanin acylation, including two VvAT genes [15]. However, no further QTL mapping studies have associated VvAT with the presence/absence of acylated anthocyanins in Vitis.
2. Mapping Population Showed Presence/Absence Patterns for Anthocyanin Acylation
Total and acylated anthocyanins were quantified from a maximum of 112 and 155 vines in the V. rupestris B38 × ‘Horizon’ (sampled in 2012 and 2013, at late maturity) and ‘Horizon’ × Illinois 547-1 (sampled in 2011, 2012, and 2013, at late maturity; for the later, sampling at early maturation was also conducted) populations, respectively. The acylation ratio was computed as the ratio of acylated anthocyanins relative to the total anthocyanin concentration. Total anthocyanins and acylated anthocyanins were poorly correlated (R = 0.20, average across years and populations), as were total anthocyanins and acylation ratio (R = −0.25, average across years and populations). However, acylated anthocyanins and acylation ratio were strongly correlated (R = 0.75, average across years and populations). Total anthocyanins and acylated anthocyanins showed a skewed normal distribution, whereas the acylation ratio showed a bimodal distribution, more clearly defined in the V. rupestris B38 × ‘Horizon’ population (Figure 1A). Acylation ratio ranged from 0.1% to 12% in V. rupestris B38 × ‘Horizon’, and from 0.1% to 39% in ‘Horizon’ × Illinois 547-1. Based on the two sets of phenotypic data collected for the ‘Horizon’ × Illinois 547-1 population, no changes were observed for acylation ratio when comparing early vs. late (p = 0.98, t-test; Figure 1B); however, total anthocyanin content increased as expected (p = 3.74 × 10⁻⁹; Figure 1C). Pearson’s correlation among years was high (R > 0.93, p < 2.2 × 10⁻¹⁶) within each population (two years for the V. rupestris B38 × ‘Horizon’ population, and 3 years with 2 collection times for the ‘Horizon’ × Illinois 547-1 population; Figure 1D–F). Finally, broad-sense heritability estimates for acylation ratio were 0.95 and 0.84 for the V. rupestris B38 × ‘Horizon’ and ‘Horizon’ × Illinois 547-1 populations, respectively.
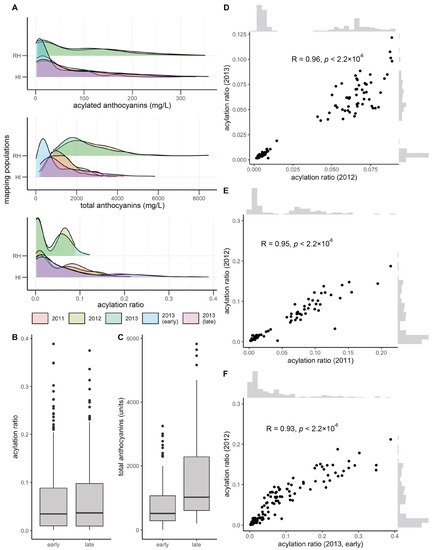
Figure 1. Overview of phenotypic variation. (A) Phenotypic variation observed for total anthocyanins, acylated anthocyanins, and acylated ratio (acylated anthocyanins/total anthocyanins). Variation in (B) acylation ratio and (C) total anthocyanins by harvest time (early vs. late) during 2013 for ‘Horizon’ × Illinois 547-1. Year-to-year Pearson’s correlation for (D) V. rupestris B38 × ‘Horizon’ and (E,F) ‘Horizon’ × Illinois 547-1 acylation ratios.
3. Stable QTL for Acylation Ratio across Genetic Backgrounds
Composite linkage maps for the V. rupestris B38 × ‘Horizon’ and ‘Horizon’ × Illinois 547-1 populations were constructed using rhAmpSeq markers. Of almost 2000 markers successfully amplified in both populations, about 55% were included in the final maps, and the rest were filtered out due to segregation distortion, monomorphism, or missing data. The V. rupestris B38 × ‘Horizon’ linkage map included 1092 markers and spanned 1206 cM, with an average gap of 1.16 cM (Table 1). The ‘Horizon’ × Illinois 547-1 linkage map showed similar metrics, including 1171 markers spanning 1182 cM and an average gap length of 1.01 cM. Overall, there was an excellent agreement between the reference genome (PN40024) [16] and the linkage maps of the two populations. Particularly, Spearman’s rank correlation between genetic and physical marker positions was >0.99 (on average across chromosomes) for both populations (Figure 2A).
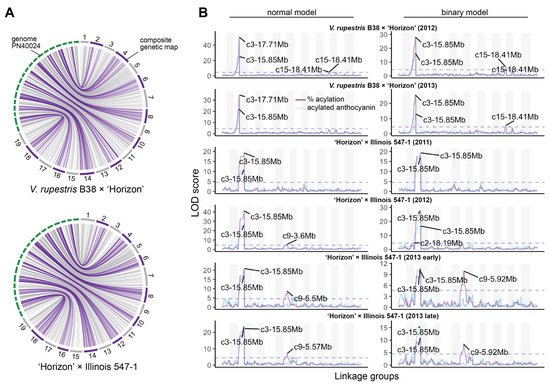
Figure 2. Linkage maps and QTL mapping of anthocyanin acylation. (A) Collinearity between physical (PN40024 reference genome) and composite genetic maps for the V. rupestris B38 × ‘Horizon’ and ‘Horizon’ × Illinois 547-1 populations. (B) Genetic mapping results for each population and evaluation year; QTL mapping was performed using both total acylated anthocyanins (blue line) as well as acylation ratio (purple line); additionally, normal and binary (high vs. low acylation ratio) models were compared for each population/year; dashed lines represent permutation-based significance thresholds.
Table 1. Features of the V. rupestris B38 × ‘Horizon’ and ‘Horizon’ × Illinois 547-1 sex-averaged linkage maps.
| Chr | V. rupestris B38 × ‘Horizon’ | ‘Horizon’ × Illinois 547-1 | ||||||||
|---|---|---|---|---|---|---|---|---|---|---|
| Markers | Size (cM) | Average Gap (cM) | Maximum Gap (cM) | Recomb. Rate (cM/Mb) | Markers | Size (cM) | Average Gap (cM) | Maximum Gap (cM) | Recomb. Rate (cM/Mb) | |
| 1 | 42 | 37.30 | 0.91 | 4.83 | 0.98 | 85 | 62.34 | 0.72 | 4.97 | 1.99 |
| 2 | 40 | 62.51 | 1.60 | 12.0 | 2.84 | 50 | 56.82 | 1.16 | 12.0 | 4.31 |
| 3 | 42 | 51.08 | 1.25 | 5.13 | 3.33 | 40 | 55.70 | 1.43 | 18.5 | 3.70 |
| 4 | 64 | 75.39 | 1.20 | 6.35 | 0.56 | 68 | 54.52 | 0.81 | 5.46 | 1.88 |
| 5 | 81 | 61.89 | 0.77 | 4.16 | 1.97 | 90 | 49.94 | 0.56 | 3.13 | 0.93 |
| 6 | 56 | 66.27 | 1.20 | 5.43 | 3.08 | 65 | 49.49 | 0.77 | 6.01 | 0.11 |
| 7 | 74 | 85.58 | 1.17 | 8.31 | 1.69 | 93 | 84.12 | 0.91 | 9.08 | 2.94 |
| 8 | 76 | 67.94 | 0.91 | 5.82 | 1.79 | 85 | 66.60 | 0.79 | 4.40 | 2.00 |
| 9 | 47 | 53.88 | 1.17 | 8.64 | 1.86 | 46 | 49.14 | 1.09 | 8.80 | 5.00 |
| 10 | 51 | 62.53 | 1.25 | 6.42 | 2.35 | 45 | 51.09 | 1.16 | 8.30 | 1.91 |
| 11 | 47 | 62.28 | 1.35 | 6.53 | 3.96 | 47 | 52.77 | 1.15 | 5.56 | 5.25 |
| 12 | 59 | 60.65 | 1.05 | 9.31 | 2.27 | 55 | 49.23 | 0.91 | 3.62 | 4.03 |
| 13 | 67 | 65.30 | 0.99 | 10.9 | 1.73 | 67 | 56.79 | 0.86 | 5.76 | 0.94 |
| 14 | 84 | 68.54 | 0.83 | 4.60 | 2.24 | 78 | 60.07 | 0.78 | 3.58 | 2.46 |
| 15 | 43 | 55.54 | 1.32 | 8.24 | 4.05 | 31 | 53.02 | 1.77 | 8.51 | 5.03 |
| 16 | 47 | 59.24 | 1.29 | 7.20 | 2.62 | 42 | 50.41 | 1.23 | 5.32 | 2.10 |
| 17 | 53 | 67.88 | 1.31 | 10.7 | 1.19 | 52 | 53.58 | 1.05 | 6.89 | 1.49 |
| 18 | 67 | 82.16 | 1.24 | 8.18 | 1.27 | 76 | 69.94 | 0.93 | 6.58 | 3.24 |
| 19 | 52 | 60.62 | 1.19 | 6.22 | 2.80 | 56 | 56.59 | 1.03 | 8.10 | 2.88 |
| Total | 1092 | 1206.58 | 1.16 | 7.31 | 2.24 | 1171 | 1082.16 | 1.01 | 7.08 | 2.75 |
QTL mapping was performed for each year × population data set using both binary (high vs. low acylation ratios) and continuous (quantitative) single-QTL models. For binary single-QTL models, acylation ratio variables were converted to binary traits (0′s and 1′s), according to the requirements of r/qtl, based on k-means clustering analysis. A large QTL on chromosome 3 (position 14.85–17.95 Mb, based on 1.5-LOD interval) was consistently identified across populations and evaluation years. A stronger signal was observed when using a normal model compared to a binary model (Figure 2B). Additionally, the use of acylation ratio as phenotype instead of the total acylated anthocyanins increased the LOD scores of the identified QTL at chromosome 3. On average, this QTL explained 68.97% and 47.25% of the phenotypic variation (acylation ratio) for the normal and binary single-QTL models, respectively. Significant marker-trait associations on chromosomes 9, 10, and 15 were also discovered; however, these were mostly population-specific (Figure 2B). Although LOD profiles for total acylated anthocyanins and acylation ratio were relatively similar, a QTL on chromosome 9 (position 5.5–5.92 Mb) was revealed only when using acylation ratio on the ‘Horizon’ × Illinois 547-1 population.
4. Candidate Genes
A large QTL on the arm of chromosome 3 was consistently found across different genetic backgrounds and years (Figure 2B). Several genetic markers in that region were highly associated with the percentage of acylation; therefore, a comprehensive analysis of the recombinants in the interval 14.85–17.95 Mb was carried out (Figure 3A). Within the region of interest, there were four markers at positions 14.85, 15.85, 17.71, and 17.95 Mb. These four markers cosegregated almost perfectly with the acylation ratio, except for a few cases (on average, ~3.1 individuals per population), where genotyping errors are a possible explanation. In both populations, high acylation ratios were associated with the ‘Horizon’ genotype.
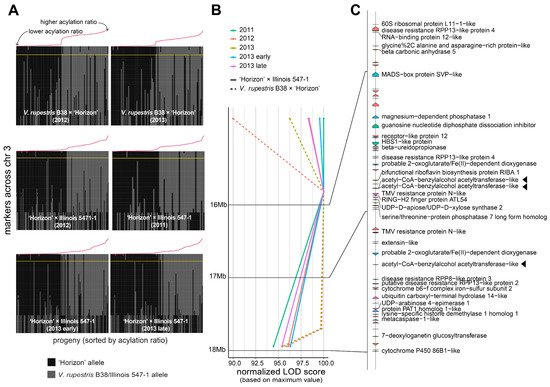
Figure 3. Analysis of the genomic region harboring marker-trait associations on chromosome 3. (A) Haplotypes on chromosome 3 for the V. rupestris B38 × ‘Horizon’ and ‘Horizon’ × Illinois 547-1 populations. Progenies on each panel are sorted decreasingly, right to left, based on acylation ratio, which is also indicated with a line plot in red color. The largest LOD score per panel is indicated by a horizontal yellow line. (B,C) LOD score profiles and gene content, respectively, in the 14.85–17.95 Mb interval for all populations and evaluation years. For visualization purposes, LOD scores were normalized to account for differences in the magnitude of the signal; gene labels are shown only for functionally annotated genes. Candidate genes are highlighted with a triangle.
The 14.85–17.95 Mb region on chromosome 3 of the 12X.v2 PN40024 V. vinifera reference genome was inspected on the URGI database (https://urgi.versailles.inra.fr/Species/Vitis/Annotations (accessed on 6 June 2021)) (Figure 3B,C). In total, there were 74 genes, of which 34 had a functional annotation. The genes LOC104878940, LOC100251354, and LOC104878920 (16831069-16831860b, 16834152-16835462b, and 17377464-17378981b, respectively), all encoding an acetyl-CoA-benzylalcohol acetyltransferase-like protein, were in close proximity to the significant markers at positions 15.85 and 17.71 Mb. This location had the largest LOD score across nearly all the evaluated conditions (i.e., genetic backgrounds, year of evaluation, and normal vs. binary QTL models; Figure 3B). Within the 14.85–17.95 Mb interval, version 4 of the PN40024 genome assembly (https://integrape.eu/resources/genes-genomes/genome-accessions/ (accessed on 26 November 2021)) lists not three but four genes encoding an acetyl-CoA-benzylalcohol acetyltransferase-like protein, which could be explored in further fine-mapping studies.
This entry is adapted from the peer-reviewed paper 10.3390/genes12121962
References
- Waterhouse, A.L.; Sacks, G.L.; Jeffery, D.W. Anthocyanins. In Understanding Wine Chemistry; Waterhouse, A.L., Sacks, G.L., Jeffery, D.W., Eds.; John Wiley & Sons, Ltd.: Chichester, UK, 2016; pp. 131–139. ISBN 9781118730720.
- Boss, P.K.; Davies, C. Molecular Biology of Anthocyanin Accumulation in Grape Berries. In Grapevine Molecular Physiology & Biotechnology; Roubelakis-Angelakis, K.A., Ed.; Springer: Dordrecht, The Netherlands, 2009; pp. 263–292. ISBN 9789048123056.
- He, F.; Liang, N.-N.; Mu, L.; Pan, Q.-H.; Wang, J.; Reeves, M.J.; Duan, C.-Q. Anthocyanins and Their Variation in Red Wines I. Monomeric Anthocyanins and Their Color Expression. Molecules 2012, 17, 1571–1601.
- Zhao, C.-L.; Yu, Y.-Q.; Chen, Z.-J.; Wen, G.-S.; Wei, F.-G.; Zheng, Q.; Wang, C.-D.; Xiao, X.-L. Stability-Increasing Effects of Anthocyanin Glycosyl Acylation. Food Chem. 2017, 214, 119–128.
- Pomar, F.; Novo, M.; Masa, A. Varietal Differences among the Anthocyanin Profiles of 50 Red Table Grape Cultivars Studied by High Performance Liquid Chromatography. J. Chromatogr. A 2005, 1094, 34–41.
- Liang, Z.; Yang, Y.; Cheng, L.; Zhong, G.-Y. Polyphenolic Composition and Content in the Ripe Berries of Wild Vitis Species. Food Chem. 2012, 132, 730–738.
- Charron, C.S.; Kurilich, A.C.; Clevidence, B.A.; Simon, P.W.; Harrison, D.J.; Britz, S.J.; Baer, D.J.; Novotny, J.A. Bioavailability of Anthocyanins from Purple Carrot Juice: Effects of Acylation and Plant Matrix. J. Agric. Food Chem. 2009, 57, 1226–1230.
- Kurilich, A.C.; Clevidence, B.A.; Britz, S.J.; Simon, P.W.; Novotny, J.A. Plasma and Urine Responses Are Lower for Acylated vs Nonacylated Anthocyanins from Raw and Cooked Purple Carrots. J. Agric. Food Chem. 2005, 53, 6537–6542.
- Alvarez-Suarez, J.M.; Giampieri, F.; Tulipani, S.; Casoli, T.; Di Stefano, G.; González-Paramás, A.M.; Santos-Buelga, C.; Busco, F.; Quiles, J.L.; Cordero, M.D.; et al. One-Month Strawberry-Rich Anthocyanin Supplementation Ameliorates Cardiovascular Risk, Oxidative Stress Markers and Platelet Activation in Humans. J. Nutr. Biochem. 2014, 25, 289–294.
- Li, S.; Wu, B.; Fu, W.; Reddivari, L. The Anti-Inflammatory Effects of Dietary Anthocyanins against Ulcerative Colitis. Int. J. Mol. Sci. 2019, 20, 2588.
- Morais, C.A.; de Rosso, V.V.; Estadella, D.; Pisani, L.P. Anthocyanins as Inflammatory Modulators and the Role of the Gut Microbiota. J. Nutr. Biochem. 2016, 33, 1–7.
- Fournier-Level, A.; Le Cunff, L.; Gomez, C.; Doligez, A.; Ageorges, A.; Roux, C.; Bertrand, Y.; Souquet, J.-M.; Cheynier, V.; This, P. Quantitative Genetic Bases of Anthocyanin Variation in Grape (Vitis Vinifera L. Ssp. Sativa) Berry: A Quantitative Trait Locus to Quantitative Trait Nucleotide Integrated Study. Genetics 2009, 183, 1127–1139.
- Rinaldo, A.R.; Cavallini, E.; Jia, Y.; Moss, S.M.A.; McDavid, D.A.J.; Hooper, L.C.; Robinson, S.P.; Tornielli, G.B.; Zenoni, S.; Ford, C.M.; et al. A Grapevine Anthocyanin Acyltransferase, Transcriptionally Regulated by VvMYBA, Can Produce Most Acylated Anthocyanins Present in Grape Skins. Plant Physiol. 2015, 169, 1897–1916.
- Massonnet, M.; Fasoli, M.; Tornielli, G.B.; Altieri, M.; Sandri, M.; Zuccolotto, P.; Paci, P.; Gardiman, M.; Zenoni, S.; Pezzotti, M. Ripening Transcriptomic Program in Red and White Grapevine Varieties Correlates with Berry Skin Anthocyanin Accumulation. Plant Physiol. 2017, 174, 2376–2396.
- Costantini, L.; Malacarne, G.; Lorenzi, S.; Troggio, M.; Mattivi, F.; Moser, C.; Grando, M.S. New Candidate Genes for the Fine Regulation of the Colour of Grapes. J. Exp. Bot. 2015, 66, 4427–4440.
- Canaguier, A.; Grimplet, J.; Di Gaspero, G.; Scalabrin, S.; Duchêne, E.; Choisne, N.; Mohellibi, N.; Guichard, C.; Rombauts, S.; Le Clainche, I.; et al. A New Version of the Grapevine Reference Genome Assembly (12X.v2) and of Its Annotation (VCost.v3). Genom. Data 2017, 14, 56–62.
This entry is offline, you can click here to edit this entry!