Your browser does not fully support modern features. Please upgrade for a smoother experience.
Please note this is an old version of this entry, which may differ significantly from the current revision.
Subjects:
Energy & Fuels
Deterministic safety analysis (DSA) is essential for nuclear power plant licensing. The conservative method followed CFR50 Appendix K, which will lead to a large margin. As one of the DSA methodologies, best estimate plus uncertainty (BEPU) generates more realistic results that can be used in the license application of nuclear power plants (NPPs). However, uncertainty evaluation of parameters is needed in BEPU.
- LBLOCA
- BEPU
- safety review calculation
1. Introduction
Compared with coal, gas, and other energy types, nuclear energy, as an important clean energy, has no air pollution, no carbon dioxide, high energy density, and stable power generation. It is also the only green energy source until now that can be continuously supplied in the form of a low ecological impact and low-carbon source and can be used stably on a large scale as with fossil fuel energy. According to the data of the world nuclear energy association, as of January 2021, global nuclear power generation has accounted for 10.1% of the total global power generation. The operation of nuclear power in the world shows that nuclear power is a safe and sustainability energy [1]. It is not only an effective way to reduce energy and environmental pollution, but also an effective means to reduce greenhouse gas emissions. With the development of fourth generation nuclear power technologies such as high temperature gas cooled reactor and molten salt reactor [2,3,4], the role of nuclear energy in sustainable development will be strengthened day by day. However, some rules ensuring the safety of nuclear power plants have to be meet by nuclear power companies in the process of applying for operating license. There is a balance between safety and economy. So, more and more new analysis methods have been studied for the purpose of cost. According to the IAEA safety guide, different approaches are currently available for performing deterministic safety analysis (DSA) with different levels of conservatism [5]. The conservative method should be performed with conservative code, system assumptions, and boundary conditions. However, this method was usually adopted in the early days of safety analysis to simplify the analysis and eliminate the limitations in modeling and knowledge of physical phenomena, resulting in large safety margins. BEPU is one of the approaches to perform safety analyses of nuclear power plants (NPPs) with a relatively realistic result, using realistic code, system assumptions, and boundary conditions, plus uncertainty analysis [5]. For the LOCA/ECCS analysis [6], the automated statistical treatment of uncertainty method (ASTRUM), one of the BEPU methods, has already been accepted by the regulatory authority and been used for AP1000 (one type of NPP design by a US company) NPP licensing.
APPWR is an advanced generation III pressurized water reactor, the safety concept of which is similar to AP1000, but the nuclear power is increased. In APPWR licensing application and safety review processing, ASTRUM is also used. To review the design, the reviewers pay attention to the effectiveness of the uncertainty analysis of the designer, re-execute the best estimate and uncertainty analysis on APPWR LBLOCA, and analyze the uncertainty of key parameters.
2. BEPU Methods
BEPU is an accident analysis method with realistic code, realistic system assumptions, and realistic boundary conditions, but propagation of uncertainty should be analyzed. This method is considered to gain a larger safety margin than the traditional conservative analysis method, so it is normally applied in some kinds of safety analysis, especially in LBLOCA analysis [7]. The pioneering BEPU methodology was code scaling, applicability, and uncertainty (CSAU) [8], sponsored by the USNRC, where the propagation of uncertainty to the results was performed using a surrogate model of the thermo-hydraulic code, namely a polynomial response surface. Around the turn of the century, a new type of propagation procedure gained acceptance, based on the original code and on the calculation of tolerance limits using nonparametric Wilks’ method [9,10]. A method called advanced statistical treatment of uncertainty method (ASTRUM) is one of the typical methodologies based on Wilks’ theory.
For ASTRUM and CSAU, the ranges of the uncertainty contributors remain unchanged. The main difference between them is the evaluation of final uncertainty. ASTRUM is based on the order statistic (OS) method to calculate the total uncertainty of figure of merit. In the order statistic method, the size of a matrix to combine total uncertainties is limited. The calculation uncertainty propagation from input to output was performed on the basis of simple random sample (SRS) [11]. The specified input parameters (uncertainty parameters) generate a set of random values (case results) for each case. The final product is an SRS of outputs, and specifically of the figure-of-merit. The peak cladding temperature (PCT) is the figure-of-merit for LBLOCA.
For license issues, the regulatory acceptance criteria should be met with a probability of at least 0.95 and a statistical confidence of at least 0.95. If the tolerance limit (with level 95/95) of PCT is lower than the regulatory criterion, the acceptance criterion is fulfilled with level 95/95.
According to Wilks’ theory, the required tolerance level α/β (α is the probability level and β is the confidence level) is related to the order of the OS and the random sample size, as shown in Equation (1) [12]:

where n is the sample size.
According to Equation (1), if the confidence and probability level remained at least 0.95, the minimum sample size should be 59. Sample size 59 is normally used such as it in reference [6], and the maximum (rank 1) value of figure-of-merit is the tolerance limit for this BEPU analysis.
3. APPWR BEPU Evaluation Model and EM Verification
3.1. APPWR Introduction
APPWR is the generation III pressurized water reactor technology developed by China. The initial rated reactor core thermal power for the APPWR certified design is 4040 megawatts, and electric power output is 1400 megawatts [15,16]. In order to minimize the linear heat rate, more fuel assemblies are loaded in the core. The passive ECCS contains two core makeup tanks (CMTs), two accumulators (ACCs), an in containment refueling water storage tank (IRWST) for long phase core cooling, and an automatic depressurization system (ADS) for automatic depressurization. As shown in Figure 1, the upper head of CMT is connected to one cold leg with the pressure balance line and the lower head is connected to the injection line. When the pressure of the main loop decreases below the default value, the CMT water can directly inject into the vessel through the direction vessel injection (DVI) line. The water in ACCs and IRWST will drain into the RCS by gravity through DVI too [17,18]. Different from the traditional design, the high-pressure safety injection system of this APPWR is removed to prevent the SGs from overflowing.
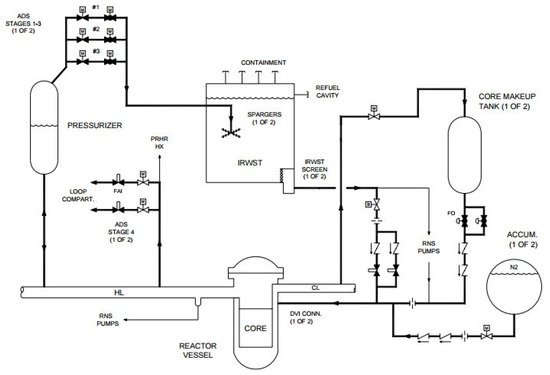
Figure 1. Schematic of ECCS.
3.2. Evaluation Models
According to the requirements of the Chinese government, the models in computer code used for nuclear safety evaluation should be verified in detail, and evaluation models must be able to describe the relevant physical processes during the reactor accident. For the LBLOCA of an APPWR, the following phenomena are in the spotlight: multidimensional two-phase flow, non-equilibrium thermodynamics, reflood, level tracking, etc.
TRACE code is a best-estimate reactor system code developed by NRC, which combines the advantages of four main systems codes, known as TRAC-P, TRAC-B, RELAP5, and RAMONA. Now, it has been transferred to the Chinese regulatory authority for the NPPs review calculation due to its distinguished performance on simulating LOCA. For instance, TRACE code can simulate several physical phenomena that are important in LBLOCA analysis for an APPWR, such as the ECC downcomer penetration and bypass, including the effects of countercurrent flow and hot walls, direct injection of subcooled ECC water without artificial mixing zones, etc. For this research, TRACE code is chosen as one of the thermal-hydraulic simulation tools.
The APPWR NPP has some special features such as the different levels of cold and hot legs inlet and outlet connections to the vessel. As a result, two vessel models are applied, as shown in Figure 2. The downcomer and lower head are simulated in Vessel 1, while the core and upper head are located in Vessel 2. The parameters of junctions between two vessels are set to suit the mass flow of downcomer bypass and other hydraulic phenomena.
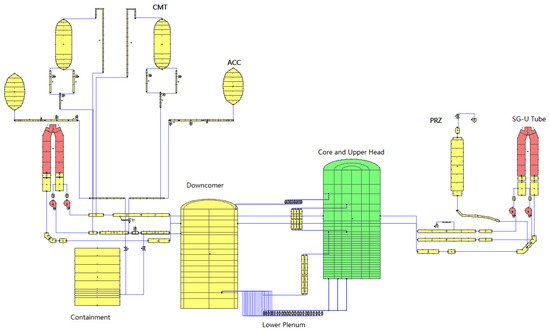
Figure 2. Nodalization model for APPWR first loop and safety injection system.
Vessel 1 is split into two radial parts and eight azimuthal parts. In this way, the model can simulate the distribution of inlet flow and injection flow in the core. Three radial cells and four azimuthal cells are contained in Vessel 2. The lower core plenum connects the downcomer, and the reactor core is simulated by 32 pipes.
The TRACE model contains two loops, four pumps, two SGs, and one ECCS. The ECCS is consist of two CMTs, two ACCs, one IRWST, and one heat exchanger. The containment for LBLOCA is considered in this case for the pressure situation of the break. The containment pipe is divided into 10 cells. Two break valves connect to the containment in cell No.3. The geometry of the cells nearby the break is smaller than the others to achieve easier convergence. The simulation model is shown in Figure 2.
3.3. Model Verification of BEPU
The basic case is used to verify the numerical model. Compared with the analysis result in the preliminary safety analysis report (PSAR), the basic case uses the same initial condition and trigger signal, but with different code for calculation. The design data from the vendor are used to make sure that the results from the BEPU analysis have the same trend and that the results can be explained.
The simulated mass flow rate in the main loop and reactor core match the design flow rate well. The power and pressure of the reactor coolant system (RCS) coincide exactly with the design data. The temperature and SG-out-dome pressure have much larger errors than the remainder, but the errors can be accepted for the analysis of the LBLOCA transient. It should be stated that the long-term phase of the transient is not included in the present analysis.
The basic case is executed by TRACE code, and the results are used to verify the numerical model. Since the NPP data belong to the company, it is not possible to publish the design parameters. As shown in Table 4 and Figure 3, the break occurs at 0 sec, and the pressure of the pressurizer (first loop) decreases sharply. According to the accident safety logic design, the containment high pressure or pressurizer low pressure signal will trigger the CMT isolation valve open; the RCPs then trip, and main feedwater is shut down with a delay of few seconds as the S signal occurs. The reactor scrams automatically, following the signal of PZR low pressure. At the beginning of the transient, CMT injection quickly starts, but the RCS depressurizes quickly so that the ACC set-point could be reached in a few seconds, and then the injection of CMT is cut off.
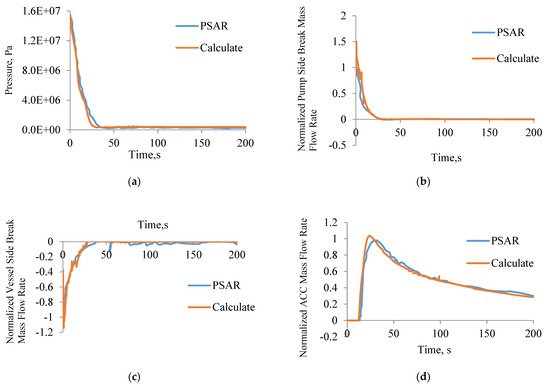
Figure 3. Basic comparison: (a) pressure of first loop; (b) mass flow rate of pump side break; (c) mass flow rate of vessel side break; (d) ACC mass flow rate.
The other reason for this is that the S-signal is triggered by containment high pressure when the condensation of coolant is not obvious. The CMT isolation valves and RCPs follow the S-signal, with a delay of several seconds.
Because the discharge mass flow is higher than the design value, the pressure decreases faster than the former. Safeguards signal (S) triggered by containment pressure is earlier than design data, as well as the activated time of ACC injection. Pressure and ACC mass flow rate are shown in Figure 3.
The comparison between the results obtained by TRACE and those by PSAR demonstrates that similar phenomena are leading the transient evolution in the basic case. It can be used as a base case in further safety analysis with the BEPU method.
However, mass flow rate through the break is higher than the design data. During the first 5 seconds, the pump side mass flow rate is much higher than the data from the PSAR. The broken model (including choked flow and discharge coefficients) is different.
This entry is adapted from the peer-reviewed paper 10.3390/su132414042
This entry is offline, you can click here to edit this entry!