Biomanufacturers are being incited by regulatory agencies to transition from a quality by testing framework, where they extensively test their product after their production, to more of a quality by design or even quality by control framework. This requires powerful analytical tools and sensors enabling measurements of key process variables and/or product quality attributes during production, preferably in an online manner. As such, the demand for monitoring technologies is rapidly growing. In this context, researchers believe surface plasmon resonance (SPR)-based biosensors can play a role in enabling the development of improved bioprocess monitoring and control strategies.
1. Introduction
Biomanufacturers are subject to strict directives imposed by regulatory agencies, such as the Food and Drug Administration (FDA) in the United States and the European Medicine Agency (EMA) in Europe, to ensure their products are fit to the highest standards of quality, efficacy, and safety. The biotherapeutic market of today is rapidly growing and evolving, with notable contributions attributed to the rise of therapeutic monoclonal antibodies
[1] and expiring patents allowing the creation of more and more biosimilars
[2].
Amid increasing demands, biomanufacturers aim to increase throughputs while retaining the quality and safety of their products. Products are typically extensively tested after production with fixed process parameters in what is commonly called a quality by testing framework. During the 2000s, the FDA introduced the concept of Quality by Design (QbD) to guide quality control
[3]. QbD aims to build quality within the product at the design stage rather than test it after its production. To accomplish that, the critical quality attributes (CQA) of a product must be identified to construct a quality target product profile (QTPP), which links CQAs to the critical process parameters (CPP). Such relations can be known a priori or investigated using concepts of design of experiments and a statistical analysis. Ensuring repeatability by aiming to maintain CQAs constant from batch to batch, rather than the process parameters, enables more process flexibility
[4][5]. Doing so requires a thorough understanding of which attributes of a biotherapeutic are critical to its efficacy and safety and of their dependency on the process variables. Risk assessment and continuous improvement are also key concepts of QbD
[6]. Knowing the link between CQAs and CPPs, quality by control (QbC) becomes possible by manipulating CPPs to regulate CQAs. QbC necessitates measuring various process variables during production that are either CQAs themselves or that allow the prediction of CQAs via predictive modeling techniques
[7][8].
Process analytical technology (PAT) is another initiative from the FDA from the middle of the 2000s
[9]. PAT encompasses the development of sensors allowing monitoring and process control methods taking advantage of the measurements provided by these sensors
[10]. Techniques and devices aiming to measure the critical process variables linked to CQAs in a timely manner compared to the process dynamics are very much a part of the PAT framework
[11]. As such, there is now a vast interest in techniques allowing process variable measurements online or at-line of the production vessel. Such tools enable the monitoring of bioprocesses either during upstream or downstream processing. Techniques that allow the monitoring of cell growth or cell metabolism may not be sufficient to perform QbC, introducing a need for sensors allowing measurements on the product itself. Such sensors would not only be useful for production at the industrial scale but also during process development, when multiple conditions need to be tested. More efficient process development leads to a lower time to market, which is highly beneficial. To this day, adoption of the PAT framework is much more prominent at the R&D stage than it is at the production stage, but we believe powerful new tools and ingenious data analysis methods could change that in the future.
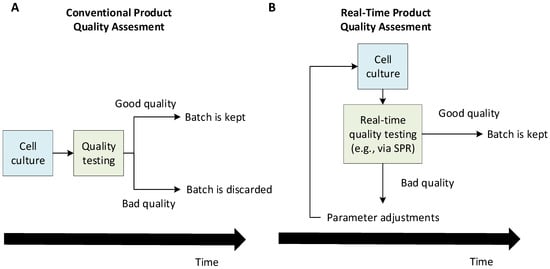
Figure 1 illustrates how real-time quality assessment tools can lead to a greater production efficiency by allowing decision-making during the production rather than a posteriori. Such process analytical technologies would enable the implementation of a quality by control framework in which production issues may be solved in real time by adjusting the production parameters. This would lead to a greater efficiency by ensuring more production batches are of acceptable quality. In this mindset, this review investigates the potential of surface plasmon resonance (SPR)-based biosensors as a monitoring tool that will allow real-time quality assessments and/or quantitation.
Figure 1. Conceptual differences between a conventional a posteriori quality assessment (A) and real-time quality assessment (B) of a cell culture-derived product. The conventional framework allows the detection of production issues only after the cell culture is finished, which may cause significant losses if a production batch is found to be inadequate and needs to be discarded. On the other hand, in a real-time quality assessment framework, a batch can be preemptively stopped if production problems start being detected during the cell culture. Eventually, a quality by control framework becomes possible, where one adjusts the production parameters to solve quality problems during the production. This can help discard fewer batches and, thus, greatly increase the efficiency.
2. Surface Plasmon Resonance: Basic Principles and Methods
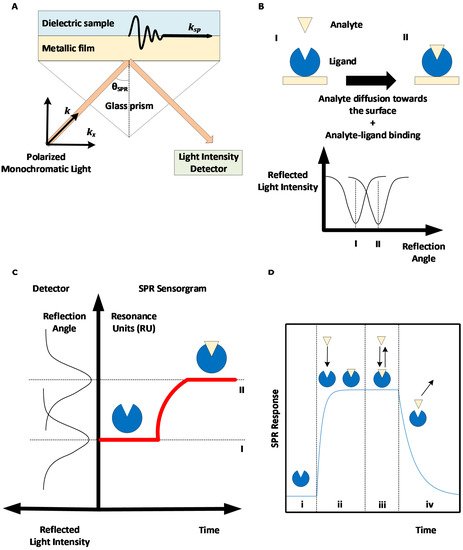
Surface plasmon resonance-based biosensors rely on the excitation of an electron cloud, called a plasmon, at the interface between a noble metal—typically gold—and a dielectric medium following the projection of a polarized monochromatic light on the metal. This results in the propagation of an evanescent wave. When the near-infrared incident light projected by a laser hits the metal surface such that the component of the incident wave light that is parallel to the surface (
kx) perfectly aligns with the surface plasmon waves (
ksp), the oscillations of the surface plasmon are amplified; hence, there is resonance. A glass prism is typically used to ensure the total internal reflection of the light (see
Figure 2A). This corresponds to the geometry suggested by Kretschmann and Raether
[12][13]. Therefore, when resonance occurs, energy that would otherwise be used in reflecting the light instead goes to amplifying the oscillations of the electrons, resulting in a drop in the reflected light intensity, which can be measured in real time. The light incident angle for which resonance occurs, called the SPR angle, depends on the refractive index of the dielectric media in the evanescent wave propagation zone. As the refractive index depends on the concentration of material near the surface, SPR can be used to track the accumulation of proteins at the surface in real time by rapidly changing the incident angle of the projected light and monitoring the changes in the SPR angle.
Figure 2. Surface plasmon resonance (SPR)-based biosensing principle. (A) Kretschmann-Raether biosensor configuration. Projecting near-infrared light at a specific angle (SPR angle) results in accrued oscillations of electron clouds (plasmon) at the interface between a dielectric sample and a metallic surface, hence the resonance of the surface plasmon. (B) Accumulation of materials (analyte molecules) on the metallic SPR surface creates a change in the SPR angle. (C) The change in the SPR angle can be monitored in real time to obtain a SPR sensorgram. (D) Phases of a SPR sensorgram: (i) baseline, (ii) association phase, (iii) equilibrium, and (iv) dissociation phase.
Some SPR biosensors vary the wavelength of the incident light and use a spectrophotometer as a detector. It is also possible to keep the angle and wavelength constant while monitoring the intensity shift. This technique facilitates measurements at multiple detection spots simultaneously using SPR imaging instruments (SPRi). However, configurations that directly measure the SPR angle or wavelength are preferred, as the intensity shift is only a derivative measurement of the SPR angle/wavelength, which are linked more directly to the quantity of accumulated material near the surface
[14]. Shifts in the phase of the light when SPR occurs can also be monitored. Such setups have not been broadly commercialized, as they require complex instrumentation, but they allow better sensitivity as the phase shift of the light is more abrupt than the variations of its intensity
[15][16] (see
Section 7). For more details on the SPR phenomenon and SPR biosensor configurations, the reader is referred to various reviews on SPR biosensing
[17][18][19][20][21][22][23][16]. A non-exhaustive list of SPR instrument manufacturers is given in
Table 1.
SPR biosensors allow real-time and label-free measurements of the interaction between a ligand immobilized on a biosensor metallic surface and an analyte introduced near the surface, for example, via a microfluidic channel. The biological interaction between the analyte and the ligand results in the accumulation of analytes near the biosensor, causing a change in the refractive index and SPR angle (see Figure 2B), which can be monitored to obtain a SPR sensorgram (see Figure 2C).
Ligand immobilization can be performed via multiple chemical approaches by using readily available SPR sensor chips with a tethered carboxymethylated dextran layer, as offered by Cytiva
[17]. Oriented strategies are preferred when available, as they minimize the heterogeneity in the ligand interaction and steric hindrance, resulting in sensorgrams that are simpler to analyze.
Following ligand immobilization, multiple SPR cycles can be performed on the same sensor surface. A SPR cycle, or sensorgram, can be separated into three main phases (
Figure 2D): first, a buffer injection phase (to obtain a baseline signal), an analyte injection phase during which analyte-ligand complexes are formed (association phase), and a second buffer injection phase to dissociate analyte-ligand complexes (dissociation phase). The association and dissociation durations, injection flow rate, and temperature can be set by the user for most high-grade SPR biosensors. The SPR signal is measured in RU (resonance units), with 1 RU being roughly equivalent to 1 pg/mm
2 of immobilized protein
[24].
Table 1. Surface plasmon resonance biosensor manufacturers. SPR instruments can either vary the angle of the incident light or its wavelength. Some manufacturers utilize variations on the traditional SPR technique to increase the throughput or to increase the applicability to complex samples.
| Manufacturer |
SPR Method |
Detection |
Reference |
| Affinité Instruments |
SPR |
Wavelength |
[25] |
| Biacore (Cytiva) |
SPR |
Angle |
[26] |
| Bionavis |
Multi Parametric SPR (MP-SPR) |
Angle |
[27] |
| Biosensing Instrument |
SPR |
Angle |
[28] |
| Carterra |
SPR Imaging (SPRi) |
Angle |
[29] |
| Reichert Technologies |
SPR |
Angle |
[30] |
| Sierra Sensors (Bruker) |
SPR Imaging (SPRi) |
Angle |
[31] |
To obtain repeatable signals, it is essential that the amount of available, biologically active ligand molecules remains constant from one sensorgram to the other. In order to ensure this, all analyte molecules should be removed from the surface by the end of the dissociation phase. For slowly dissociating systems, a regeneration step may be necessary during which a harder solution (typically in terms of pH or salt concentration) is injected. Selecting an appropriate regeneration solution may be challenging, as regeneration needs to remove all analyte molecules without removing or damaging the ligand molecules
[17][32][33].
SPR sensorgrams can be biased by nonspecific interactions between the analyte or other components of the injected sample and the SPR surface. Signal artefacts can also be observed (caused by sharp refractive index variations when switching from one buffer to another, by electric perturbations due to the biosensor’s moving parts, etc.). As such, a robust experimental protocol includes a second SPR surface (mock) to perform a reference. The mock surface is exposed to the same sequence of injections as the active surface, except that it does not harbor any ligand molecules. Thus, subtracting the signal recorded on the reference surface from the signal recorded on the active surface removes nonspecific contributions. A second reference may be performed by repeating the same sequence of injections with a null concentration of the analyte or a blank (i.e., injecting buffer instead of the analyte). This removes signal drifts, which can occur when the temperature near the SPR surface is not constant during the experiment, as the refractive index also depends on the temperature. Sensorgrams obtained by subtracting the reference surface signal and the referenced blank injection signal are said to be double-referenced
[34].
The following subsections will describe the two main uses of SPR: analyzing the kinetic and equilibrium behaviors of an analyte-ligand interaction and quantifying the solution of an analyte. Although the latter can perhaps seem more appropriate for bioprocess monitoring purposes, one should also strive to monitor the critical quality attributes (CQAs) of the product, which may influence the binding kinetics to its biological partners. As an example, monoclonal antibody (mAb)
N-glycosylation (a CQA of mAbs) is known to influence IgG-FcγR binding kinetics, as measured by SPR, and, hence, the efficacy and safety of therapeutic mAbs
[35].
3. SPR Applications to Biotherapeutics Production Monitoring
3.1. SPR for the Early Development of Biotherapeutics
As the first SPR-based biosensors became available in the early 1990s, they were used to characterize biomolecule interactions and rapidly played an instrumental role in accelerating therapeutic antibody screening and epitope binning experiments
[36]. In combination with technologies such as phage display, which enable the creation of large libraries of candidates based on bacteriophage expression, SPR helped identify candidates with the most therapeutic potential
[37][38]. These strategies led to the rise of one of the best-selling therapeutic monoclonal antibodies (mAbs), HUMIRA
®, commercialized in 2003, and continue to be an essential part in discovery research for new therapeutics against cancer or diseases like hepatitis, HIV, and Alzheimer’s
[36][39][40]. Kinetic analyses performed by SPR not only allow discriminating between good candidates based on their target specificity but, also, to better understand and estimate the target occupancy and residence time of the therapy
[41]. These parameters have become increasingly important in lead optimization in order to minimize off-target effects and ensure therapeutic efficacy by target engagement.
Several studies have described practical approaches based on SPR to study the off-target binding of candidates by serum proteins. This can significantly influence their pharmacokinetic profile and propensity to induce side effects. Frostell et al. showed early on that it is possible to efficiently evaluate the binding of plasma proteins to drug candidates by immobilizing plasma proteins on an SPR surface. Their results correlated with other methods such as ELISA
[42]. Gonzales et al. compared the immunogenicity of potential antibody variants against a protein, TAG-72, expressed by several kinds of carcinomas
[43]. Ritter et al. used SPR to measure the antibody response in the serum of patients that were treated with humanized anti-A33, an antibody that targets colon cancer
[44]. Today, therapeutic drug and immunogenicity monitoring (TDIM) is more and more implemented to guide therapy with biologics by taking into account personalized drug responses to make informed decisions on the course of treatment. Moreover, SPR was shown to be more cost-effective than ELISA for serum concentration analyses, as SPR protocols tend to be simpler and faster
[45]. Therefore, with the advantages of low sample volume consumption and real-time and label-free analysis, SPR has rapidly become recognized as a powerful tool and has been extensively used for the early assessment of target specificity, binding stability, and expression levels, which is essential data for the selection of potential drugs
[36].
As the market of biotherapeutics has grown over the years, the complexity of their path to commercialization pushed regulatory agencies and industrials to adapt the development workflow of drugs and add the evaluation of more developability aspects such as post-translational modifications, conformation, aggregation, solution stability, and pharmacokinetic properties upstream of the development to reduce the risk of failure downstream as much as possible
[36]. The role of SPR also evolved to meet those new requirements, and novel approaches were developed to rapidly characterize and predict a variety of biotherapeutic attributes. For example, antibody clearance can be partly estimated by its interactions with the neonatal Fc receptor FcRn. In fact, FcRn is responsible for recycling antibodies captured in endosomes by binding to their Fc region and leading them back to the cell surface
[46][47]. By studying the antibody-FcRn interactions with SPR, it is possible to identify characteristics or residues of the antibody that are favorable to recycling by FcRn and, thus, increase the antibody half-life
[48]. Until recently, SPR-based biosensors and their applications were limited by their low throughput. Recent advances have unlocked the full potential of SPR monitoring at every stage of biotherapeutics development and even during production and purification by increasing the throughput.
3.2. SPR for the Quantification of Biotherapeutics
Therapeutic monoclonal antibodies represent a rapidly growing global market in the biopharmaceutical field estimated to reach USD $300 billion by 2025
[1]. In a recently published study, two SPR assays were suggested to probe the total and bioactive mAb concentrations from a culture broth
[49]. Protein A/G was used as the ligand to detect the total concentration, whereas the mAb-specific antigen (here, green fluorescent protein (GFP)) was used to detect only the bioactive antibodies that are properly folded, such that they may play their biological role. Calibration was performed using samples of known concentrations. Various GFP immobilization strategies were compared, and a combination of His-tag capturing and amine coupling stood out for allowing the fast online quantitation of bioactive anti-GFP antibodies. His-tag capturing enables oriented immobilization, whereas amine coupling offers reusability of the sensor surface as the ligand molecules are covalently bound to the dextran layer of the sensor chip. A limit of detection of 1.8 ng/mL was achieved using the adapted immobilization method, which was shown to be similar to that of an ELISA procedure
[49].
SPR has also shown to be a capable alternative to ELISA in quantifying proteins in diluted serum samples. Frostell et al.
[50] developed SPR assays for the specific quantitation of eight plasma proteins (IgA, IgGs, albumin, and transferrin) and a recombinant mAb from samples taken during production in Chinese Hamster Ovary (CHO) cell cultures. Interestingly, these authors suggested not to perform any reference when conducting a concentration analysis, as they argue that an unmodified surface is not a representative negative control of the active surface when the latter contains large quantities of ligand molecules such as antibodies. They proposed to use a surface on which an irrelevant antibody is bound as a possible alternative but chose not to do so, as adequation to the active surface remained uncertain. The proposed SPR assays were shown to be robust, precise, and faster than an ELISA. In a notable recent study, Infliximab (IFX), a monoclonal antibody against TNF-α, and antibodies against IFX were quantified in human serum samples
[45]. In this study, calibration was performed by spiking the serum samples with known concentrations of analytes. Nonspecific contributions by serum proteins binding to the surface were referenced out by injecting the serum on a mock surface (for assays with TNF-α as the ligand to quantify IFX) or a surface harboring a set level of a nonspecific IgG (for assays with IFX as the ligand to quantify anti-IFX antibodies). The calibration and reference protocols used when treating complex media are particularly relevant to the field of bioprocess monitoring, and such studies show the potential of the SPR technique in treating complex matrices.
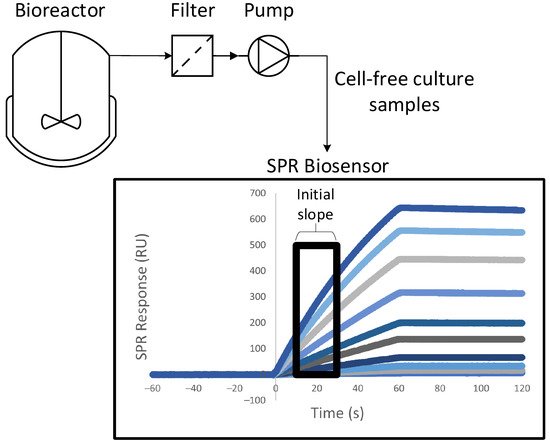
Harnessing a SPR biosensor to a bioreactor allowed at-line quantitation of the product during its production via cell culture
[51][52]. A system of peristaltic pumps enabled automatic sampling at a fixed time interval, with automated dilution of the cell media. The only purification steps between the biosensor and the 3.5-L bioreactor were a decantation column and a filter, which removed cells and cellular debris that could clog the SPR microfluidic channels. The whole process was fully automated.
Figure 3 shows a schematic of this experimental setup. The quantitation of anti-PSMA antibodies was performed by immobilizing PSMA (prostate-specific membrane antigen) on the sensor chip
[51]. The concentrations measured at-line were in agreement with the concentrations measured offline with SPR and with quantitative Western blotting followed by densitometry analyses. Calibration was automatically repeated every 12h using samples of known concentrations. More work needs to be done to render SPR biosensing more apt to the treatment of samples being automatically harvested, but these two studies showed an interesting proof of concept.
Figure 3. Schematic of the experimental setup suggested by Chavane et al.
[51] for an at-line concentration analysis via SPR.
3.3. SPR for the Safety and Quality Assessment of Biotherapeutics
Certain product safety probes can be performed with SPR. As an example, an SPR assay allowing the monitoring of complement activation by nanoparticles was recently detailed
[53]. Complement activation is undesirable in this context, as it causes an inflammatory reaction aimed at eliminating the nanoparticles when they are administered intravenously as therapeutic agents. Emulsion-based nanoparticles were incubated in human serum before performing SPR experiments. A total of four SPR surfaces were used. The first one displayed a polyclonal antibody against C3 fragments, while the second contained a monoclonal antibody specific to C3a. Complement activation was detected if either one of these surfaces exhibited a non-null SPR response when injecting the serum samples. The remaining two were reference surfaces: one unmodified and one with an irrelevant antibody. The SPR results were similar to those obtained via immunoelectrophoresis, whereas an ELISA approach resulted in high nonspecific background noise. Removing the nanoparticles prior to the experiment biased the detection of C3a, as it seemed to adsorb on the surface of the nanoparticles, potentially leading to false negatives. C3a could be adequately detected when samples containing the nanoparticles were tested
[53].
SPR has also been used to investigate post-translational modifications of proteins. Post-translational modifications may affect the efficacy and safety of biotherapeutics and can therefore be classified as critical quality attributes in a Quality by Design framework. Monoclonal antibody N-glycosylation has been studied abundantly with SPR, as it affects binding to immune system effector cells, by measuring the binding of differently glycosylated mAb samples either to Fc receptors
[35][54][55][56] or to lectins
[57]. In another study, phosphorylation (another post-translational modification) was investigated by immobilizing tumor suppressor P53 on a sensor surface. Kinases were then injected on the surface, causing P53 phosphorylation. As phosphorylation affects P53 binding to the murine double minute 2 (MDM2) protein, the injection of MDM2 enabled the probing of phosphorylation
[58].
Most of the current methods to probe the protein quality are ill-suited for online utilization. In contrast, a monitoring tool such as a SPR biosensor could allow the product quality to be considered in the very early stages of bioprocess development, such that it becomes an integral part of the control strategy.
3.4. Sequential SPR Assays
Sequential SPR assays enable both the quantitation of antibodies and the measure of their binding kinetics with Fc receptors in a single sensorgram. A large concentration of antigens is immobilized on the sensor surface. The assay starts with the injection of the antibodies, which bind to the immobilized antigens via their Fab region, enabling quantitation by measuring the slope of the recorded signal. This is followed by an injection of Fc receptors, which bind the antigen-bound antibodies via their Fc region. If the assay is well-calibrated, kinetic evaluation is possible with the recorded signal resulting from the Fc receptor injections. The sequence may be reversed if one aims to evaluate the antigen-binding kinetics. Such a sequential assay was used to quantify Trastuzumab in a culture supernatant by immobilizing Fcγ receptors and then measuring its kinetics to its antigen (HER2)
[59]. On the same note, biotinylated TNF-α was immobilized on a SPR surface, enabling the quantitation of an anti-TNF-α antibody. This was followed either by an injection of the TNF-α receptor to verify TNF-α blocking by the antibodies or by an injection of FcγR
[60]. In another study, antibodies from crude hybridoma were captured on the SPR surface via an anti-Fc antibody, allowing their quantitation and subsequent antigen-binding kinetic evaluation via a second injection
[61]. The first injection (quantitation) may be performed with species in a complex medium (cell lysate), whereas kinetic studies (second injection) are generally performed in a defined buffer for more accurate measurements. Sequential assays could prove a powerful tool for the introduction of SPR biosensors in bioprocess monitoring, as they alleviate the need for purification, multiple SPR surfaces, and regeneration steps by combining the quantitation and quality assessment probes.
4. SPR Applications to Vaccine Production Monitoring
4.1. SPR for Quantification of Vaccines Preparations
The most used model system is the influenza virus, which can be detected via hemagglutinin (HA), a homotrimeric glycoprotein found on the membrane of the virus. As such, an HA binding partner is used as the immobilized ligand. For the selection of an appropriate ligand, aiming to replicate the infection process of influenza is a sound strategy. Infection occurs when sialic receptors on HA bind terminal sialic acid residues on cell surface glycoproteins
[62][63]. Therefore, most research groups use sialic acids or conjugates containing a sialic acid moiety as the ligand. Lectins can also be used
[64], as HA exhibits carbohydrate sites on its surface. Note that such SPR assays will detect viral particles whether they are infectious or not, as long as they display HA
[65].
Influenza strains recognize sialic acid residues that are linked to galactose either in an α-2,3 (avian strain) or α-2,6 (human strain) conformation. Khurana and colleagues
[66] used synthetic glycans containing either of these conformations to quantitate different strains of influenza HA and HA contents of the vaccine preparations of several manufacturers, showing excellent agreement with the SRID methods. The biotinylated ligands were immobilized on a biosensor surface with grafted NeutrAvidin, and regeneration was possible. Doses ranging from 0.33 to 30 μg HA per mL were used for calibration purposes, and the initial slope of the signal was recorded. Biotinylated glycans were also used to study the kinetics and affinity of several influenza strains to multivalent glycans with either α-2,3 or α-2,6 linkage
[67]. The ability to measure interaction kinetics is absent in most other virus detection methods, including SRID.
A SPR assay based on a biantennary glycan with terminal α-2,6 sialic acid residues that strongly bind human influenza virus strain HAs from 1999 to 2017 was introduced by Bruce-Staskal and colleagues
[68]. An asialoglycan was immobilized on the reference surface. As their SPR assay emulates a biologically relevant binding event, the authors argued it can distinguish between native and denatured HA conformations. The total binding levels recorded with their assay were impacted by stresses (temperature and pH) applied to the sample. As such, the proposed SPR assay can indirectly measure degradation and/or unfolding and, hence, be used to assess the half-life and stability of a vaccine preparation
[68].
An inhibition assay was suggested to increase the sensitivity of SPR-based methods
[69]. An anti-HA antibody was added in excess to influenza vaccine preparations a sufficiently long time before the SPR experiment to allow the reaching of a steady state. At a steady state, the remaining free antibodies (which had not bound to any HA) were titrated with recombinant HA immobilized at the biosensor surface. One could correlate the recorded SPR signal to the solution concentration of viral particles
[14]. Of interest, a lower concentration of viral particles meant more free antibodies in the solution available for binding on the SPR surface and, thus, a higher SPR response. This allowed for a lower detection limit. A quantitation range of 1–15 μg/mL (via calibration with samples of known concentrations) was achieved for three influenza strains with a detection limit of less than 0.5 μg/L (respectively, 10–30 μg/mL and ~5 μg/mL for SRID, according to these authors)
[69]. A similar assay was suggested for the detection of adenoviruses
[70]. In that case, a detection range of 10–5000 PFU (plaque-forming units) per mL was achieved.
4.2. SPR for Quantification of Vaccines during Production
Mandenius and colleagues
[64] probed four compounds containing a sialic acid moiety and three lectins as potential ligands for continuous HA quantification by SPR. Continuous immunosensing requires a low-affinity ligand with a high dissociation rate, so that a regeneration step is unnecessary. A rapidly dissociating analyte also reaches equilibrium rapidly during the association phase. By continuously injecting pulses of the culture medium on the weak-affinity ligand surface, the concentration can be monitored online by monitoring the equilibrium plateau values, which are a function of the analyte concentration
[71]. The retained ligand was a 6′-sialyllactose conjugate with a substitution level of 0.6 mol of ligand per mole of carrier protein (ovalbumin). This ligand was shown to exhibit low affinity (~μM) binding to HA samples coming from egg or cell-based productions with a rapid dissociation (~s
−1), which would theoretically enable a fast analysis in an online fashion. The other tested ligands bound HA too strongly for this purpose, possibly due to avidity effects. A reference surface containing only ovalbumin was shown to adequately replicate nonspecific contributions. Human serum albumin was rejected as a protein carrier, as it caused more prominent nonspecific contributions than ovalbumin in this system. These authors showed that SPR responses at equilibrium correlated to the concentration measurements obtained with an SRID assay
[64].
Using different SPR surfaces to quantify different influenza strains is suboptimal, especially when analyzing multivalent vaccine preparation. As such, ligands bearing both α-2,3 and α-2,6 linkages, such as fetuin glycoproteins, are of particular interest. A fetuin-based SPR imaging (SPRi) assay was suggested, which offered a higher reproducibility and better quantitation range (0.03–20 μg/mL) than SRID
[65]. The assay was tested on influenza vaccine antigens and egg- and cell culture-derived whole influenza viruses. Of interest, viral particle production based on a culture of Madin-Darby Canine Kidney cells (MDCK) was monitored at-line from 1 to 4 days post-infection. Only a 10-min clarification by slow centrifugation was performed between the culture vessel (T-175 flask) and the biosensor. Of interest, multiple culture media caused negligeable nonspecific binding when injected alone on the biosensing surface, which paved the way to the at-line monitoring of multiple cell lines. Amongst them, the EMEM medium was selected, as it is appropriate for MDCK cells. Truncated fetuin (without terminal sialic acids) was observed to be a more reliable control surface ligand than bovine serum albumin, as it exhibited a lower nonspecific binding to HA. For antigen quantitation, calibrations were performed on HA samples of known concentrations, and the initial binding rates were recorded. For viral particle quantitation, either an infectivity assay (PFU) or total particles counting (TRPS) were used as a surrogate assay for concentration determination. The SPR signal initial slope strongly correlated linearly to both measurements. However, plaque-forming units only depend on infectious particles, not total particles exhibiting HA, as does SPR. Infectious viral particles cannot be directly quantified using SPR
[65]. The ability to monitor vaccine production at-line is certainly desirable. On top of that, SPR can efficiently supplement SRID even in an offline framework by providing rapid measurements that can help speed development and testing.
This entry is adapted from the peer-reviewed paper 10.3390/pr9111996