Your browser does not fully support modern features. Please upgrade for a smoother experience.
Please note this is an old version of this entry, which may differ significantly from the current revision.
Subjects:
Archaeology
Quantified components of the global food system are used to assess long-term global food security under a series of socio-economic, epidemic normalization and climate change scenarios.
- COVID-19 pandemic
- global food security
- GFV model
- food vulnerability
1. Introduction
Food security has been a pressing challenge for human society for a long time. The stability and security of the food system depend on the survival and sustainable development of human beings. Extreme events such as natural disasters, insect pests, diseases, and trade frictions have had serious impacts on the food system. Unfortunately, in 2020, the COVID-19 pandemic and unprecedented desert locust outbreaks in Eastern Africa obscured economic prospects in ways no one could have anticipated. This dire situation can worsen if we do not act urgently and take necessary actions [1,2,3].
The increase in extreme events has made the international market more complex, which threatens global food security. The whole world is committed to solving a common problem: how can the stability and sustainability of the global food system be ensured while extreme events happen frequently around the world? Global poverty has prevented rapid and sustainable development of the world for a long time. Since the beginning of the 21st century, societies have paid more attention to the security of their food systems. Specifically, in recent years, governments and global development communities have attempted to understand the impact of agricultural and food systems on their food security. Due to the impact of COVID-19 on food security and nutrition, the United Nations (UN) adjusted the UN sustainable development target in May 2020. Before the outbreak of COVID-19, the pace of global emission reduction was slowing down. It is estimated that the global goal of poverty eradication will not be achieved by 2030. The COVID-19 epidemic has caused tens of millions of people to fall back into extreme poverty that will last for many years. Despite the emphasis on the need to boost social protection, and emergency preparedness and response during the outbreak, the existing measures are not sufficient to protect poor and vulnerable groups. Since the establishment of the food tank, there have been remarkable efforts to reduce food waste, eliminate poverty, and increase farmers’ incomes. However, their influence on global people’s awareness of food security is still limited from a global perspective.
More cooperation is needed to eradicate global poverty and hunger, and improve the security of food systems. The food system security problem has existed for a long time [4,5,6,7,8]. Enhancing the efficiency and productivity of food systems and reducing food waste in different regions have been studied by many scholars during the past 50 years. They have also evaluated food supply patterns at the micro, meso and macro scales [8,9,10,11,12]. Fujimori et al. (2020) [13] proposed that food security includes four key components namely, food availability, stability, access, and utilization. Lu et al. (2020) [14] suggested a new self-adapting statistics allocation model (SASAM) to develop a global map of cropland distribution. Their analyses indicate that it is important to create more accurate global cropland maps for research and application in food security. Carney et al. (2020) [15] found that climate change and the continued neoliberalization of food systems have aggravated food insecurity and hunger, causing an ever-expanding population of displaced persons who are also nutritionally vulnerable. Anderson et al. (2019) [8] found that natural disasters such as El Niño Southern Oscillation (ENSO), the Indian Ocean Dipole (IOD), Tropical Atlantic Variability (TAV), and North Atlantic Oscillation (NAO) can change the global corn, soybean, and wheat production by 18%, 7% and 6%, respectively. Bentham et al. (2020) [9] identified multi-dimensional food supply patterns by analyzing 18 food groups in 171 countries from 1961 to 2019. Kinnunen et al. (2020) [16] calculated the minimum distance between food production and consumption for six crops in the world. Their results show that most parts of the world rely on trade to feed themselves. It is evident that global food trade is essential to maintaining the stability of the global food system. However, increased extreme events may cause trade frictions, which can seriously damage the stability of the global food system. Global food insecurity has led to large-scale human displacements and migrations [17,18,19]. Using an adapted ecological model of health behavior, Naja et al. (2020) [20] presented a framework to maintain optimal nutrition at the individual, community, national and global levels in order to enhance the physical and mental health of individuals during COVID-19. Falkendal et al. (2021) [21] conducted a study on grain export restrictions during COVID-19 and found that many low- and middle-income countries have food insecurity risks, which indicates that the decline in local production has a moderate impact on global prices and supplies, and trade restrictions and preventive procurement may lead to global food price increases and severe local food shortages [21].
Proper assessment of food security is of great assistance to planners and administrators [22,23,24]. Many studies have constructed evaluation indexes for food security at various scales and from different perspectives [24,25,26,27,28]. At the global scale, the Global Food Security Index (GFSI) provides a common framework for understanding the root causes of food insecurity by looking at the dynamics of food systems around the world, which is produced by The Economist Intelligence Unit and supported by Corteva Agriscience [25]. Grebmer et al. [26] used the Global Hunger Index (GHI) to measure changes in the number of hungry people in different regions of the world. A limitation of GHI is the upward bias it induces due to the use of proxy indicators involving undernutrition and under-five mortality [27]. At the national scale, Lv et al. [28] built a food security index (FSI) based on the coupling of grain yield, population, and GDP to evaluate dynamic spatiotemporal changes in China’s food security. There are regional differences in food output, economic development, and population size, among other aspects in the world. Scale differences and spatial heterogeneity in food security and its influencing factors are existed.
2. Analysis of the Changes in Global Grain Subsystems
2.1. Sustainably Increasing Global Grain Productivity in GFA
Grain productivity is an important factor affecting the regional grain self-sufficiency rate. Therefore, it is important to improve grain productivity in order to ensure regional food security. A comprehensive index of global grain production is calculated in GFA to analyze the spatial and temporal patterns of the per capita grain production in different regions of the world. Thereafter, the computed global per capita grain production index was divided into five levels by using the natural discontinuity method (Figure 1). The global arable land area increased from 9.8% to 11.1% from 1961 to 2019. However, the per capita arable land area in all regions of the world showed a linear declining trend, leading to a reduction (from 0.36 ha to 0.19 ha) in the global per capita arable land area. With technological progress, the average global grain yield per unit area increased significantly from 1431 kg/ha in 1961 to 4074 kg/ha in 2019. From 1961 to 2019, the per capita food production of Australia, the United States, and Canada was far ahead of that of other countries. From 1961 to 2019, the global per capita grain production showed an upward trend, the per capita grain production in North America, Oceania and Europe increased rapidly, and the production of grain per capita relatively accelerated in Eastern Europe after 2000. However, the per capita grain production in South Africa showed a significant downward trend during 1961–2019.
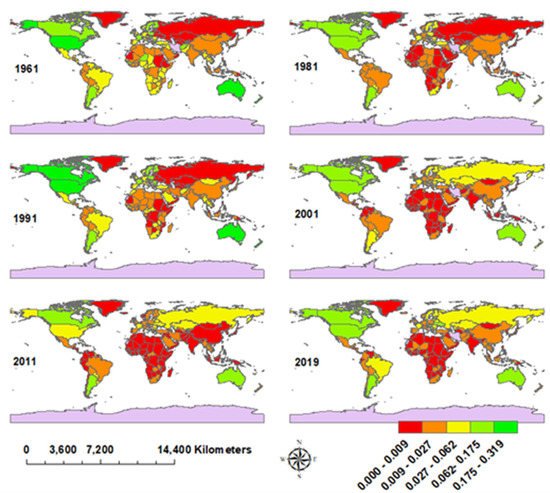
Figure 1. Changes in global arable land productivity by the GFA in 1961–2019. The redder color shows the lower the per capita food production capacity. The greener color denotes the higher the per capita food production capacity (a safer food system).
2.2. Global Food Access Patterns and Changes over Time in GFE
The annual per capita grain import to Africa, South America, and Europe (Asia, North America and Oceania) was higher (lower) than the global average of 45 kg/per capita/year. On the other hand, the annual per capita grain export from North America, Europe, Oceania, and South America (Asia and Africa) was greater (smaller) than the global average of 46.49 kg/per capita/year.
Figure 2 shows that the net food import per capita in Oceania and North America are negative, while the net food imports per capita in Africa and Asia are positive. The per capita net import value of grain in Europe and South America has changed from positive to negative since 1990, indicating that their per capita food self-sufficiency has gradually improved and their per capita net food imports have gradually decreased. The per capita food access increased in North and West Europe from 1961 to 1990. In Southern Europe, the food access per capita from 1990 to 2019 was increasingly dependent on imports, which was mainly reflected in the increasing net food import. From 1961 to 2019, From 1961 to 2019, the overall change of per capita food access in Central Asia, South Asia, and Southeast Asia were relatively stable, mainly showing that the per capita net import remains stable and at a low level for a long time. However, the per capita food access in West Asia was mainly affected by the increase in food imports. the per capita grain import in Central Asia has been negative since 1990. In the Americas, the per capita food self-sufficiency of North America is sufficient, and the per capita net food import is negative, while the per capita net food import of Central America and the Caribbean is positive, and the per capita net food import of South America has been negative since 1990, indicating that the per capita food self-sufficiency of South America has gradually improved in the last 30 years. In Oceania, the per capita food self-sufficiency is sufficient, so the per capita net food import is negative, exporting a lot of food to other countries. The per capita food availability in Africa depended on food imports during 1961–2019. The net per capita food import in North Africa enhanced from 0.057 to 0.164, which put the food system in jeopardy. The net import per capita of South Africa has changed from negative to positive since 1990 and showed a significant increasing trend.
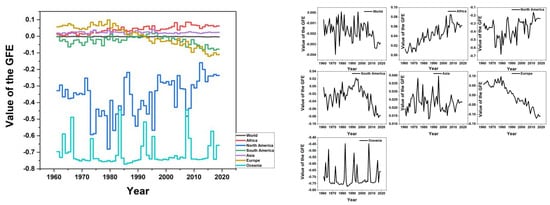
Figure 2. Changes in global net import per capita by the GFE during 1961–2019. Net import per capita = import per capita − export per capita.
2.3. Implications of Global Total Reserves for Food Stability
Total reserves (e.g., gold and US dollars) allow purchasing of emergency food when an extreme food crisis occurs in a certain area (total reserves can be converted into food purchasing power to make up for the lack of local food production). Cash savings in all countries have shown an upward trend, which has accelerated significantly since 2000. The cash savings in each of the study regions showed an upward trend from 1961 to 2019 (Figure 3). After 2000, the cash savings in all the regions grew significantly due to the rapid economic development in the 21st century. As can be seen in Figure 3, the cash savings were higher in East Asia and the Pacific, followed by Europe and Central Asia, Latin America and the Caribbean, South Asia, North America, and Central Asia, Middle East, North Africa, and sub-Saharan Africa in the last 20 years. The imbalance of regional development is mainly because of their different cash savings. In fact, promoting the balanced development of global regions is of vital importance to maintaining the stability and security of the global food system.
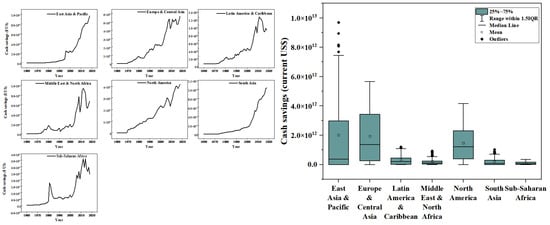
Figure 3. Cash savings (in US dollars) during 1961–2019.
From 1961 to 2001, the cash savings per capita of most countries were less than USD 1248 (Figure 4). After 2000, the cash savings per capita increased significantly and reached even more than USD 10,000 in some countries. In 1961, cash savings per capita of nine countries (namely, Switzerland, Kuwait, Malta, Belgium, Netherlands, New Zealand, Ireland, Canada, and the United States) exceeded USD 100, while in 2019, there were 16 countries (including Switzerland, Hong Kong Special Administrative Region (SAR) of China, Singapore, Macao SAR of China, Iceland, Saudi Arabia, Czech Republic, Qatar, San Marino, Israel, Norway, Libya, Denmark, United Arab Emirates, Japan, and Kuwait) with cash savings per capita of more than USD 10,000.
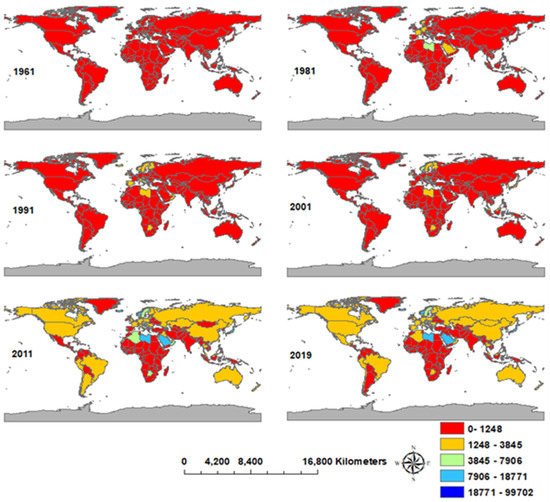
Figure 4. Changes in the global cash savings per capita in 1961–2019.
Except for sub-Saharan regions, global savings account for approximately 30% of total income. The ratio of savings to income in South Asia showed a significant upward trend and increased from 10% to 33% during 1961–2019. In Europe and Central Asia, the percentage of total savings reduced from 31% in 1961 to 19% in 1992, while it showed a fluctuating rising trend during 1992–2019.
3. Sustainably Increasing Global Per Capita Food Supply
To build a global food security system, it is imperative to understand the characteristics of grain supply capacity in different regions of the world. Hence, we analyzed the temporal and spatial characteristics of the total and per capita food supplies of all countries.
The global grain and food supplies showed steady growth during 1961–2019 and reached 8.03 × 10⁸ in 1961 and 2.88 × 10⁹ tons in 2019, respectively. In these years, the patterns of grain supply and demand per capita were unbalanced. Asia has the largest grain supply (with a maximum of 1.55 × 10⁹ tons per year), accounting for more than half of the world’s grain supply. North America, Africa, and Europe were ranked second, third, and fourth having an annual grain supply of 4.23 × 10⁸, 2.72 × 10⁸, and 4.12 × 10⁸, respectively. The food supply in South America ranged from 3.20 × 10⁷ to 1.57 × 10⁸ tons during 1961–2019. Oceania had the lowest food supply with an annual value of fewer than 1.8 × 10⁷ tons. After 2012, the rate of the food supply in Asia increased. Approximately 50% of the global food supply was from Asia in 2019. The growth rate of the food supply in Europe was rapid during 1961–1990, reaching a peak of 4.90 × 10⁸ tons in 1900. Over 1990–2000, the food supply in Europe showed a sharp decline. From 2001 to 2019, the food supply in Europe fluctuated by approximately 350 × 108 tons. We should ensure that the food supply will increase steadily in Asia, Africa, and America. In addition, we need to gradually restore the food supply capacity of Europe, continuously improve the grain supply capacity of Oceania, and maintain the stability and development of the global food system to the maximum extent.
As shown in Figure 5, the global food supply per capita shows some distinct variations in different periods. It showed a rapid increase over 1961–1980 and 2000–2019. From 1980 to 2000, the global food supply per capita showed a slow decline. After 2000, the food supply per capita in Oceania showed a fluctuating downward trend. Figure 5 shows that the annual per capita food supply in North America, Europe, and Oceania (Africa, South America, and Asia) was higher (lower) than the global mean. From 1978 to 2019, the total grain supply of the United States, China, India, and Brazil ranked first in the world. However, in 2019, North America had the highest food supply of 1177 kg/capita, followed by Europe and Oceania with a food supply of 559 kg and 517 kg/capita, respectively. Although the total grain supply in Asia ranked at the top of the grain supply quantity, its annual food supply was only 335 kg/capita, which is approximately one-third of that of developed countries in North America. In 2019, the per capita food supply in Africa was 245 kg, which was smaller than the global average of 398.9 kg (Figure 5). By increasing the per capita food supply in Asia, Africa, and other regions, the imbalance of global food supply will be mitigated, and global hunger will be diminished.
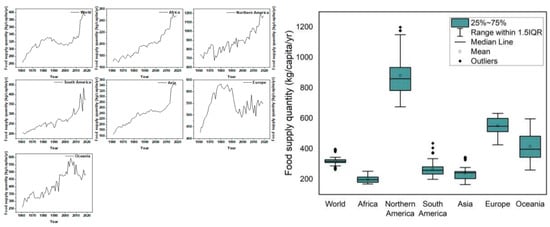
Figure 5. Global food supply per capita in 1961–2019.
Figure 6 shows that the annual per capita grain supply of all countries has increased and the imbalance in the global food supply has become more prominent. From 1961 to 2019, the per capita food supply of the United States ranked first in the world, 3–5 times that of African countries. Dissolution of the Soviet Union had a certain impact on Russia’s per capita food supply. After 1991, Russia’s per capita food supply was lower than the previous level. After 2010, the regions with an annual per capita food supply of less than 260 kg are mainly concentrated in Africa and South Asia. The per capita food supply in the top 10 countries (namely, Denmark, the United States, Canada, Ireland, Netherlands, Cambodia, and Hungary, etc.) was more than 504 kg/per capita/year in 1961, but it increased to more than 713 kg/per capita/year in 2019. The bottom 25 countries in terms of the food supply (mainly including Jamaica, Maldives, Polynesia, Ecuador, Colombia, Liberia, Grenada, Angola, Mozambique, Dominica, Gabon, Solomon Islands, Congo, Fiji, Samoa Central African Republic, and Mozambique) had an annual per capita food supply of less than 100 kg/per capita/year in 1961 and 150 kg/per capita/year in 2019.
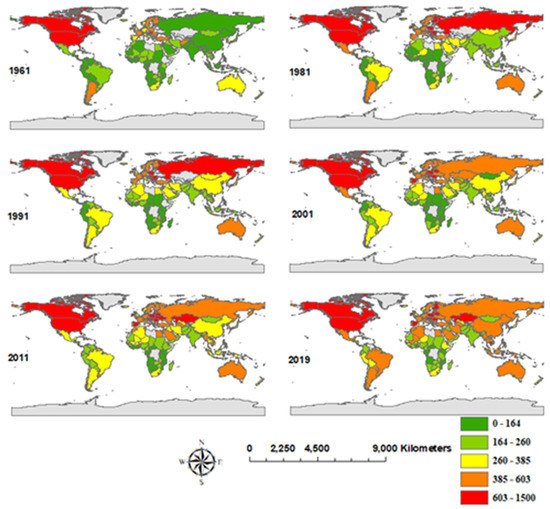
Figure 6. Global food supply per capita in 1961–2019.
4. The Impact of Global Food Losses on Food Security
To improve global food security, it is necessary to reduce food losses in global food production, transportation, storage, and consumption. Two indicators are used to study the characteristics of global food loss. The first one is the total food loss, and the second one is the per capita food loss in different countries.
The total global food loss showed a gradually increasing trend from 1961 to 2019, while the global annual per capita food loss showed an increasing, a decreasing, and again an increasing trend over 1961–1990, 1991–2005, and 2006–2019, respectively. During 1961–2019, the total food loss in Africa showed a steady rising trend, while the annual per capita food loss showed a fluctuating downward and then an upward trend. The total grain loss per capita in North America has shown a significant increasing trend since 2014. In 2019, its value in North America was about 5.4 times more than that of Europe. The annual per capita food loss in South America initially enhanced but then reduced over 1961–2019. The annual per capita grain loss in South America showed an increasing trend and reached a maximum value of 32 kg/per capita/year in 2011. Thereafter, it exhibited a downward trend. In Asia, the annual per capita food loss grew during 1961–1995 and 2005–2019, while it reduced over 1995–2005. From 1961 to 1990, the annual per capita food loss in Europe indicated a fluctuating growing trend. After 1990, it showed a sharp descending trend. The total grain loss in Oceania displayed a fluctuating rising trend over 1961–2019. Figure 7 shows that the annual per capita food loss in Europe, South America, Africa, and Asia (Oceania and North America) was higher (lower) than the global mean.
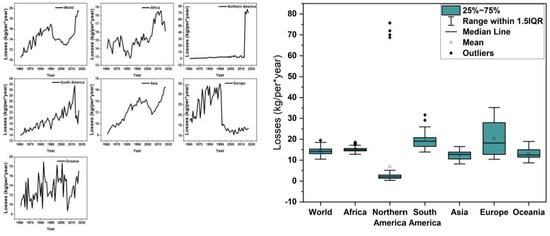
Figure 7. Annual global food loss per capita, 1961–2019.
During 1961–2019, the per capita food loss in South America and Europe was the highest in the world. After the dissolution of the former Soviet Union, the per capita food loss in Russia was lower than that in the former Soviet Union. The United States, Russia, China, and India were the countries with the largest food loss in the world. Before 1991, the per capita food loss of the former Soviet Union, Malawi, and Denmark were relatively high. After 2000, the per capita food loss in Argentina, Brazil, and Paraguay elevated. In 1961, 8 countries lost more than 30 kg/per capita/of food. In 2019, there were 28 countries whose per capita food loss exceeded 30 kg. Among them, the annual per capita food loss of Cambodia was as high as 101 kg (Figure 8).
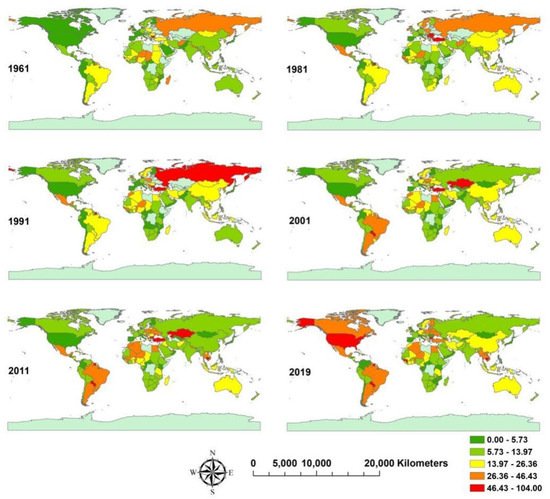
Figure 8. Annual per capita food loss of countries in the world from 1961 to 2019.
5. Security Assessment and Vulnerability Map of the Global Food System
Generally, although agricultural production technology and output are improving, the population is also increasing. In particular, we are increasingly dependent on international trade, which makes us appear insufficient in terms of food security when encountering extreme events. According to the above analysis of factors affecting food security and equation (1), the comprehensive pattern map of the global food system vulnerability was generated. The results of this study are consistent with the results of the Economist Intelligence Unit’s (Global Food Security Index 2019) [25]. Shown as Figure 9, the vulnerability (food insecurity) index of the food system in Africa and South Asia gradually increased from 1961 to 2019, especially in Sudan, Botswana, Algeria, etc. Over the same period, the vulnerability of the global food security system in South America, northern Europe and East Asia is gradually decreasing, including Argentina, Finland, Sweden, China, etc. Additionally, the highest food security level was in the United States, Canada and Australia. From 1961 to 1991, the vulnerability of the food system in the former Soviet Union was decreasing until the dissolution of the former Soviet Union. After the dissolution of the former Soviet Union, the security level of Russian Federation’s food system has been gradually improving.
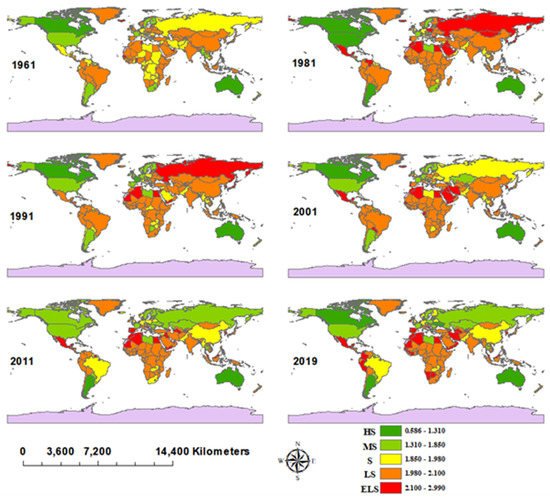
Figure 9. Comprehensive pattern of global food system vulnerability from 1961 to 2019.
From 2000 to 2019, the incidence of the prevalence of undernourishment in North America was only 2.5% of the total population, while the incidence of the prevalence of undernourishment in Africa and South Asia was as high as 25%. In different time periods, although the most vulnerable countries are slightly different, their distribution regions have not changed much. In 1961, the food system was relatively fragile in the United Arab Emirates, Israel, French Polynesia, St. Kitts, and Nevis, Djibouti, Albania, New Caledonia, Antigua and Barbuda, Bahamas, and Barbados. In 2019, these countries are the top ranked countries in terms of food vulnerability, including Djibouti, the Netherlands, Cyprus, Belgium, Tunisia, Portugal, Ireland, Jordan, Algeria, Morocco, and Israel. In the harmonious development of the world, food security can be guaranteed, but extreme events indicate that hunger incidents may occur at any time in some regions, such as the food crisis in Venezuela in 2019. The multiple emergencies in 2020 necessitate more research on the impact of extreme events on food security. We must take some measures to ease our over-reliance on trade, such as “residents reserve short-term daily food for themselves”, and promote local production of food as far as possible to ensure self-sufficiency.
This entry is adapted from the peer-reviewed paper 10.3390/su132414005
This entry is offline, you can click here to edit this entry!