Your browser does not fully support modern features. Please upgrade for a smoother experience.
Please note this is an old version of this entry, which may differ significantly from the current revision.
Subjects:
Health Care Sciences & Services
The switch from hip-placed to wrist-worn accelerometers has signaled the focus on developing novel approaches to process raw acceleration data without overly relying on traditional cut points. Indeed, wrist-worn raw acceleration data have been increasingly utilized to capture individuals’ physical behavior patterns. Several traditional methods and cut points have been developed to deal with raw wrist acceleration data, yet they appear to either overestimate or underestimate the outcomes.
- cut points
- GGIR
- motion sensors
- machine learning
- physical behaviors
- deep learning
1. Fundamentals of Accelerometer-Derived Data
Given the scope of this methodology paper, we will only describe device type and device placement in this section. Details concerning accelerometer sampling frequency, filter, epoch length, wear time, non-wear time, valid wear day, and valid wear week can be found in the literature [14,15].
1.1. Device Type
Accelerometers assess the acceleration of the body in one or more planes of movement. They are small, portable motion sensors that record second-by-second information about the frequency, duration, intensity, and patterns of one’s body movement. That is, accelerometers are designed to assess total ambulatory activity levels via the measurement of accelerations and are therefore capable of providing an estimate of energy expenditure [16,17]. Generally, there are uniaxial and triaxial accelerometers. The uniaxial accelerometer measures acceleration in a single plane (usually the vertical plane), such as the Actical accelerometer. Triaxial accelerometers, on the other hand, measure acceleration in the vertical, horizontal, and mediolateral planes, such as the GENEActiv and ActiGraph accelerometers. For example, the ActiGraph accelerometer (recent models: GT3X+, Link GT9X) is the most popular motion sensor for activity research these days, as this accelerometer can provide very detailed information regarding one’s PA intensity (sedentary, light, moderate, and vigorous), time spent at different PA intensities, estimations of energy expenditure, steps, and raw counts, among others. Accelerometers have shown acceptable validity and reliability and have been acknowledged as accurate objective instruments for PA measurement among various populations [17] in surveillance studies and intervention studies across the world.
1.2. Device Placement
In general, accelerometers can be worn on various locations of the body (e.g., hip, wrist, thigh, ankle, chest). Among them, the hip is the most common placement site, particularly for large epidemiological and intervention studies [6,18]. Yet, in recent years, there has been a shift from placement at the hip to placement at the wrist. For example, the National Health and Nutrition Examination Survey (NHANES) previously employed hip-worn uniaxial accelerometers to measure PA (2003–2004 and 2005–2006) but this has recently changed to wrist-worn triaxial accelerometers during recent population-level PA surveillance (2011–2014) among individuals aged ≥6 years [6]. Some advantages of the wrist-worn placement include improved user compliance (e.g., increased wear compliance, longer wear times), being perceived as less intrusive, with an improved capability of assessing sleep behaviors, and with the capability of capturing more upper extremity movements which cannot be captured with hip-placed devices [19,20,21,22]. For example, in Fairclough et al.’s study [22], the compliance rate for wrist wearing was 89%, as compared with 19% waist wearing among children aged 9–10 years.
The NHANES placed accelerometers on individuals’ non-dominant wrist [7,23,24]. The underlying rationale of such a recommendation is that placement of the monitor on the dominant wrist may misclassify time spent in sedentary behavior as time spent in PA [14]. In other words, it is possible that dominant wrist placement may increase an individual’s activity counts during sedentary behaviors that involve upper extremity movement, such as drawing, coloring, writing, and playing with mobile electronic devices, resulting in continued accumulation of PA while the individual is actually sedentary. On the contrary, if the accelerometer is placed on the non-dominant wrist, there should be limited miscalculated activity counts. Therefore, to accurately distinguish time in sedentary behavior and light-intensity PA—the activity intensity adjacent to sedentary behavior—researchers recommend that wrist-worn accelerometers be placed on the non-dominant wrist while assessing physical behaviors [25,26]. The similarities and differences of wrist- and hip-worn accelerometers are shown in Table 1.
Table 1. Similarities and differences of wrist- vs. hip-worn accelerometers.
| Similarities | Differences | ||||
|---|---|---|---|---|---|
| Wrist-Worn | Hip-Worn | Wrist-Worn | Hip-Worn | ||
| Epoch Length | 1 s, 5 s, 15 s, ≥60 s | Wear time | Daytime only (ranging from 10–16 h/day) | 24 h/day | |
| Sampling Frequency | 30–100 Hz | Device Placement | Right hip (preferred) or left hip | non-dominant wrist or dominant wrist | |
| Filter | Normal filter, low-frequency extension filters | ||||
Note. The bold areas are the comparison categories.
2. Approaches in Processing Wrist Accelerometer Data
As stated earlier, with the advancement of technology, accelerometers are now being widely used in many settings and among various populations for objectively assessing physical behaviors for a typical 24 h/day, 7 days/week. Notably, only the accelerometer placement and sampling frequency criteria have to be determined prior to the assessments, whereas the rest of data processing options can be decided upon later. Although the currently available accelerometers are able to assess physical behaviors, the company-specific, proprietary algorithms make it difficult to compare the data from different studies using different accelerometers. Thus, the agreement of outputs that are generated from different accelerometers remain questioned across studies. In the following section, we will introduce two major approaches (cut point- or threshold-based approaches and machine learning approaches) that have been used to process wrist accelerometer data. Cut point- or threshold-based approaches are widely used as an approach in processing accelerometer data into physical behavior outcomes, using either activity counts or gravitational units. Machine learning, on the other hand, is another approach in generating predictive models with the goal of converting raw accelerometer signal (data) into physical behavior outcomes.
2.1. Cut Point- or Threshold-Based Approaches
2.1.1. Activity Count-Based Cut Points
To sort and analyze accelerometer data, researchers have developed various cut points or regression equations using vector magnitude (i.e., the square root of the sum of squares of each of the three axes) or vertical axis. This common method for categorizing PA intensities has been extensively used for the data processing of hip-mounted accelerometers in previous studies [27,28,29,30,31,32,33,34,35,36,37]. It is important to keep in mind that cut points are the thresholds of activity counts used to categorize activity as sedentary, light PA, moderate PA, vigorous PA, or very vigorous PA, and thus, is arbitrary in nature (see Figure 1). In detail, the classification of PA intensity is correlated with metabolic equivalents (METs—the amount of oxygen consumed when at rest) by using indirect calorimetry as reference standard [38]. Additionally, all previously established intensity thresholds have been determined by the activities chosen while conducting the validation studies. While adopting certain cut points to analyze accelerometer data in a specific study, researchers should follow the same data collection and data processing criteria that were used in the original validation study, making it challenging to apply the most appropriate intensity thresholds in free-living settings. As of the present, there are a number of waist-based cut points available for researchers. Some researchers have attempted to employ the waist-based cut points in the processing of wrist-derived accelerometer data (e.g., ActiGraph Link GT9X). Indeed, the ActiGraph company has suggested that users “uncheck” the box within its companion software (ActiLife, ActiGraph, Pensacola, FL, USA) for wrist-worn data collection if using cut-off points validated for waist-worn accelerometers. The idea of this checkbox is to classify the wrist-worn data to different PA intensities based on cut-off points validated for waist-worn accelerometers. However, this approach unrealistically overestimates individuals’ PA, particularly vigorous intensity PA, in free-living settings.
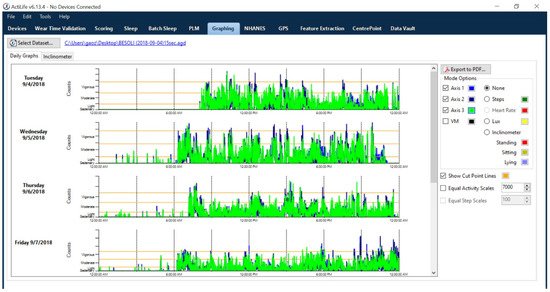
Figure 1. Visual outputs of daily PA from ActiLife v6.13.4 (ActiGraph software).
Recently, researchers have established wrist-worn cut points for different brands of devices. For instance, Johansson et al. [24] developed wrist-worn cut points for young preschoolers (15–36 months). For children, Crouter et al. [7] developed a regression model and cut points for the dominant wrist and recommended using the regression model only. Chandler et al. [39] and Trost et al. [40] developed different cut points for the non-dominant wrist. Similarly, Staudenmayer et al. [41] and Hildebrand et al. [42] developed cut points for the dominant and the non-dominant wrists for adults, respectively. Yet, the accuracy and reliability of these cut points need to be further confirmed by empirical studies [43]. For example, the authors used the cut points [7,42] for the pediatric population data in one of their studies. They found that vigorous intensity PA outputs looked unrealistically high (i.e., more than 3 h per day) with almost zero moderate intensity PA. In addition, researchers indicated that cut points validated for the hip-placed accelerometer could not accurately classify sedentary behavior while being applied to wrist-worn accelerometer data. Hence, they called for the need for the derivation and validation of wrist-worn cut points [44].
2.1.2. Step-Based Cut Points
To avoid inaccurate output from cut points, researchers have employed the minute-by-minute stepping rate analysis to sort raw wrist accelerometer data and determine sedentary behavior and PA intensities. Indeed, this methodology has been employed to determine sedentary behavior, light physical activity (LPA), and moderate-to-vigorous PA (MVPA) in a number of studies conducted in free-living settings [45,46]. Specifically, researchers have used the following cut points to calculate steps per minute: sedentary behavior: 0–19; LPA: 20–99; MVPA: ≥100. A 60 s epoch was used to facilitate the assessment of participants’ minute-by-minute stepping rate [47]. To obtain valid data other than steps per day, participants’ raw data were first processed by manufacturer’s software and then exported to and analyzed in Microsoft Excel (Microsoft Inc.; Redmond, Washington, DC, USA) where “COUNTIFS” and “AVERAGE” functions were utilized to determine sedentary behavior, LPA, and MVPA time.
It should be noted that the minute-by-minute step threshold-based approach only considers one’s steps during walking. Yet, many human movement activities include complex bodily movements that may engage the upper body and go beyond simple ambulation. That is, one’s upper body movements will not be captured well by the simple rendering of steps taken. Therefore, many body movements beyond walking cannot be captured, meaning that an individuals’ PA might be underestimated when using this approach. In fact, the wrist-worn accelerometer detected more steps (2500 steps) than the hip-worn accelerometers in free-living settings [23].
2.1.3. Gravitational Unit-Based Cut Points
There are several brands of accelerometers which provide raw accelerometer data, including GENEActiv, ActiGraph, and Axivity. The raw data can be retrieved from both wrist- and hip-worn accelerometers; therefore, researchers will be able to analyze the wrist-worn accelerometer data through appropriate approaches, such as GGIR cut points, which have been increasingly employed in the scientific communities.
Recently, researchers pre-processed the raw accelerometer signal, and then applied cut points to classify the intensity of PA, based upon the Euclidean norm minus one (ENMO) gravitational unit. GGIR is such a tool to implement the gravitational unit-based threshold approach. GGIR is an open-source R-package (http://cran.r-project.org, accessed on 10 August 2021) used to process multi-day raw accelerometer data for analyzing physical behaviors [48,49]. In detail, the raw data refer to the gravitational acceleration (gravity or milligravity (mg)), as this is used for the calibration of movement and gravitational acceleration. Notably, previous generations of accelerometers usually stored the data with various formats, which makes the outputs restricted by specific accelerometer brands. Thanks to the evolution of technology, most of the currently available triaxial accelerometers are able to store the raw data, which allows GGIR to process and analyze the raw data and generate meaningful physical behavior variables for statistical analyses. The GGIR outputs include each day and average estimates of PA, physical inactivity, and sleep. Simply stated, GGIR is considered a great tool for researchers processing raw accelerometer data and extracting insightful PA and sleep variables and comparing the findings from different accelerometers.
The GGIR R-package and a step-by-step simple example of using GGIR can be found in the literature [10]. The use of GGIR allows researchers to examine and compare studies that used accelerometers from different manufacturers. The sample summary outputs from GGIR provide information on key physical behavior variables, such as average daily wear time, time spent in moderate and/or vigorous PA, the amount of PA, sleep duration, and sleep efficiency (see Figure 2 and Figure 3). In addition, the summary report also provides visual patterns of PA and sleep patterns for each individual wearing day.
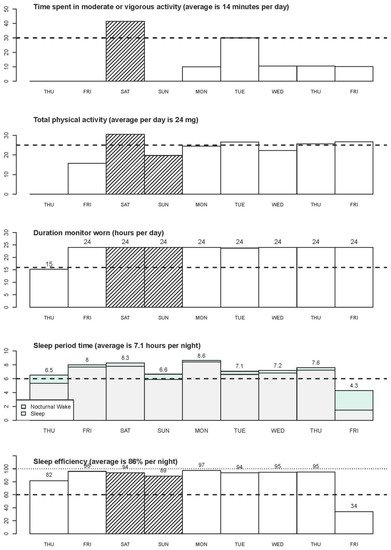
Figure 2. GGIR Visual outputs of PA, wearing time and sleep variables.
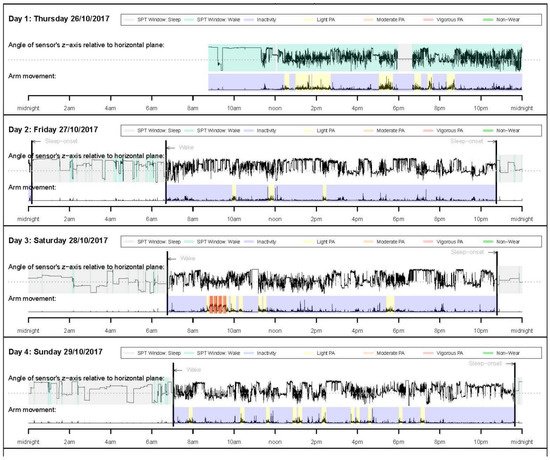
Figure 3. Daily PA and sleep patterns.
The advantages and disadvantages of using GGIR are listed as follows. Advantages include the following: (1) the GGIR R-package includes a broad set of functionalities that allow researchers to process raw data for 24 h/day, 7 days/week, based on different needs and analyzing free-living physical behaviors utilizing evidence-based methods; (2) GGIR can process raw accelerometer data recorded from different accelerometer brands (e.g., ActiGraph, GENEActiv, Axivity) and specifies the input arguments and the selection of output variables; (3) as a software for processing raw accelerometer data, GGIR encourages researchers to use raw data to fully understand the importance of PA and sleep for health; (4) as an open-source software, GGIR can be adapted and extended, based on different research needs, and the package team is continually developing more functions based on feedback from users around the globe. On the other hand, the disadvantages of using GGIR include the following: (1) GGIR can detect inactivity time rather than sedentary time (i.e., time spent sitting or reclining with low energy expenditure during waking time). However, GGIR defines physical inactivity not only in sitting or reclining position, but also includes standing without moving. Thus, caution is needed when interpreting the GGIR-generated inactivity summary, which is different from sedentary behavior; (2) in order to analyze full-day activities and sleep, GGIR requires at least 16 h of wear time to be considered valid. As GGIR has been developed for processing multi-day PA and sleep, this approach may not be suitable for studies measuring activities less than 16 h; (3) MVPA is calculated based on a 5 s epoch and this may sometimes overestimate individual’s actual MVPA; (4) running GGIR may require an intermediate level of running R and R studio software, in that it requires researchers to understand the codes for generating different metrics. Moreover, GGIR outputs include over 100 outcomes and thus, researchers need to fully understand the variables and select appropriate outcomes for interpretation.
This entry is adapted from the peer-reviewed paper 10.3390/jcm10245951
This entry is offline, you can click here to edit this entry!