Your browser does not fully support modern features. Please upgrade for a smoother experience.
Please note this is an old version of this entry, which may differ significantly from the current revision.
Subjects:
Engineering, Biomedical
A biomarker, also known as a biological marker, is any molecule, substance, or measurable process in the body or in one of its components that can support the diagnosis, prognosis, prediction, or response to the treatment of a disease. Recent technological advances have made it possible to detect and quantify biomarkers in saliva samples. Enzymatic assays as a cost-effective alternative to overcome the limitations of current methods for the quantification of biomarkers in saliva.
- enzyme assays
- saliva
- biomarkers
1. Current Methods for Salivary Biomarker Identification
The identification and development of preliminary profiles is the first step in the discovery of biomarkers. These stages are generally accomplished by coupling powerful analytical techniques such as GC-MS and liquid chromatography-MS (LC-MS) [1].
The techniques used for the identification and biomarkers profiling vary in terms of operating principle, sample preparation, and results interpretation, on which the suitability of its implementation depends [2]. For instance, MS can measure hundreds to thousands of metabolites in widely varied samples such as tissues, blood, urine, cerebrospinal fluid, and saliva, being suitable for untargeted and targeted biomarker screening and profiling [3]. However, it should be considered that this technique ionizes the sample in order to identify its components, so it could not be used for further studies if necessary.
Another technique commonly used in metabolomics for biomarkers discovery in saliva samples is NMR. This robust and reproducible technique has a series of advantages over others. For instance, it can detect highly volatile metabolites and does not require derivatization of the compound to increase its detectability as in GC [4]. Despite that sample preparation is less labor-intensive than LC, its sensitivity is lower than coupled techniques such as GC-MS and LC-MS, which can detect biomarkers below the detection limit of NMR [5]. Furthermore, it should be considered that saliva is a complex matrix, so previous pre-treatment steps of filtration and/or centrifugation are required.
Capillary electrophoresis-MS (CE-MS) is an alternative technique for biomarker identification in saliva that has recently grown in acceptance [6]. This method fusions the ability of electrophoresis to separate compounds by their electrophoretic mobility in the function of an applied voltage with the sensitivity of MS, resulting in an attractive and powerful system [7]. Thus, its use has increased rapidly, resulting in more than 50 published articles for metabolite profiling from 2018 to 2020 [8]. This is undoubtedly a reflection of its potential in the field of metabolomics. However, it should be noted that for this technique to be reproducible, multiple problems must be solved to control the loss of metabolites by adsorption processes, volume adjustments, and dilution of the sample [8].
As mentioned, advances in analytical techniques, statistics, and data analysis have resulted in a “boom” in biomarkers discovery. All these techniques show characteristics that make them ideal for quantifying a large number of biomarkers in different samples. However, it should be noted that all are highly sophisticated, requiring highly qualified personnel and perfectly adapted environments for sample analysis. In addition, they require expensive and sensitive equipment that represents a considerable economic investment that is not available for all laboratories. In this sense, its use on a large scale, as in diagnosing highly recurrent diseases, is almost impossible, so simpler and inexpensive methodologies are necessary.
Despite the fact that the aforementioned techniques have been used to quantify several metabolites in saliva, simpler techniques such as those based on antibodies, enzymes, or electrochemistry are required to spread their use in the screening, diagnosis, follow-up, and control of highly recurrent diseases. Among these techniques, enzyme-based ones are of particular interest to this work due to their versatility and low cost.
2. Challenges in Enzymatic Methods for Salivary Biomarkers Detection
The enzymatic activity can accelerate chemical reactions, consuming substrates and generating other compounds [9]. In this sense, all enzymatic assays are based on quantifying the consumption of a substrate or the production of a by-product in a given period of time [10]. Currently, a large number of enzymatic methods for the quantification of biomarkers have been developed [11][12][13]. The success of these platforms lies mainly in their relatively low cost, flexibility, and ability to be implemented for the simultaneous quantification of several biomarkers [14]. Nonetheless, it must be considered that saliva is a complex mixture of compounds so that multiple factors can interfere with the measurement procedure.
Figure 1 shows a graphical representation of all the challenges and considerations in the development of enzymatic methodologies.
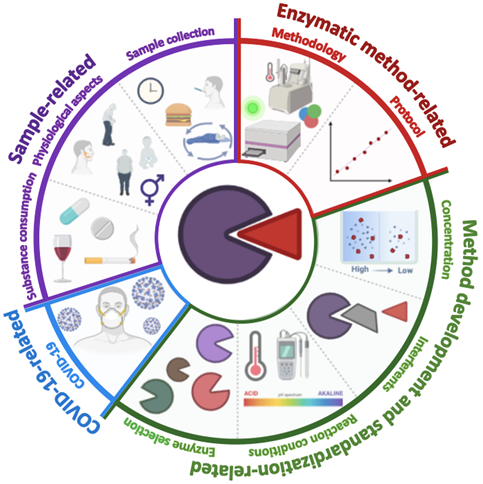
Figure 1. Graphic representation of the main challenges to consider in developing enzymatic methodologies for quantifying salivary biomarkers. Sample-related challenges (diet, circadian cycle, sample collection time, sex, age, physical composition, and other anatomical factors such as the size of the salivary glands); enzymatic method-related (type of assay, correlation degree, and limits of detection and quantification); extrinsic factors (the type of enzyme, the concentrations of enzyme, substrate and other reagents, and the presence of interferents); COVID-19 related factors (precautions and security measures in the collection, processing, and disposal of the sample).
2.1. Sample-Related Challenges
In saliva, as in other biofluids, sampling is the initial stage of the analysis process. Unlike blood, where sampling involves special equipment and trained personnel, in saliva, the donor can perform this step through a simpler process [15]. However, it is important to mention that the patient must receive detailed information about the sampling protocol, including the importance of the exact moment of sampling, excluding tooth brushing before collection, and avoiding the ingestion of beverages, food, or any other product such as chewing gum for at least 30 min before collection [16]. Likewise, the person in charge of supervising the collection must reject samples contaminated with blood, which could significantly influence the determination.
On the other hand, several factors largely depend on the biomarker to be quantified and must be identified during the planning and development stages of the protocol to avoid variations. For example, it is well known that some non-controllable factors such as circadian cycle, circa-annual cycle, age, gender, body weight, and size of the salivary glands affect the concentration of metabolites in saliva [17][18].
There are other factors such as tobacco, alcohol, and the presence of diseases that can modify the composition, viscosity, and pH of saliva, generating discrepancies in biomarker measurements in enzymatic methods [19][20][21].
Although these factors may seem trivial, they could significantly affect enzyme activity during enzymatic assays and, therefore, the quantification of biomarkers.
On the other hand, the salivary composition can also be altered under certain pathologies, such as diabetes [22][23], oral infections [24], Sjogren’s syndrome [25], kidney disease [26], cancer [27], and virus infections [28]. The presence of these diseases can contribute to variations in the concentration of salivary biomarkers. For example, one study showed a marked decrease in salivary amylase levels and increased glucose concentration in diabetic patients compared to healthy patients [29]. In addition to the obvious effect of decreased biomarker concentration, these diseases can alter salivary pH, an essential parameter in enzymatic methods. In a study carried out by Seethalakshmi et al., diabetes was directly correlated with the pH value, observing a decrease of more than one pH unit in diabetic patients compared to the control group [22]. These findings can be explained as, during diabetes, an increase in the concentration of sugars in the saliva is observed, which in turn increases the presence of bacteria responsible for cavities and increases oral infections. Similarly, during infectious processes, bacteria can use the sugars, acidifying the medium. This decrease in pH can generate variations in enzymatic determinations if it is not properly studied and controlled.
2.2. Enzymatic Method-Related Challenges
Enzymatic methods are usually based on detecting substrate consumption or its generation over a period of time [10]. There are different classifications for enzyme-based methodologies [30]. For instance, they can be classified depending on how enzymatic reactions are studied (initial speed, curve progress, kinetics, among others) or according to how the product is quantified (continuously or discontinuously). Within the entire range of options, particular interest has been placed in continuous methods based on spectrophotometry [31]. These tests quantify the light absorbed by a sample when a beam of light passes through it [32]. In enzymatic assays, the absorbed light changes due to the generation of by-products resulting from enzyme activity in either single or multiple reactions. The simplicity of these methods in terms of material, equipment, and training has contributed to their widespread acceptance and implementation. However, these methods are often inadequate for detecting biomarkers at very low concentrations and other strategies, such as derivatization, are required, complexing the process [33].
Fortuitously, other methods, such as those based on fluorescence or chemiluminescence, can overcome the limitations mentioned above by being much more sensitive than the previous ones [34][35]. These methods use different molecules capable of absorbing light and emitting it at a specific wavelength, either by themselves or acquiring this property due to a chemical reaction. Due to this, they are much more sensitive than spectrophotometric tests, but it should be considered that these methods are more expensive as they require equipment with special characteristics, are susceptible to interference by impurities in saliva, and are highly unstable when exposed to light. Table 1 shows examples of the application of these spectrophotometric methods to quantify biomarkers in different biological matrices.
Table 1. Examples of the use of spectrophotometric methods for the quantification of biomarkers in biofluids.
| Method | Principle | Detection Range | Biofluid | Biomarker | Detection Limit | Reference |
|---|---|---|---|---|---|---|
| Colorimetric | Absorption of radiation in the visible area by colored substances | M–nM | Blood | Glucose | 31 µg mL−1 | [36] |
| Saliva | Glucose | 0.36 µg mL−1 | [37] | |||
| Sweat | Cortisol | 97 ng mL−1 | [38] | |||
| Urine | Tyrosine | 2.54 µM | [39] | |||
| Luminescent | Light emitted by a molecule when receiving radiant energy | mM–nM | Blood | Glucose | 80 nM | [40] |
| Saliva | Glucose | 0.63 nM | [41] | |||
| Urine | Melamine | 3.5 ng mL−1 | [42] | |||
| Fluorescent | Light emitted by a molecule when receiving radiant energy | mM–nM | Blood | Glucose | 3.7 µM | [43] |
| Sweat | Chloride | 3 mM | [44] | |||
| Urine | Iodide | 100 nM | [45] |
There are other more sophisticated techniques, such as microscale thermophoresis, which combine the precision of fluorometry with the sensitivity and versatility of thermophoresis, resulting in a fast, robust, and flexible platform [46]. Among its characteristics, it stands out that it requires sample volumes of less than 10 µL and can analyze multiple substrates simultaneously [47]. Although the advantages of these tests are remarkable, their implementation is limited by high equipment and operational costs, making it difficult to implement them on a large scale and in poorly equipped laboratories.
Despite the fact that the options are vast, the selection of the method depends on multiple factors that must be previously analyzed by the researchers. For example, if an affordable method for the detection of abundant biomarkers with relative accuracy is required, a colorimetric assay could be a suitable option. On the other hand, if the biomarker is present in lower concentration and high precision is required, the most viable options would be to use fluorescent, luminescent, or microscale thermophoresis methods.
2.3. Method Development and Standardization-Related Challenges
As the star players of the game, enzymes are the first factor to consider in the development of enzyme assays. The enzyme selection obviously depends on the biomarker to be quantified; however, this choice involves other important details. It is widely known that enzymes display their maximum activity under certain environmental conditions, and disturbances in these states significantly affect their activity [48]. This atmosphere includes factors such as pH, temperature, ionic strength, concentrations of substrate and enzymes, and interferents. All these parameters have a significant impact on the correct performance of these biomolecules and must be carefully analyzed.
Ionic strength is another factor that must be closely considered in enzyme-based assays. This characteristic is given as a function of the concentration of all the ions present in the solution [49].
Multiple enzymes (especially mammalian-derived ones) have an optimum pH, temperature, and ionic strength close to the physiological conditions (pH of 7.4, temperature of 37 °C, and ionic strength of 0.15 M) [50][51][52]. In saliva, the normal pH ranges from 6.2 to 7.6 (average pH of 6.7) [19]; these pH values are below blood values, and their effect on enzymes should be studied. This phenomenon has been widely documented.
Similar to the pH, the temperature is a parameter that has a known influence on enzyme activity. As in any chemical reaction, the rate of the enzyme-mediated reaction is strongly influenced by temperature, (generally increasing the reaction as the temperature increases). However, higher temperatures (over about 55 °C) lead to the denaturation of enzymes and the loss of their activity. It is important to mention that this depends closely on the enzyme selected, as some enzymes have a higher optimum temperature, such as polymerase and helicase (optimum temperature of 70–80 °C) [53].
In enzymatic assays, the balance between substrate concentrations, enzymes, and interferents occupies a central place. This is perhaps one of the main challenges that must be faced when using saliva as a sample as the concentrations of biomarkers are usually low, and it contains multiple compounds that can act as interferers [54].
Many other factors are not discussed in this review. However, they must be meticulously considered in enzymatic assays, such as the correct handling of the sample and methodological aspects related to sample preparation, choice of blanks, incubation and reading times, as well as data processing. All these elements taken together can lead to discrepancies in the intra-day and intra-experiment results, thus the importance of establishing a simple, replicable, and robust protocol.
This entry is adapted from the peer-reviewed paper 10.3390/molecules26227026
References
- Van Gool, A.; Corrales, F.; Čolović, M.; Krstić, D.; Oliver-Martos, B.; Martínez-Cáceres, E.; Jakasa, I.; Gajski, G.; Brun, V.; Kyriacou, K.; et al. Analytical Techniques for Multiplex Analysis of Protein Biomarkers. Expert Rev. Proteom. 2020, 17, 257–273.
- Carneiro, G.; Radcenco, A.L.; Evaristo, J.; Monnerat, G. Novel Strategies for Clinical Investigation and Biomarker Discovery: A Guide to Applied Metabolomics. Horm. Mol. Biol. Clin. Investig. 2019, 38.
- Crutchfield, C.A.; Thomas, S.N.; Sokoll, L.J.; Chan, D.W. Advances in Mass Spectrometry-Based Clinical Biomarker Discovery. Clin. Proteom. 2016, 13, 1–12.
- Smolinska, A.; Blanchet, L.; Buydens, L.M.C.; Wijmenga, S.S. NMR and Pattern Recognition Methods in Metabolomics: From Data Acquisition to Biomarker Discovery: A Review. Anal. Chim. Acta 2012, 750, 82–97.
- Issaq, H.J.; Van, Q.N.; Waybright, T.J.; Muschik, G.M.; Veenstra, T.D. Analytical and Statistical Approaches to Metabolomics Research. J. Sep. Sci. 2009, 32, 2183–2199.
- Zhang, W.; Segers, K.; Mangelings, D.; Eeckhaut, A.V.; Hankemeier, T.; Heyden, Y.V.; Ramautar, R. Assessing the Suitability of Capillary Electrophoresis-Mass Spectrometry for Biomarker Discovery in Plasma-Based Metabolomics. Electrophoresis 2019, 40, 2309–2320.
- Kolch, W.; Neusüß, C.; Pelzing, M.; Mischak, H. Capillary Electrophoresis–Mass Spectrometry as a Powerful Tool in Clinical Diagnosis and Biomarker Discovery. Mass Spectrom. Rev. 2005, 24, 959–977.
- Zhang, W.; Ramautar, R. CE-MS for Metabolomics: Developments and Applications in the Period 2018–2020. Electrophoresis 2021, 42, 381–401.
- Daniel, R.M.; Dunn, R.V.; Finney, J.L.; Smith, J.C. The Role of Dynamics in Enzyme Activity. Annu. Rev. Biophys. Biomol. Struct. 2003, 32, 69–92.
- Srinivasan, B. Words of Advice: Teaching Enzyme Kinetics. FEBS J. 2021, 288, 2068–2083.
- Brown, T.M.; Prabhu, S.D. The Evolution of the Enzymatic Diagnosis of Myocardial Infarction. Am. J. Med. Sci. 2020, 359, 67–69.
- Gaffney, E.M.; Lim, K.; Minteer, S.D. Breath Biosensing: Using Electrochemical Enzymatic Sensors for Detection of Biomarkers in Human Breath. Curr. Opin. Electrochem. 2020, 23, 26–30.
- Moussa, S.; Horn, M.R.V.; Shah, A.; Pollegioni, L.; Thibodeaux, C.J.; Ruthazer, E.S.; Mauzeroll, J. Editors’ Choice—A Miniaturized Enzymatic Biosensor for Detection of Sensory-Evoked D-Serine Release in the Brain. J. Electrochem. Soc. 2021, 168, 025502.
- Bhide, A.; Cheeran, S.; Muthukumar, S.; Prasad, S. Enzymatic Low Volume Passive Sweat Based Assays for Multi-Biomarker Detection. Biosensors 2019, 9, 13.
- Tiwari, M. Science behind Human Saliva. J. Nat. Sci. Biol. Med. 2011, 2, 53–58.
- Chiappin, S.; Antonelli, G.; Gatti, R.; De Palo, E.F. Saliva Specimen: A New Laboratory Tool for Diagnostic and Basic Investigation. Clin. Chim. Acta 2007, 383, 30–40.
- Pushpass, R.-A.G.; Daly, B.; Kelly, C.; Proctor, G.; Carpenter, G.H. Altered Salivary Flow, Protein Composition, and Rheology Following Taste and TRP Stimulation in Older Adults. Front. Physiol. 2019, 10, 652.
- Price, D.A.; Close, G.C.; Fielding, B.A. Age of Appearance of Circadian Rhythm in Salivary Cortisol Values in Infancy. Arch. Dis. Child. 1983, 58, 454–456.
- Baliga, S.; Muglikar, S.; Kale, R. Salivary PH: A Diagnostic Biomarker. J. Indian Soc. Periodontol. 2013, 17, 461–465.
- Batista, T.B.D.; Chaiben, C.L.; Penteado, C.A.S.; Nascimento, J.M.C.; Ventura, T.M.O.; Dionizio, A.; Rosa, E.A.R.; Buzalaf, M.A.R.; Azevedo-Alanis, L.R. Salivary Proteome Characterization of Alcohol and Tobacco Dependents. Drug Alcohol Depend. 2019, 204, 107510.
- Nagler, R.M.; Hershkovich, O. Age-Related Changes in Unstimulated Salivary Function and Composition and Its Relations to Medications and Oral Sensorial Complaints. Aging Clin. Exp. Res. 2005, 17, 358–366.
- Seethalakshmi, C.; Reddy, R.J.; Asifa, N.; Prabhu, S. Correlation of Salivary pH, Incidence of Dental Caries and Periodontal Status in Diabetes Mellitus Patients: A Cross-sectional Study. J. Clin. Diagn. Res. 2016, 10, ZC12–ZC14.
- Mata, A.D.; Marques, D.; Rocha, S.; Francisco, H.; Santos, C.; Mesquita, M.F.; Singh, J. Effects of Diabetes Mellitus on Salivary Secretion and Its Composition in the Human. Mol. Cell Biochem. 2004, 261, 137–142.
- Bokor-Bratic, M.; Cankovic, M.; Dragnic, N. Unstimulated Whole Salivary Flow Rate and Anxiolytics Intake Are Independently Associated with Oral Candida Infection in Patients with Oral Lichen Planus. Eur. J. Oral Sci. 2013, 121, 427–433.
- Letawsky, V.H.; Schreiber, A.-M.; Skoretz, S.A. A Tutorial on Saliva’s Role in Swallowing with a Focus on Sjögren’s Syndrome. Am. J. Speech-Lang. Pathol. 2020, 29, 1307–1319.
- Anuradha, B.R.; Katta, S.; Kode, V.S.; Praveena, C.; Sathe, N.; Sandeep, N.; Penumarty, S. Oral and Salivary Changes in Patients with Chronic Kidney Disease: A Clinical and Biochemical Study. J. Indian Soc. Periodontol. 2015, 19, 297–301.
- Shpitzer, T.; Bahar, G.; Feinmesser, R.; Nagler, R.M. A Comprehensive Salivary Analysis for Oral Cancer Diagnosis. J. Cancer Res. Clin. Oncol. 2007, 133, 613–617.
- Proctor, G.B.; Shaalan, A.M. Disease-Induced Changes in Salivary Gland Function and the Composition of Saliva. J. Dent. Res. 2021, 00220345211004842.
- Panchbhai, A.S.; Degwekar, S.S.; Bhowte, R.R. Estimation of Salivary Glucose, Salivary Amylase, Salivary Total Protein and Salivary Flow Rate in Diabetics in India. J. Oral Sci. 2010, 52, 359–368.
- Martínez Cuesta, S.; Rahman, S.A.; Furnham, N.; Thornton, J.M. The Classification and Evolution of Enzyme Function. Biophys. J. 2015, 109, 1082–1086.
- Veskoukis, A.S.; Kyparos, A.; Paschalis, V.; Nikolaidis, M.G. Spectrophotometric Assays for Measuring Redox Biomarkers in Blood. Biomarkers 2016, 21, 208–217.
- Mäntele, W.; Deniz, E. UV–VIS Absorption Spectroscopy: Lambert-Beer Reloaded. Spectrochim. Acta Part A Mol. Biomol. Spectrosc. 2017, 173, 965–968.
- Karpińska, J. Derivative Spectrophotometry—Recent Applications and Directions of Developments. Talanta 2004, 64, 801–822.
- Fereja, T.H.; Hymete, A.; Gunasekaran, T. A Recent Review on Chemiluminescence Reaction, Principle and Application on Pharmaceutical Analysis. ISRN Spectrosc. 2013, 2013, e230858.
- Bachmann, L.; Zezell, D.M.; Ribeiro, A.d.C.; Gomes, L.; Ito, A.S. Fluorescence Spectroscopy of Biological Tissues—A Review. Appl. Spectrosc. Rev. 2006, 41, 575–590.
- Lee, P.-C.; Li, N.-S.; Hsu, Y.-P.; Peng, C.; Yang, H.-W. Direct Glucose Detection in Whole Blood by Colorimetric Assay Based on Glucose Oxidase-Conjugated Graphene Oxide/MnO2 Nanozymes. Analyst 2019, 144, 3038–3044.
- Mohammadnejad, P.; Asl, S.S.; Aminzadeh, S.; Haghbeen, K. A New Sensitive Spectrophotometric Method for Determination of Saliva and Blood Glucose. Spectrochim. Acta Part A Mol. Biomol. Spectrosc. 2020, 229, 117897.
- Tu, E.; Pearlmutter, P.; Tiangco, M.; Derose, G.; Begdache, L.; Koh, A. Comparison of Colorimetric Analyses to Determine Cortisol in Human Sweat. ACS Omega 2020, 5, 8211–8218.
- Chen, H.-Y.; Yeh, Y.-C. Detection of Tyrosine and Monitoring Tyrosinase Activity Using an Enzyme Cascade-Triggered Colorimetric Reaction. RSC Adv. 2020, 10, 29745–29750.
- Yu, J.; Cao, M.; Wang, H.; Li, Y. Novel Manganese(II)-Based Metal-Organic Gels: Synthesis, Characterization and Application to Chemiluminescent Sensing of Hydrogen Peroxide and Glucose. Microchim. Acta 2019, 186, 696.
- Beigi, S.M.; Mesgari, F.; Hosseini, M.; Aghazadeh, M.; Ganjali, M.R. An Enhancement of Luminol Chemiluminescence by Cobalt Hydroxide Decorated Porous Graphene and Its Application in Glucose Analysis. Anal. Methods 2019, 11, 1346–1352.
- Tang, X.; Shi, X.; Tang, Y.; Yue, Z.; He, Q. Flow-Injection Chemiluminescence Determination of Melamine in Urine and Plasma. Luminescence 2012, 27, 229–233.
- Yuan, J.; Cen, Y.; Kong, X.-J.; Wu, S.; Liu, C.-L.; Yu, R.-Q.; Chu, X. MnO2-Nanosheet-Modified Upconversion Nanosystem for Sensitive Turn-On Fluorescence Detection of H2O2 and Glucose in Blood. ACS Appl. Mater. Interfaces 2015, 7, 10548–10555.
- Li, F.; Feng, Y.; Huang, Y.; Yao, Q.; Huang, G.; Zhu, Y.; Chen, X. Colorimetric Sensing of Chloride in Sweat Based on Fluorescence Wavelength Shift via Halide Exchange of CsPbBr3 Perovskite Nanocrystals. Microchim. Acta 2021, 188, 2.
- Zhong, Y.; Wang, Q.; He, Y.; Ge, Y.; Song, G. A Novel Fluorescence and Naked Eye Sensor for Iodide in Urine Based on the Iodide Induced Oxidative Etching and Aggregation of Cu Nanoclusters. Sens. Actuators B Chem. 2015, 209, 147–153.
- Jerabek-Willemsen, M.; Wienken, C.J.; Braun, D.; Baaske, P.; Duhr, S. Molecular Interaction Studies Using Microscale Thermophoresis. ASSAY Drug Dev. Technol. 2011, 9, 342–353.
- Jerabek-Willemsen, M.; André, T.; Wanner, R.; Roth, H.M.; Duhr, S.; Baaske, P.; Breitsprecher, D. MicroScale Thermophoresis: Interaction Analysis and Beyond. J. Mol. Struct. 2014, 1077, 101–113.
- Auriol, M.; Filali-Meknassi, Y.; Adams, C.D.; Tyagi, R.D. Natural and Synthetic Hormone Removal Using the Horseradish Peroxidase Enzyme: Temperature and PH Effects. Water Res. 2006, 40, 2847–2856.
- Solomon, T. The Definition and Unit of Ionic Strength. J. Chem. Educ. 2001, 78, 1691.
- Butré, C.I.; Wierenga, P.A.; Gruppen, H. Effects of Ionic Strength on the Enzymatic Hydrolysis of Diluted and Concentrated Whey Protein Isolate. J. Agric. Food Chem. 2012, 60, 5644–5651.
- Herlet, J.; Kornberger, P.; Roessler, B.; Glanz, J.; Schwarz, W.H.; Liebl, W.; Zverlov, V.V. A New Method to Evaluate Temperature vs. PH Activity Profiles for Biotechnological Relevant Enzymes. Biotechnol. Biofuels 2017, 10, 234.
- Synowiecki, J.; Grzybowska, B.; Zdziebło, A. Sources, Properties and Suitability of New Thermostable Enzymes in Food Processing. Crit. Rev. Food Sci. Nutr. 2006, 46, 197–205.
- Bhat, S.; McLaughlin, J.L.H.; Emslie, K.R. Effect of Sustained Elevated Temperature Prior to Amplification on Template Copy Number Estimation Using Digital Polymerase Chain Reaction. Analyst 2011, 136, 724–732.
- Dame, Z.T.; Aziat, F.; Mandal, R.; Krishnamurthy, R.; Bouatra, S.; Borzouie, S.; Guo, A.C.; Sajed, T.; Deng, L.; Lin, H.; et al. The Human Saliva Metabolome. Metabolomics 2015, 11, 1864–1883.
This entry is offline, you can click here to edit this entry!