Your browser does not fully support modern features. Please upgrade for a smoother experience.
Please note this is an old version of this entry, which may differ significantly from the current revision.
Subjects:
Agriculture, Dairy & Animal Science
Thrips (Thysanoptera: Thripidae) is a major insect pest for alfalfa which can result in decreased plant nutrients, low yields, and even plant death. To identify the differentially expressed genes and metabolites in response to thrips in alfalfa, a combination of metabolomics and transcriptomics was employed using alfalfa (Caoyuan No. 2) with and without thrips infestation.
- transcriptome
- metabolome
- Medicago sativa
1. Introduction
Alfalfa (Medicago sativa L.), a legume forage with high quality and yield, has become an important material basis for the development of grass husbandry all over the world. Herbivorous thrips (Thysanoptera) are important pests affecting alfalfa in China and most other regions where alfalfa is grown [1,2]. Thrips feed on leaves, stems, fruits, and/or pollen of green plants, and they are vectors of destructive viruses, resulting in decreased plant nutrients and growth, low yields, and even plant death [3]. It has been reported that thrips cause about 10%–30% grass yield loss every year [4]. However, thrips are highly polyphagous and hard to control due to their complex lifestyle [3]. Integrated pest management guidelines for crops emphasize use of a range of tactics to reduce pest abundance, rather than reliance on insecticides, which would induce ecosystem damage and food safety issues [5].
Plants have developed highly effective and dynamic defensive strategies against insect pests, including various morphological and biochemical defenses that restrict insect pests, including constitutive defense and induced defense [6,7]. Compared with constitutive defense, induced defense is more often initiated upon herbivore attack due to the trade-off between plant growth and defense [8]. Herbivore-inducible plant defenses are initiated after perception of the herbivore through damage-associated molecular patterns or herbivore-associated molecular patterns. Many authors have reported that several morphological traits were associated with host plant resistance to thrips, such as leaf hair density, leaf hairiness, leaf hardness, leaf wax, glandular hairs, and trichomes [9,10,11]. However, biochemical-based defense is considered more effective, as it directly affects insect growth and development [12]. It has been reported that many metabolites and plant hormones are associated with thrips resistance, such as protease inhibitors, phenols, tannins, salicylic acid (SA), and jasmonic acid (JA) [13,14,15,16]. Most of the metabolites known to be involved in thrips constitutive defense are inherently present in the plant [17,18,19,20,21], but some accumulate in response to thrips infestation. For instance, phenolic compounds, such as tannin, have been found to accumulate in response to thrips infection [7,20].
Compared to leaf-chewing or phloem-feeding herbivores, far less is known about the induced plant responses to cell-content-feeding insects such as thrips [8]. Even though there is literature related to constitutive defense mechanisms against thrips [17,18,19,21], functional analyses of defensive compounds that are induced upon thrips attack are less [3,20]. Next generation sequencing, and more specifically RNA-Sequencing (RNA-Seq), has become a popular and comprehensively informative approach to predict and validate novel key regulators and their direct and indirect targets in plant signaling networks to pests. Recently, a comparative transcriptomes analysis was employed to assemble the expressed genes of alfalfa, which mainly focused on the induced defense genes related to both resistant and susceptible alfalfa lines after thrips infestation, but the analysis paid little attention to the genes specially related to thrips resistance in the resistant cultivar [22]. In addition, metabolomics can aid the discovery of plant metabolites related to thrips induced resistance. Combined transcriptome and metabolome can allow quantitative mapping of transcripts directly to metabolic pathways involved in thrips induced resistance.
2. Summary of Transcriptome and Metabolome Analysis
Transcription and widely targeted metabolites profiles of Caoyuan No. 2 without or with thrips treatment (S_CK vs. S_T) were explored. Three independent biological replicates were used for each treatment, resulting in six samples. A total of 86.34 Gb Clean Data was obtained and the clean data of each sample reached more than 12.57 Gb, and the Q30 base percentage was more than 91.67%. A transcriptome database containing 99,111 unigene of average length 822.74 bp was obtained using Trinity software, with an N50 length of 1267 bp and an E90N50 length of 2172 bp. All unigenes and transcripts obtained by transcriptome assembly were aligned with six major databases (Nr, Swiss-prot, Pfam, COG, GO, and KEGG databases). A total 62,266 homologs of the 99,111 assembled unigenes were found to have homologs in the databases NR (56,433), Swiss-prot (40,046), Pfam (40,012), COG (45,178), GO (48,280), and KEGG (26,953) (Figure 1A). For the species distribution of the top BLAST hits in the NR database, 39,403 (69.03%) annotated unigenes matched the sequence of Medicago truncatula (Figure 1B). In addition, 772 metabolites were detected, which could be grouped into 23 major classes.
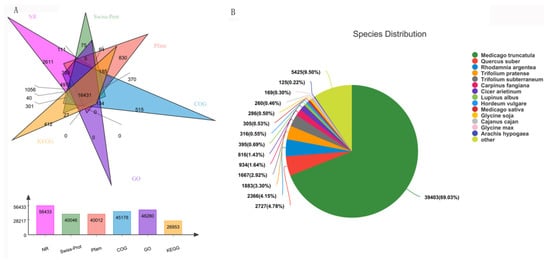
Figure 1. Function annotations of transcriptome sequencing. (A) Functional annotation numbers of unigenes in the NR, Swiss-prot, Pfam, COG, GO, and KEGG databases. (B) Annotated species distribution in the NR database.
Principal component analysis (PCA) of the differentially expressed genes and differentially accumulated metabolites showed that the S_CK treatment group showed obvious differences with the S_T treatment group, which explained 44.32% and 49.88% of the total variation (Figure 2A,B). These results indicated that Caoyuan No. 2 is susceptible to thrips.

Figure 2. Differentially expressed genes and differentially accumulated metabolites between S_CK and S_T. (A) Principal component analysis (PCA) of the variance-stabilized estimated raw counts of differentially expressed genes. (B) Principal component analysis (PCA) of the variance-stabilized estimated raw counts of differentially accumulated metabolites. (C) Expression profiling changes of genes in thrips injection tissues. (D) Volcano Plot of differentially expressed genes between S_CK and S_T. Each point in the volcano map represents a metabolite, the X axis represents the logarithm of the quantitative difference of a certain metabolite in the two samples; the Y axis represents the VIP value. Samples are categorized by cultivars and thrips infestation as different marker colors and shapes. The green dots represent downregulated differentially expressed genes or differentially accumulated metabolites, the red dots represent upregulated differentially accumulated metabolites or genes, and the gray represents detected but not significantly differentially expressed genes or differentially accumulated metabolites. S_CK: Caoyuan No. 2 without thrips infection; S _T: Caoyuan No. 2 with thrips infection.
3. Differentially Expressed Genes and Differentially Accumulated Metabolites Analysis Related to Thrips Infection
The differentially expressed genes among the two groups were analyzed in the RNA-seq datasets. After treatment with thrips, a total of 4187 DEGs were detected, of which, respectively, 3379 and 808 upregulated and downregulated differentially expressed genes were observed (S_CK vs. S_T, p-adjust value < 0.05 and |log2FC| ≥ 1, Figure 2C). For the evaluation of differentially accumulated metabolites between S_CK and S_T, the OPLS-DA model was applied. The established OPLS-DA model showed good fitness. After treatment with thrips, a total of 88 upregulated and 90 downregulated metabolites were detected between the treatments (S_CK vs. S_T, VIP > 1 and |log2FC| ≥ 1, Figure 2D).
Further analysis showed that 1681 upregulated and 199 downregulated genes were annotated to 116 and 74 different KEGG pathways, respectively. Further analysis showed that 499 of the upregulated and 19 of the downregulated differentially expressed genes were annotated to pathways including genetic information process (such as folding, sorting, and degradation transcription, translation), 723 of the upregulated and 111 of the downregulated differentially expressed genes were related to metabolism (such as carbohydrate metabolism, lipid metabolism, amino acid metabolism, biosynthesis of other secondary metabolites, etc.), 80 of the upregulated and 10 of the downregulated differentially expressed genes were involved in cellular process, and 41 and 29 upregulated as well as 9 and 10 of the downregulated differentially expressed genes were annotated to environmental adaptation and signal transduction, respectively (Figure 3A,B).
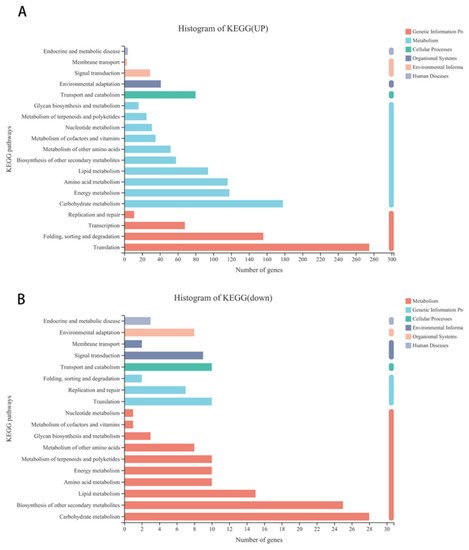
Figure 3. KEGG pathway classification of differentially expressed genes in alfalfa after thrips infection. (A) KEGG pathway classification of upregulated differentially expressed genes in alfalfa after thrips infection. (B) KEGG pathway classification of downregulated differentially expressed genes in alfalfa after thrips infection.
Furthermore, we found that all the key genes (NPR1, TGA, and PR-1) related to salicylic acid (SA) transduction and JAZ gene related to jasmonic acid (JA) signal were significantly induced in S_CK after thrips attack. In addition, the results showed that some key genes involved in plant–pathogen interaction (such as elfl8, CDPK, Rboh, CaMCML, MPK4, WRKY22, WRKY25, WRKY29, WRKY33, Pit6, HSP90, SGT1, EDS1, NHO1, PR1, and KCS) and MAPK signaling pathway–plant (such as MPK4, WRKY22, WRKY29, WRKY33, ACS6, NDPK2, CaM4, Rboh, and PR1) were induced or suppressed by thrips infection.
For differentially accumulated metabolites, we found that the differentially accumulated metabolites were most significantly enriched to flavonoid biosynthesis, isoflavonoid biosynthesis, amino acids biosynthesis, and arginine and proline biosynthesis (Figure 4A). Furthermore, the results showed that the top 10 upregulated metabolites in alfalfa after thrips infection were 8-Hydroxy-2-deoxyguanosine (pmb3350), 4-O-Caffeoyl quinic acid (pme2938), genistein (pme1578), 3,7-Di-O-methylquercetin (pme3288), 8-Hydroxy-2-deoxyguanosine (pme3350), pinocembrin (pme2982), tricetin (pme3303), l-Carnosine (pme0116), tricin O-phenylformic acid (pmb0744), 1-O-p-Coumaroyl quinic acid (pmb3068), and tectochrysin (pmf0551). The top 10 downregulated metabolites between S_CK and S_T were N-Caffeoyl agmatine (pma0101), l-Alanine (pme1988), kaempferol 3-O-rhamnoside (pme3297), pyridoxal 5’-phosphate (pme1281), sucralose (pmf0574), syringetin (pmb0569), 5-O-hexoside, solanine (pmf0254), diosmin (pmf0549), engeletin (pmf0301), and narirutin (pmf0006) (Figure 4B).
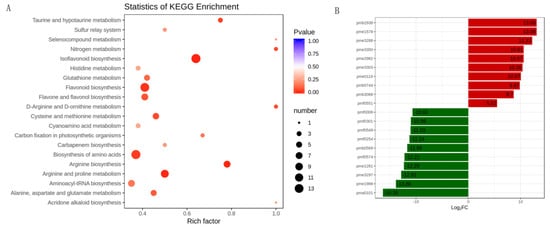
Figure 4. The differentially accumulated metabolites analysis in alfalfa after thrips infection. (A) Scatter plot of KEGG pathways in alfalfa after thrips infection to which the differentially accumulated metabolites were enriched. The degree of enrichment is shown by Rich factor, p-value, and the number of metabolites enriched in each pathway; (B) Top 10 up-accumulated (shown in red bars) and top 10 down-accumulated metabolites (shown in green bars) in alfalfa after thrips infection.
4. Combined Transcriptome and Metabolome Analyses
To quantitatively map the transcripts directly to metabolic pathways involved in thrips induced resistance, the co-jointKEGG pathway enrichment analysis of transcriptome and metabolome was performed. The results showed that the same pathways of DEGs and DAMs were enriched to flavonoid biosynthesis (p-value < 0.05) and isoflavonoid biosynthesis (p-value < 0.01) (Figure 5). In order to better understand the relationship between genes and metabolites, the differentially expressed genes and differentially accumulated metabolites were simultaneously mapped to the KEGG pathway diagram. As shown in Figure 6A,B, nine key upregulated genes (CYP93C, HI40MT, HIDH, I2′H, IF7MAT, 7-IOMT, VR, CYP81E9, and PTR) and 14 metabolites (11 upregulated and 3 downregulated) were simultaneously mapped to the isoflavonoid biosynthesis (ko00943). In addition, 14 differentially accumulated metabolites and 2 key the differentially expressed genes were simultaneously mapped to the flavonoid biosynthesis (ko00941).
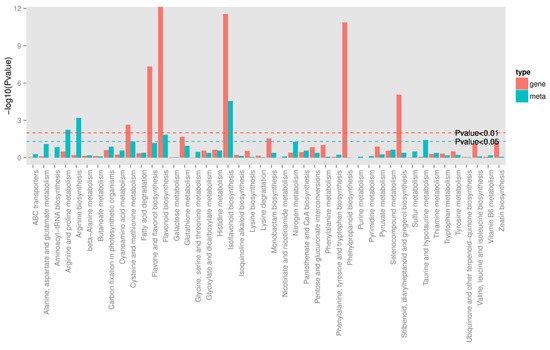
Figure 5. Joint analysis of the differentially expressed genes and differentially accumulated metabolites between S_CK and S_T. Green line represents the selected gene and metabolic pathway at p-value < 0.05, and red line represents the selected gene and metabolic pathway at p-value < 0.01.
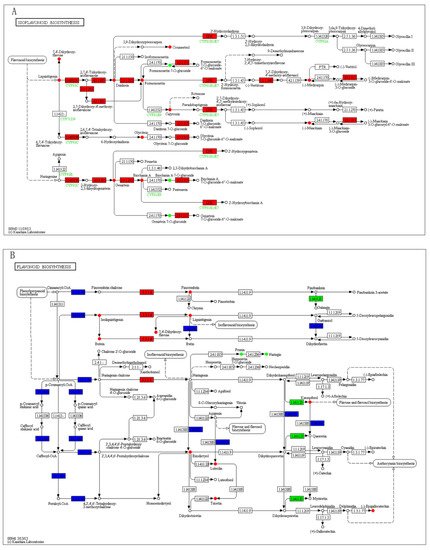
Figure 6. The differentially expressed genes and differentially accumulated metabolites simultaneously mapped to the KEGG pathway diagram. (A) The differentially expressed genes and differentially accumulated metabolites simultaneously mapped to the isoflavonoid biosynthesis (ko00943). (B) The differentially expressed genes and differentially accumulated metabolites simultaneously mapped to the flavonoid biosynthesis (ko00941). Green color represents a significant downregulation of the gene or metabolite, red color represents a significant upregulation of the gene or metabolite, and blue color represents a gene that is both upregulated and downregulated.
This entry is adapted from the peer-reviewed paper 10.3390/genes12121967
This entry is offline, you can click here to edit this entry!