Your browser does not fully support modern features. Please upgrade for a smoother experience.
Please note this is an old version of this entry, which may differ significantly from the current revision.
Subjects:
Health Care Sciences & Services
目前的研究表明,城市洪水领域的论文发表数量普遍呈逐年上升趋势,研究重点已从探索水文过程转向采用先进的管理措施解决城市洪水问题。
- urban floods
- stormwater management
- Hotspots
- Frontiers
一、介绍
城市洪水的发生一般与两个主要现象有关:降水事件期间径流的产生(山洪暴发)和河道溢流(河流或河岸洪水)[ 8 ]。究其原因,一方面,气候变化增加了极端天气发生的频率和强度,间歇性暴雨增多、干旱加剧、沿海风暴潮增多 [ 9 , 10 ]],比如2021年7月欧洲和中国北方的暴雨。另一方面,随着社会生产力的发展、科学技术的进步,以及一个国家或地区产业结构的调整,社会逐渐转型从以农业为主的传统农村,到以工业(第二)、服务业(第三)等非农业为主的现代城市。这导致从农村地区的人们城市正在进行的迁移和城市地区的不断增加,在21世纪的城市现象是更广泛的[ 11,12,13 ]。例如,中国的城镇化率从 1949 年的 10.64% 上升到 2020 年的 63.89%(见中国国家统计局http://www.stats.gov.cn/tjsj/ndsj/#,2021年 3 月 8 日访问)。城市化大大减少了城市下垫面的渗透面积,导致大量城市雨水流向地面或进入人工排水系统,而不是自然渗入地下并被土壤吸收[ 14 , 15 ]。当降雨量超过排水系统的能力,特别是在城市排水基础设施的能力的恶化和不足部分地区,缺乏优秀的城市规划策略[ 16,17 ],雨水也没办法去,但必须留在地面形成城市内涝 [ 18 , 19 ]]。此外,快速的城市扩张加剧了城市热岛效应[ 20 ],导致城市上空形成热气流,积聚变稠,最终形成降水。这被称为城市雨岛效应,进一步加剧了城市洪水问题。
许多国家在世界上城市洪涝及其相关的问题,主要是城市排水和水污染[管理进行了一系列探索的21,22,23 ]。例如,美国颁布和修订了《清洁水法》、《水质法》和《联邦水控制法》,并逐步提出了最佳管理实践(BMPs)来处理 1940 年代至 80 年代的城市水污染问题[ 24,25 , 26 ]。1970 年代后期,瑞士启动了综合城市排水系统 (IUDS),以发展城市系统 [ 27 ]。低影响开发(LID)在 1990 年代逐渐实施 [ 28],旨在实现“自然”水文,即在专家开发和设计系统时,通过使用场地布局和综合控制措施,最大限度地减少对环境的影响 [ 29 ]。LID 在新西兰和北美普遍采用。可持续城市排水系统 (SUDS),在英国最常用,起源于 1990 年代 [ 30 ]。1992年,澳大利亚的Mouritz首先提出了水敏城市设计(WSUD)[ 31 ],然后在一份报告中提出给西澳大利亚政府,以减少城市发展对周围水文环境的不利影响[ 32]]。美国越来越多地采用绿色基础设施(GI)的概念,强调以实现多种生态效益,并进一步进入21世纪[后探索城市雨水管理多学科的综合应用33,34,35,36 ]。海绵城市最早是在2012年4月在中国深圳举行的“2012低碳城市发展与科技论坛”上提出的[ 37 ]。这意味着,一座像海绵一样设计的城市,在适应环境变化和应对暴雨引发的自然灾害方面具有良好的韧性[ 38 ]。
越来越多的关于城市洪水监测和预测模型的研究已经开展。监测数据作为实时模拟模型的输入,其重要性不言而喻,它不仅影响预测的准确性,而且是灾前预警的重要参考[ 39 ]。Khalid 和 Alias [ 40 ] 通过模型地理空间工具和数据库生成了一个 3D 城市,以监控洪水风险。基于视觉图像,Dhaya [ 41 ] 和 Zhao [ 42 ]] 分别使用卷积神经网络和深度神经网络算法来监测城市洪水。此外,城市水文过程模拟应尽可能接近实际情况,以尽量减少模拟和实测径流之间的差异,实现准确预测或其他目标[ 43 ]。考虑的因素的示例包括数字高程模型[ 44 ],不同的城市的表面[ 45,46 ],气象[ 47 ],和其他人(例如,液压的结构,土壤类型,沉淀)[ 48,49,50]。大量的研究人员专注于城市洪水的预测,其中一部分旨在提高模型的准确性。经常使用的方法是深度学习(例如,长短期记忆,人工或合奏神经网络)51,52,53 ],流体动力学模型[ 54 ],以及其他新提出的模型[ 50 ]。
2. 研究热点与前沿
2.1. 研究热点分析
关键词是论文的主题概括。论文中给出的关键词之间存在一些关联,可以用共现频率来表示。一般认为,两个关键词在同一个文档中出现的频率越高,两个主题之间的关系就越密切。文献中关键词的共词特征可以反映研究热点,共现频率决定了热点的强度。共词分析需要对同一组文献中一组词的出现频率进行统计,并通过共现案例的数量来衡量相近程度;通过统计主题词在同一文档中出现的频率,可以形成由这些词组成的共词网络。121 ]。
2.1.1. 关键词共现分析
关键词密度图和聚类图由VOSviewer根据2006-2020年的文献,共现频率设置20次以上生成。在图1的关键词密度图中,蓝色代表低密度,黄色代表低密度指高密度。黄色越深,密度越高;也就是说,共现频率越高。表 2显示前20个关键词的出现频率和总链接强度。研究人员从密度图中可以看出,研究热点主要集中在城市洪水、城市雨水、径流和气候变化方面,共现次数分别为541、469、424和386,代表本体论的研究和城市洪水技术是最流行的。与“城市洪水”、“城市雨水”相比,“气候变化”、“管理”、“城市化”、“模式”等其他热词的出现频率虽然较高,但与“城市洪涝”相比仍有一定差距。前者。这可能与本研究的研究课题有关,检索公式中直接包含“城市洪水”,还有“城市雨水”。值得注意的是,关键词“管理”的中心性最高,
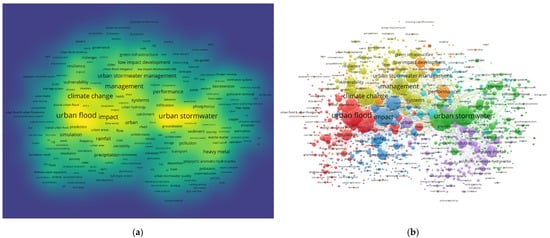
图1城市洪水领域共现关键词的密度和聚类图:(a)关键词密度图;( b ) 关键词聚类图。
表 2.前 20 个关键词的出现频率和总链接强度。
| 关键词 | 发生次数 | 总链接强度 | 关键词 | 发生次数 | 总链接强度 |
|---|---|---|---|---|---|
| 城市洪水 | 541 | 2124 | 表现 | 209 | 1351 |
| 城市雨水 | 469 | 2459 | 质量 | 200 | 1156 |
| 径流 | 424 | 2477 | 系统 | 192 | 1085 |
| 气候变化 | 386 | 2059 | 风险 | 181 | 846 |
| 模型 | 375 | 1726 | 重金属 | 177 | 966 |
| 影响 | 274 | 1983年 | 城市的 | 164 | 776 |
| 管理 | 351 | 1917年 | 模拟 | 164 | 829 |
| 城市化 | 271 | 1573 | 低影响发展 | 150 | 986 |
| 水 | 263 | 1361 | 雨量 | 149 | 701 |
| 城市雨水管理 | 225 | 1236 | 沉淀 | 139 | 559 |
In the keyword clustering map, different colors represent different clusters. The larger the nodes on the map, the more times keywords appear, indicating that their contribution to the urban floods field is greater. Closely related nodes are connected by lines, and the greater the link strength is, the stronger the internal relationship is. The node group is composed of many nodes.
As can be seen from Figure 1b, the clustering network is a complex co-occurrence relation, from which researchers detected seven main clusters that reflect the knowledge base for urban floods research. The red cluster, including one of the keywords as a retrieval theme, namely “urban flood”, formed the largest cluster and contained the most cited publications. In this cluster, models are used by researchers for numerical simulation on the issues of runoff. Besides, the hazards and risks of urban floods are also studied. The green cluster represented by “urban stormwater” and the purple one by “heavy metal” tend to focus on the pollution of urban stormwater. The keywords involved in these two clusters include “pollution”, “phosphorus”, “bioretention”, “pollutant removal”, “sediment”, “nitrogen removal”, and “Escherichia coli”. The yellow cluster reveals the research based on climate change and urban stormwater management in the urban floods field. On the one hand, with the change of global climate, cities’ vulnerability and resilience are studied [122,123]; on the other hand, a portion of researchers, with thoughts of the system, focus on urban stormwater management around green infrastructure and put forward policy suggestions from the perspective of the government. Climate change and urbanization are generally regarded as the two main causes of urban floods [124,125,126]. Aside from the climate change focus in the yellow cluster, other researchers emphasized urbanization and its impact, as in the dark blue cluster.
2.1.2. Co-Citation Analysis of Literature
Co-citation of references refers to the phenomenon in which two or more references are cited by the same document. The analysis of literature co-citation in CiteSpace reveals the theoretical knowledge foundation of relevant research by analyzing the high frequency of co-citation literature and the knowledge structure of a research field is revealed by analyzing the key nodes and clusters in the co-citation network [127]. The schematic of literature co-citation was obtained as shown in Figure 2. The nodes represent the cited literature, whose sizes denote the citation frequency. The color of the nodes depicts the citation time corresponding with the time bar above, and the labels on the nodes are the first author and publication year of the article.

Figure 2. Co-citation network of references.
The co-citation network in the urban floods field was composed of 978 nodes and 2725 connections. Fifteen key articles with important academic influence, corresponding to the largest 15 nodes in Figure 2, were selected in this study. As can be seen, only one article was published earlier than 2010, and had no direct connection with the other 14 articles, while the connection between the latter was very strong. Among the 15 articles, there were 9 reviews or summaries, indicating that reviews are relatively more often cited due to their nature in all article types.
Fletcher Tim et al. published “SUDS, LID, BMPs, WSUD and more—The evolution and application of terminology surrounding urban drainage” in Urban Water Journal in 2015, which ranks first in citation frequency [128]. As of 8 March 2021, this article has been co-cited 88 times. In this article, the history, application, and underlying principles of terms used in urban drainage were documented, such as low impact development (LID), water sensitive urban design (WSUD), and best management practices (BMPs), making it a summary classic. What ranks second is a review, named “Urban flood impact assessment: A state-of-the-art review”, published in 2015 by Hammond MJ et al., revealing the tangible and intangible damage of urban floods [129]. Burns Matthew et al. [130] systematically discussed the hydrologic shortcomings of conventional urban stormwater management by contrasting the hydrologic effects of two conventional approaches, namely drainage-efficiency-focused and pollutant-load-reduction-focused, and proposed a new approach, ranking third. Teng J. et al. [131] summarized the advantages and limitations of the flood inundation model. The article entitled “Performance and implementation of low impact development—A review” was published by Eckart Kyle et al. in Science of the Total Environment in 2017 [132]. This article provides a summary of the knowledge of low impact development (LID), as well as the current state of research. Palla Anna and Ilaria Gnecco [133] used a hydrologic model to confirm the effectiveness of LID solutions in several scenarios. Qin Huapeng et al. [134] analyzed the effects of three LID techniques, namely swales, permeable pavements, and green roofs, by simulation experiment. In 2013, the state of art regarding stormwater management was summarized by Fletcher Tim et al. [113], whose cited position ranks tenth, making it the only article that ranks not only in the top 10 of the total number of citations, but also in the top of co-cited articles. Ahiablame Laurent et al. [135] discussed and evaluated the effectiveness of low impact development practices by field and laboratory studies. In addition, Hunter et al. [136] compared the ability of six two-dimensional (2D) hydraulic models to simulate surface flows in a densely urbanized area through the simulation of a happened flood event.
2.2. Research Frontiers Analysis
The research frontier mainly discusses the emerging topics in a scientific field. It is a group of prominent concepts and potential research points. Many research frontiers may not only become research hotspots in the future under the tide of science and technology, but may also fade out of the research field after a short rise in a certain historical stage [137,138]. Therefore, timely identification of research frontiers in a specific field is bound to vigorously promote the development of this field. Research frontier, based on the latest academic work, refers to the collection of recently published and often cited literature in a scientific citation network from the perspective of scientometrics. Besides, concepts such as potential knowledge, emerging trends, and new research fields can also be classified as research frontiers.
In general, research frontiers represent the most advanced, innovative, and potentially important academic topics, which can be obtained from the highly cited collection of the latest literature in the scientific literature citation network. This study mainly analyzed the research frontier of the urban floods field according to the literature co-citation network relationship and drew the research frontier knowledge map of urban floods at the present stage through CiteSpace and VOSviewer, which can directly show the research frontier dynamics of the urban floods field evolving.
2.2.1. Overall Change Trend of Keywords
Research trend analysis is helpful to grasp the development of research and excavate the laws and driving forces behind the changes of research hotspots, providing direction for future research. The keywords are clustered and sorted according to time to obtain Figure 3.

Figure 3. Overlay visualization of keywords in VOSviewer.
In this figure, it should be noted that the color of nodes is determined by the average time of each keyword year, and the bluer the node is, the earlier the research year is, while the redder the node, the more recent the research year. Researchers found that researchers paid more attention to the problem of urban floods pollution before 2015. Then, the methods of model and numerical simulation were used to research urban stormwater management, low impact development, and so on. The current studies mainly consider cities and urban vulnerability and resilience under the background of climate change and urbanization.
2.2.2. Timeline Graph Analysis
The timeline graph clearly shows the historical research results, trends, and internal relationships of each cluster unit [139,140]. The keywords timeline analysis of the documents from 2006 to 2021 on urban floods was carried out by CiteSpace, whose slicing time and clustering algorithm were set as one year and LLR, respectively; the keywords appearing more than 55 times in each period were extracted and clustered. As shown in Figure 4, the horizontal axis is the time span and the vertical axis is the clustering partition. The size of the arc in the graph represents the span time of the keywords, and the number of nodes represents the internal connection degree of each keyword. In CiteSpace, different settings lead to different clustering results. Under the above settings, 48 clusters are generated. This study analyzed the first 12 clusters in order to receive acquaintance with the evolution laws of the keywords on the time axis.

Figure 4. A timeline view of keywords in CiteSpace.
The clusters with the longest duration are “urban flood”, “urban stormwater”, “urban stormwater management”, “particulate matters”, and “urban hydrology”, which existed throughout the whole study period. In addition, “best management practices”, “probability distribution”, and “diffuse pollution” existed only in the early stage of the study period, while the study of “groundwater” continued until the middle of the study period. The cross and time span between the clusters of “urban flood” and “urban stormwater” are the largest, which indicates that the relationship between them is the closest because they are the names that have been chosen for the overall field of research. In the cluster of “urban flood”, there is the largest number of bursting keywords.
2.2.3. Time Zone Chart Analysis of Keywords
The time zone graph reflects the evolution of knowledge based on the transmission relationship of research hotspots expressed by two-dimensional time location and links [93,141]. Figure 5 shows the time zone graph of keywords by frequency, from which researchers can find that most of the research topics in the field of urban floods, such as urban stormwater management, water quality, runoff, and so on, were carried out from 2006 to 2008. There was almost no major research hotspot in the field of urban floods research in the later stage. However, some new research focuses still exist from the relatively micro perspective. For example, urban floods risk was studied in 2011 and low impact development (LID) was adopted by a large number of scholars for research around 2014, while in 2018, the resilience of urban floods and cities became the research hotspot.

Figure 5. The evolution of subjects in the field of urban floods.
2.3. Comparative Analysis of Keywords Density Map
Researchers divided the research on the urban floods field into two stages according to the number of papers published each year. The first stage refers to the period from 2006 to 2015 and the second stage from 2016 to the present. Combined with the stage divisions, this study analyzed the changes of research hotspots in five years, that is, the first part referred to 2006–2010, the second to 2011–2015, and the third to 2016–2021. Finally, all published literature in the past three years was clustered by year, and the changes of research hotspots in each year were analyzed.
2.3.1. Comparison of Three Time Stages
The co-occurrence frequency of keywords was set to 5 times and the keywords hotspot maps of 2006–2010, 2011–2015, and 2016–2021, respectively, were obtained from VOSviewer. In Figure 6, the yellow areas indicate the research hotspots, and the more yellow the area is, the higher the co-occurrence frequency of keywords is.

Figure 6. The density maps of the three stages’ keywords: (a) 2006–2010; (b) 2011–2015; (c) 2016–present.
It can be seen from Figure 6, from the perspective of the number of keywords, the total number of articles published from 2006 to 2010 is the least; correspondingly, the number of keywords is the least, and the total frequency of 5 times or more is 109. The total number of published papers is the highest in 2016–2021, namely 723. From the perspective of research hotspots, the overall high-density areas in Figure 6a are relatively small, as well as scattered, indicating that the research focus in the early research stage of the urban floods field is low and the correlation between hot spots is not so strong compared to the latter. The number of research hotspots increased and the concentration became stronger in Figure 6b. In Figure 6c, the research focuses are further concentrated, which is shown in the expansion of yellow areas in the figure, and different yellow areas begin to overlap to form a new bigger yellow area. This is because more and more scholars have joined in the research of the urban floods field over time, and the number of published articles gradually increased, leading to the rise of keyword co-occurrence frequency.
From the perspective of research content, the research mainly focused on “urban stormwater” and “runoff” from 2006 to 2010, and the latter covered a wide range, including “urban runoff”, “road runoff”, “urban stormwater runoff”, etc. At the same time, water quality attracted a lot of attention, such as the keywords “sediment”, “water quality”, “waste water”, etc. From 2011 to 2015, in addition to the research topic “urban storm water” and “urban flood”, the importance of management began to attract attention. Scholars used more models for simulation research, and the pollution of urban stormwater was still a hot topic, such as the keywords “pollution”, “heavy metal”, and “water quality”. Between 2016 and 2021, the second stage of the research on the whole urban floods field, researchers found that the frequency of the keywords “climate change” and “urbanization” rose rapidly, becoming prevalent in this research period, representing that researchers in the field of urban floods had been paying more and more attention to global climate change and urbanization. Moreover, “urban stormwater management” and “low impact development” have become new research hotspots. In addition, the rapid development of “resilience” and “vulnerability” is also noteworthy.
2.3.2. Comparison of the Last Three Years
The top 10 keywords of co-occurrence frequency in 2019–2021 (as of 15 June 2021, the same applies to 2021 mentioned below) are similar to those in 2016–2021. Figure 7 shows that the top four keywords in 2019, 2020, and 2021 are all “urban flood”, “climate change”, “model”, and “impact”, while “urbanization” is likely to occupy the fifth place for a long time. Although the research on runoff is not as prevalent as that in the previous 10 years, there are still a large number of scholars studying it, which was indicated by the fact that the frequency of the keyword “runoff” in the past three years was 8, 10, and 7, respectively. Significantly, “Management”, which has been extensively studied from 2011 to 2015, still had a place in the recent three years, ranking 7, 6, and 12, respectively, in 2019, 2020, and 2021. It is worth noting that the published articles in 2021 show that the research popularity of “land use” and “SWMM (stormwater management model)” has increased sharply.
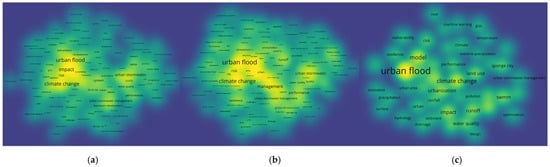
图 7.近三年关键词的密度图:( a )2019;( b ) 2020 年;( c ) 2021 年。
综上所述,研究人员可以根据现有文献数据推断,未来一定时期内,城市洪水研究将继续蓬勃发展,关键词数量将不断增加,研究重点将进一步扩大。在研究内容上,基于气候变化和城市化背景,利用SWMM等模型进行模拟研究,提出低影响发展和海绵城市的概念进行风险分析,探索城市洪水和优化甚至提出新的解决方案。同时,对洪水和城市的脆弱性和恢复力的研究也值得关注。
This entry is adapted from the peer-reviewed paper 10.3390/buildings11120628
This entry is offline, you can click here to edit this entry!