Your browser does not fully support modern features. Please upgrade for a smoother experience.
Please note this is an old version of this entry, which may differ significantly from the current revision.
The microchannel increases the permeability of flow both in the directions parallel and vertical to the microchannel direction. The microchannel plays as the highway for the pass of reactants while the rest of the smaller pore size provides higher resistance for better catalyst support, and the propagation path in the network with microchannels is more even and predictable.
- transport property
1. Introduction
The understanding of the structure–performance relationship of porous media and the optimization of the microstructure is the key to the improvement of its performance applied in various engineering applications involving gas diffusion layers, catalyst support layers, and capillary wicks. The transport property is strongly impacted by the pore phase morphology. Considering the application of fibrous porous material as catalyst support layers, a small pore size attributed to a larger specific surface area leads to an enhanced catalyst loading and reaction, while a larger pore size or specially processed structures, such as grooved microchannels, can provide a highway for flow so that the reactants can be removed in time. In a word, the presence of different pore sizes results in an ideal solution satisfying both properties dominated at different length scales. Nowadays, effects in developing such a multiscale, or in other words, a hierarchy structure for optimized engineered material, has gained considerable attention [1]. For example, P. Trogadas et al. [2] proposed lung-inspired fractal microchannel flow fields applied in polymer electrolyte fuel cells (PEFC) and outperformed the conventional serpentine flow field due to the more uniform reactant distribution. Alternatively, Y. Zhang et al. [3] achieved the desired uniformity in current density by tailoring the porosity variation in the gas diffusion layer (GDL) using a gradient configuration. Briefly, the microchannels [4,5,6] and pore structures [7,8,9,10] demonstrate significant influences on the mass transport properties and have been extensively explored.
These works further inspire the idea of the combination of microchannels and pore structures (Figure 1). Fabricating microchannels on porous structures was proposed [11,12,13] and applied in a methanol steam reforming (MSR) as catalyst support layers, and enhanced hydrogen production was obtained comparing the ones without microchannels. However, on the one hand, experimental measurements for obtaining physical properties could be hard to conduct due to a small pore size. On the other hand, numerical modeling is also difficult since the computational capacity is insufficient to handle a heterogeneous structure. Fortunately, we can apply pore networking as an alternate. Pore network modeling [14] is a kind of pore-scale model that accounts for the true geometrical heterogeneity but simplified geometrical details of the porous material at the pore scale. Despite the simplification, its validation is testified through a comparison with the Lattice Boltzmann method in our earlier efforts [15,16]. The pore network can be extracted from 3D images [17,18] using imaging processing, but the extraction process is nontrivial, let alone hierarchical materials with multi-scale structures. To this end, Sadeghi et al. [19] constructed a 2D regular lattice network consisting of nanopores and macropores were later added into it with its overlapping nanopores removed. This hierarchical pore network architecture was further extended to 3D cases by Moghaddam et al. [20] However, both of the pore networks [19,20] are constructed on regular 2D or 3D lattices, which deviates from the extracted ones in nature. Jiang et al. [21] proposed an approach to generate from an extracted network a stochastic network of arbitrary size. Pores were randomly located in the given network domain and connected by throats according to their correlations. The flow properties involving capillary pressure, absolute and relative permeability were preserved in the stochastic network.
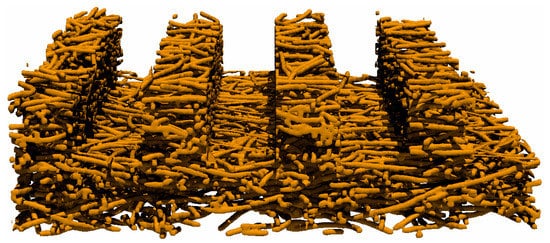
Figure 1. Illustration of a combination of straight line microchannels above the fibrous porous structure.
2. Validation of Stochastic Network
The stochastic network is validated by assessing if its structural and transport properties of the same size as the original one are faithfully reproduced. The distributions of pore radius, throat radius, and equivalent radius are almost identical to the original ones. The distribution of the coordination number and the correlation between pore radius and coordination number also match the original data well, despite some coordination discord occurring in the throat generation process.
The dimensionless permeability (permeability divided by the square of fiber radius, Figure 9) and the capillary pressure curve (Figure 10) were compared in the in-plane direction. The permeability value is obtained using Darcy’s law with the pressure of each pore in the network obtained according to mass conservation. For implementation details, readers can refer to [14]. Figure 9 shows that the stochastic permeability values tend to be underestimated as the porosity increases, compared to the original ones. Anyhow, the predicted permeabilities of different porosities are quite distinct, the deviations of porosities less than 80% are acceptable, and the deviation from the original results will not affect the following discussion of the effect of microchannel on the flow properties for a certain porosity.
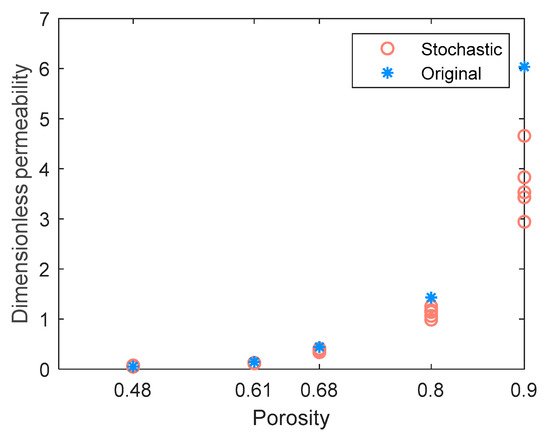
Figure 9. Dimensionless permeabilities in the in-plane direction of the original network and stochastic realizations. Five stochastic realizations are generated for each porosity.
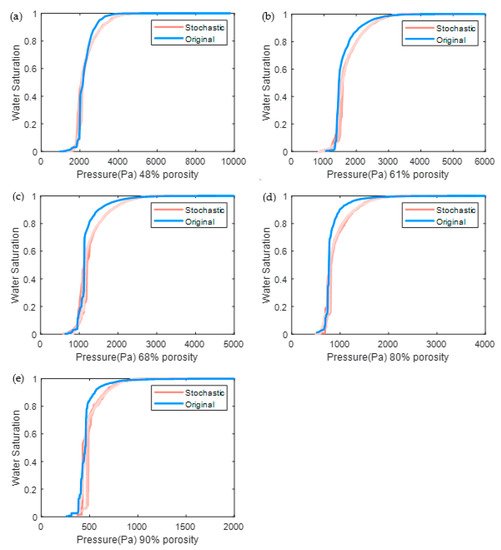
Figure 10. Capillary pressure curves of the original and stochastic pore network. Five stochastic realizations are generated for each porosity (a) 48%, (b) 61%, (c) 68%, (d) 80%, and (e) 90%.
3. Impact of Microchannel on the Transport Property
3.1. Throat Radius–Saturation Relationship
Figure 11 illustrates the capillary pressure curves with and without microchannels. In the model, the straight microchannels are arranged along the y-axis, and the flow both along the x-axis and y-axis is predicted. In Figure 11a that the curves of the model without microchannels (so-called no-channel) in the x- and y-axis directions are quite identical. The steep region of the curve indicates the rapid propagation of the invasion fluid and occurs at the throat area-equivalent radius of about 200 μm. It indicates that a large portion of the void phase is dominated by pores connected by at least one throat of an area equivalent radius higher than 200 μm and can be invaded and completely connected from the inlet surface.
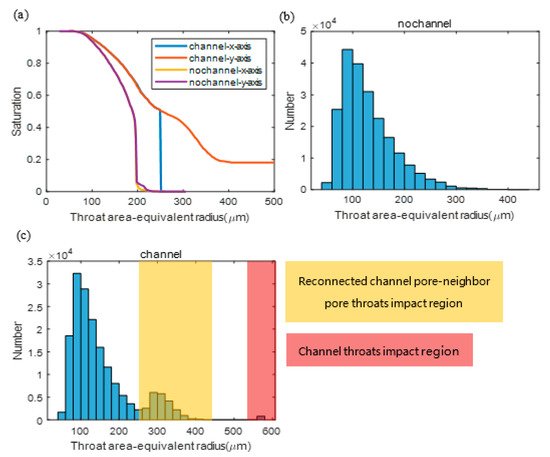
Figure 11. (a) Throat area-equivalent radius and saturation relationship curves, and throat area-equivalent radius distributions of pore network without (b) and with (c) microchannels.
The curves of the micro-channeled network show different shapes. Compared with Figure 11b, two distinct areas in Figure 11c can be found. These two highlighted regions are impacted by the throats affected by the added channel pores. These added throats can be categorized as the channel throats of an area-equivalent radius of around 600 μm and the reconnected channel pore to its neighboring pore throats of an area-equivalent radius between about 250 μm to 400 μm (the minimal area-equivalent radius of the reconnected throat is larger than 250 μm as assumed in the channel modeling). Considering the throat radius distribution, the behavior of the curves in Figure 11a can be explained. The flow in the channeled network in the x-axis direction (vertical to the y-axis channel direction) shows a sharp increase of saturation from almost 0% to 50% at about 250 μm throat area-equivalent radius. It is in agreement with the reconnected throats region in Figure 11c, since the flow rapidly propagates most of the void space when the capillary pressure is high enough to pass the reconnected throats (250~400 μm radius) and when the channel throats involved in the network are completely connected to the inlet surface. It is a sharp increase since once the invading fluid reaches the first microchannel in the depth of the propagation direction, the pressure currently is high enough to push the fluid to all of the microchannels, involving the micropores in the fluid paths between the microchannels, which takes about 50% of the void space.
3.2. Relative Permeability
Figure 12 illustrates the drainage relative permeability of the water transport with and without microchannels.
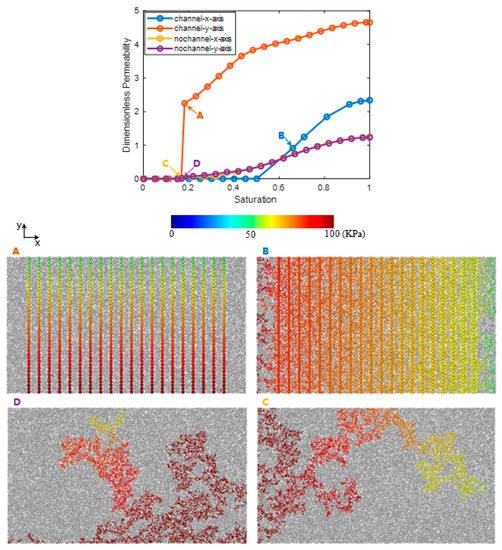
Figure 12. Drainage relative permeability curves and 4 chosen pressure fields (A–D) in pore networks with (A,B) and without (C,D) microchannels.
Figure 12A shows the breakthrough moment of the flow with microchannels in the y-axis direction. The microchannels provide the highways for fluid to pass through and result in a sharp increase of the permeability curve. After the breakthrough moment, the remaining uninvaded pores of smaller pore sizes and larger flow resistance beside the microchannels will be gradually invaded as the pressure gradient increases. Therefore, the microchannel can provide the highway for the flow path of the reactant, while the rest of the network with pore sizes less than one or several orders of magnitude provide a higher flow resistance and a higher specific surface, and contribute to better support for reaction. In a word, the coupling of multiscale structures results in an ideal multiscale system for the multifunction purpose.
Figure 12B shows the flow path and the pressure distribution of the channeled flow in the x-axis direction, which is vertical to the channel arrangement orientation. Compared with Figure 10C,D, and the dimensionless permeability curves, the occurrence of the breakthrough saturation moment is postponed due to the microchannels, and the fluid is more evenly distributed than without microchannels, since each channel along the flow direction provide a new equal start for the water penetration, and finally promote the absolute permeability compared to the scenario without microchannels.
This entry is adapted from the peer-reviewed paper 10.3390/ma14247546
This entry is offline, you can click here to edit this entry!
