Your browser does not fully support modern features. Please upgrade for a smoother experience.
Please note this is an old version of this entry, which may differ significantly from the current revision.
Subjects:
Health Care Sciences & Services
Fall risk assessment is a complicated process based on detection and analysis of factors leading to falls. Sensor-based fall risk assessment is a promising technology which uses sensors to assess risk of falls by analyzing factors like gait characteristics.
- fall risk assessment
- fall prediction
- gait monitoring
- sensor
1. Introduction
Aging population has become a common problem for major countries in the world. Compared with young people, falls are more likely to occur in the elderly. In some countries, such as the United States, falls have become a leading cause of death due to injuries in people over 65 [1]. In addition to physical damage, the elderly people with a history of falls may have greater psychological stress and a narrow scope of daily living activities, resulting in worse quality of life. Furthermore, the resulting personal and social expenditure is a large amount. Therefore, reducing the incidence of falls in the elderly is a matter of great significance. Fall risk assessment is one of the emerging promising technologies for the above goal.
In our opinion, “fall risk” refers to whether a person is prone to falling. This is how most work defines “fall risk” in our reviewed articles. They analyzed the relationship between gait characteristics and fall risk in combination with fall history in the past or fall status in the future. The items “fall detection” and “fall prediction” (fall risk assessment) are often confused. They are protective measures from different perspectives. Fall detection aims at detecting the occurrence of fall event in time so that treatment or protection during fall (e.g., air cells at waist) can be carried out right away. It is an “afterwards approach”. Unlike fall detection, fall risk assessment is a “beforehand approach”. It tries to identify elderly people at high fall risk. Then targeted preventive measures can be taken before the “real fall” happens. This kind of technology has a remarkable social and economic worth. It has received growing attention due to the great progress of sensing, communication and data processing technologies in recent years.
Fall risk assessment is a complicated process based on detection and analysis of factors leading to falls. There are many factors leading to falls, and they have been divided into two categories: external and internal [2]. External factors refer to environmental factors such as room layout, road conditions, to name but a few. Existing studies focus more on internal factors. Internal factors refer to self status, including physical, cognitive and psychological. Older age has been shown to be related to falls, because aging can lead to instability in walking posture [3]. Sarcopenia is a syndrome highly relevant to falls [4]. It is a condition characterized by decreased muscle mass, muscle strength and physical performance. Sensory disturbance is another important factor related to falls [5], such as visual impairment and hearing impairment. In addition, medication, stroke, depression and postural hypotension are also internal factors. According to reviewed papers, there are scale-based and sensor-based approaches to detect and analyze internal factors.
The fall risk scale is an important tool in fall risk assessment. Scale-based assessment is suitable for most internal factors. Researchers fill out the scale through inquiry, observation and measurement. There are many scales for fall risk assessment. The most commonly used are the Berg Balance Scale [6], Tinetti Balance Scale [7], STRATIFY [8], and so on. Different scales are suitable for different situations. For example, STRATIFY was used only for elderly hospitalized patients [9]. Several reviews about scale-based fall risk assessment have been published over the years. A systematic review in 2018 by Park [9] paid attention to the quantitative analysis of the predictive validity of scales. The author pointed out that combining two assessment tools was more effective than using a single tool due to more factors were contained. Another review in 2018 by Ruggieri and colleagues [10] focused entirely on the setting, language, pathology and psychometric properties of scales. Together these papers have provided a comprehensive overview on the scales used in fall risk assessment.
2. Fall Risk Monitoring
A wide range of sensors, including inertial sensors like accelerometers and gyroscopes, pressure sensors, and infrared sensors, to name but a few, are used in fall risk assessment. These various sensors have different types, functions, output signals, and technical principles. They can be classified as wearable sensors and non-wearable sensors according to the way they are deployed. Wearable sensors are the most commonly used. In the following we present the common practice in sensor-based fall risk assessment.
2.1. Wearable Sensors
Wearable sensors are sensors which are directly or indirectly fixed to human body, and they generate signals when the user moves or performs other activities. Wearable sensors can be embedded into daily objects like belts and shoes or directly fixed to the body. They can monitor movement status or physiological information when properly worn by users.
Inertial sensors and pressure sensors are the most frequently used wearable sensors in fall risk assessment. Inertial sensors mainly include accelerometers and gyroscopes. They are suitable for monitoring body motions. In Figure 1, we show a graphic example of leg flexion and extension angle during walking, which was obtained in our real application. Generally, inertial sensors are fixed to different body parts to obtain different motion features and pressure sensors are embedded into insoles. Howcroft et al. [11] placed tri-axial accelerometers on head, lower back and left and right shanks of older individuals under single-task and dual-task conditions to identify the optimal sensor combination, placement and modeling approaches for fall risk assessment. In addition, participants were required to wear pressure-sensing insoles. Accelerometer-based features used in this study were maximum, mean, and standard deviation of acceleration for different axes, cadence, stride time, fast Fourier transform (FFT) Quartile, ratio of even to odd harmonics (REOH), and maximum Lyapunov exponent (MLE). For pressure-sensing insoles, they derived features like center of pressure (CoP) path, temporal features such as stride time symmetry index between left and right limbs and impulse from the total force-time curve. The results indicated that multi-layer perceptron had a better performance than naïve Bayesian and support vector machine. In single-task fall risk classification, head sensor-based models had the best performance. Accelerometers were placed on lower limb (ankle, shank, etc.) to obtain spatiotemporal gait features like gait speed [11][12]. Doheny et al. [13] used tri-axial accelerometers on the thigh to record the process from sitting to standing during the five-times-sit-to-stand test. Weiss et al. [14] asked 107 Parkinson’s patients to fix a small three-axis accelerometer to the lower back for three days respectively. Their walking quantity and quality were determined. Pressure sensors are effective for recording the changes in the plantar pressure of the human body during walking. It is an ideal assessment tool for postural stability. The study in [15] assessed fall risk of workers in the construction industry by changes of biomechanical gait stability features based on wearable insoles with pressure sensors. According to these reviewed articles, accelerometers are the most frequently used and practical wearable sensor category.
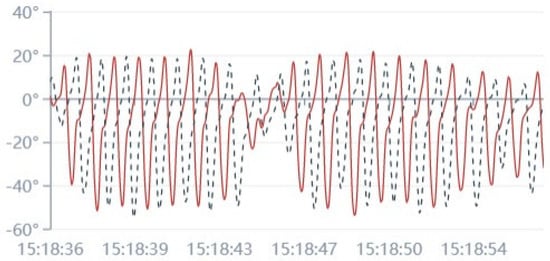
Figure 1. The angle curve of leg flexion and extension in the vertical direction during walking. The red line represents the left leg, and the black dotted line represents the right leg.
The human walking process can be regarded as several consecutive repetitive gait cycles. Generally, a gait cycle refers to the process of walking from the same foot’s toe-off/heel-strike to the next toe-off/heel-strike. A gait cycle can also be divided into a swing phase and a stance phase. This means that each cycle can be recognized by detecting the flag events like heel-strike in the gait process, the gait motion can be segmented, and the features can be further extracted. Take a gait cycle of the right foot as an example. The time from the first toe off (right Toe-Off) to the first heel landing on the ground (right Heel-Strike) is the swing phase of the right foot. Then the right foot supports the weight, and the left foot enters the swing phase. It is the stance phase of the right foot until the next right Toe-Off. To detect the flag gait events, peak detection algorithms are useful [16][17]. They achieve this function by detecting repeated peaks of acceleration or angular velocity during gait.
Kinematic data of the human body is useful for knowing about gait status and fall risk assessment. It is usually obtained by inertial sensors. However, there are some types of errors in practice, which makes it challenging to obtain accurate motion information. The mounting error is an important error in applications of inertial sensors due to the misalignment from the inertial frame (sensor coordinate frame) and the global frame (body frame). Chen et al. [16] proposed a method for mounting error calibration. The method can determine the orientation of inertial frame with respect to the global frame. The results showed that it corrected the mounting error greatly. The integration drift is another kind of common errors in practice of inertial sensors. It comes from the accumulated signal noise in the process of integrating acceleration into velocity or angular velocity into angular displacement. Filters like Butterworth filter [18], Kalman filter [19] are usually used to eliminate the integration drift.
2.2. Non-Wearable Sensors
Pressure sensors can be either wearable or non-wearable. In addition to embedding to insoles or shoes, pressure sensors also can be used in treadmill or pressure platform like Wii balance board [20].
Infrared sensors and laser sensors are the most frequently used ones of non-wearable sensors. Nishiguchi et al. [21] developed a device that was based on an infrared laser sensor (laser range finder) to assess stepping performance. Further a new index “stepping response score” was created to assess fall risk of community-dwelling elderly individuals. The infrared laser sensor in this research was used to measure spatial and temporal parameters of steps by detecting position and motion of both legs.
Microsoft Kinect is often used in gait analysis and further for fall prevention. It consists of RGB cameras and infrared sensitive cameras and can produce depth images. Dubois et al. [22] proposed a system based on Microsoft Kinect camera to help preventing falls of the elderly people. They extracted three gait spatiotemporal features from the vertical displacement of the center of mass of the subject. The features are step length, step duration and gait speed. The features were compared to those obtained by the carpet. The results showed that their approach of gait analysis was effective. However, they did not further use this approach for fall risk assessment. Stone et al. [23] compared gait measurements by Kinect to those using a web-camera based system and those from a Vicon motion capture system. The results showed good agreements among them and confirmed the effectiveness of Kinect for passive fall risk assessment.
Infrared or laser sensors have the advantage of being precise. However, they suffer from many other issues. For example, the clothes worn by the subjects may affect the reflection of infrared rays, and multiple devices may be required due to limited field of view of sensors. This will raise the cost. Moreover, it usually requires participants to walk within a limited area which it can see. Compared to this kind of sensor, wearable sensors are cheaper and easier to deploy. Furthermore, wearable sensors are more flexible whether they are directly secured on body or embedded in clothes. Nevertheless, wearable sensor-based fall risk assessment still suffers from issues like size, battery, and data transmission, to name but a few.
In the procedure of fall risk assessment, participants will be required to do assessment tasks. The most commonly used one is steady walking on the treadmill or ground. In addition, the Timed Up and Go (TUG) test [24] is often combined with sensors to assess fall risk. It measures the time it takes for the elderly to stand up and walk and then come back and sit down. The traditional TUG test is single-task. Research has found that the dual-task test results are better [25]. The five-times-sit-to-stand test (FTSS) is another test used for assessing fall risk. The time to finish this test is measured to indicate fall risk [13].
3. Sensor-Based Features for Fall Risk Characterization
In sensor-based fall risk assessment, features are extracted from sensor signals to quantify one’s gait or posture characteristics. For most studies, it is necessary to identify each gait cycle by algorithms. Then the measurement values are calculated for each step. For instance, the gait speed of each step can be obtained by integrating the acceleration value obtained from accelerometers. Our survey do not focus on algorithms for identifying gait cycles or raw signals from sensors but concentrates on features extracted finally. In the following we summarize the common features according to their described gait characteristics.
3.1. Gait Intensity
Number of steps in a period is often used to reflect whether the participant is vigorous over a period of time. Cadence is the value of the number of steps divided by walking time. It reflects the intensity of gait. Too low or too high cadence during walking indicates abnormal gait patterns. Too low cadence may be related to freezing gait, and too high cadence may be related to festinating gait. These two abnormal gait patterns have been identified as highly correlated to fall incidents [26][27].
3.2. Gait Variability
Time-related features are useful in fall risk assessment. They include step time, stride time, stance time, and swing time during walking, single support time, double support time and so forth. Gait variability refers to the fluctuation in the value of a feature from one step to another [28]. These time-related features can quantify gait variability by computing average variance or standard deviation or coefficient of variation of them [29]. Hausdorff et al. [30] used the standard deviation of each participant’s stride time and swing time to quantify gait variability. They placed force-sensitive insoles in participants’ shoes to identify each stride. Then those required time-related features are determined for each stride by algorithms. The gait variability was further quantified by calculating the standard deviation of those features. The results showed that these two measures of gait variability were predictive of future falls, and the possibility of falling is positively correlated with the degree of gait variability. Generally, higher variability of gait means higher fall risk [31]. In addition to time-related features, trunk acceleration is also suitable for quantifying the variability of human gait [32]. The authors in [32] used standard deviation of trunk acceleration to measure gait variability under inclined conditions.
3.3. Gait Stability
Stability of gait is another important indicator for assessing fall risk. Gait stability is close to gait variability but not equal to it. Gait stability refers to the ability of maintaining gait stable when walking under small perturbations or recovering from an external perturbation. Hollman et al. [33] used variability of velocity from stride to stride to quantify gait stability. GAITRite is responsible for measuring the spatiotemporal parameters required for this study. The study was to examine whether gait stability differ in older adults compared with young adults during normal walking and walking while performing cognitive tasks. The results indicated that variability of velocity from stride to stride was greater during dual task walking, and dual task walking had a larger impact on the older adults than young adults. Therefore, walking with cognitive tasks may increase the gait instability and risk of falls. In addition to linear statistics, non-linear measures like maximum Lyapunov exponent (λs) are also used in stability assessment [32]. Local dynamic stability (LDS) is based on λs, which can be calculated by Rosenstein’s algorithm [34]. LDS is a nonlinear parameter which is derived from dynamic system theory to assess gait stability. There is a negative correlation between LDS and maximum Lyapunov exponent. When λs increases, LDS decreases and fall risk increases.
3.4. Postural Stability
Postural stability refers to the ability of maintaining body stable when standing. Melzer et al. [35] measured the postural stability of subjects in wide stance and narrow stance to find differences between fallers and non-fallers. The features were based on center of pressure (COP), which included COP path length, elliptical area, COP velocity, medio-lateral (ML) sway length, and antero-posterior sway length. The results indicated that there were no significant differences between two groups when standing in wide stance. Significant differences emerged when subjects standing in narrow stance. Fallers had significant higher values of COP path length, elliptical area, COP velocity, and ML sway length in various conditions which included eyes open, eyes closed, and eyes open while standing on the foam.
3.5. Gait Symmetry
Gait symmetry reflects the control of the lower limbs on both sides during walking. Jiang et al. [36] pointed out that gait symmetry as well as gait stability is important for fall risk assessment. There are four frequently used methods to measure gait symmetry, namely symmetry ratio, symmetry index, gait asymmetry, and symmetry angle [37]. Symmetry ratio index has been used in clinical measurement of gait symmetry but has a low sensitivity [38]. The symmetry index is a symmetry evaluation standard based on ground reaction forces proposed by Robinson et al. [39]. Gait asymmetry is a logarithmic transform of symmetry ratio. In [40], the authors evaluated the degree of asymmetry by comparing the swing time of the legs on both sides. Symmetry angle was proposed by Zifchock et al. [41]. Zifchock certified that symmetry angle is highly correlated with symmetry index. This suggest that symmetry angle may be a good substitute for symmetry index.
Among these four measures, there is no recognized standard for assessing gait symmetry. Patterson et al. [37] analyzed and compared these four measures for stroke patients and normal people. Stroke patients were at high risk of falls. They used five features including step length, swing time, stance time, double support time and ratio of swing time to stance time in the above four equations respectively. Analysis results suggested that no equation performed better in distinguishing stroke patients. On the contrary, different gait features have a more significant impact on the results. However, symmetry ratio may be more interpretable than the others. Therefore, the authors recommended symmetry ratio as a candidate standardization.
3.6. Gait Smoothness
Gait smoothness is associated with the quality of walking control. It reflects the continuousness of walking. It is usually measured by harmonic ratio. Harmonic ratio is a frequency feature in fall risk assessment. It is the ratio between the sum of the magnitudes of the even to the odd harmonics over a single stride. A higher value of harmonic ratio indicates smoother gait when walking. Parkinson’s patients and stroke patients usually perform poorly in smoothness. Low smoothness may lead to falls. Doi et al. [42] used harmonic ratio of trunk acceleration to predict falls of elderly based on prospective research method. In this study, researchers calculated the harmonic ratio of acceleration of upper and lower trunk by digital Fourier transformation in each direction. The results indicated that the harmonic ratio of upper trunk acceleration was independently associated with incidence of falls in a year. It was confirmed by ROC curve analysis that the harmonic ratio of upper trunk acceleration had high specificity for predicting potential future falls.
This entry is adapted from the peer-reviewed paper 10.3390/healthcare9111448
References
- Bergen, G.; Stevens, M.R.; Burns, E.R. Falls and fall injuries among adults aged ≥ 65 years—United States, 2014. Morb. Mortal. Wkly. Rep. 2016, 65, 993–998.
- King, M.B.; Tinetti, M.E. Falls in community-dwelling older persons. J. Am. Geriatr. Soc. 1995, 43, 1146–1154.
- Delbaere, K.; Close, J.C.; Heim, J.; Sachdev, P.S.; Brodaty, H.; Slavin, M.J.; Kochan, N.A.; Lord, S.R. A multifactorial approach to understanding fall risk in older people. J. Am. Geriatr. Soc. 2010, 58, 1679–1685.
- Landi, F.; Liperoti, R.; Russo, A.; Giovannini, S.; Tosato, M.; Capoluongo, E.; Bernabei, R.; Onder, G. Sarcopenia as a risk factor for falls in elderly individuals: Results from the ilSIRENTE study. Clin. Nutr. 2012, 31, 652–658.
- Pfortmueller, C.A.; Kunz, M.; Lindner, G.; Zisakis, A.; Puig, S.; Exadaktylos, A.K. Fall-related emergency department admission: Fall environment and settings and related injury patterns in 6357 patients with special emphasis on the elderly. Sci. World J. 2014.
- Santos, G.M.; Souza, A.; Virtuoso, J.F.; Tavares, G.; Mazo, G.Z. Predictive values at risk of falling in physically active and no active elderly with Berg Balance Scale. Braz. J. Phys. Ther. 2011, 15, 95–101.
- Raîche, M.; Hébert, R.; Prince, F.; Corriveau, H. Screening older adults at risk of falling with the Tinetti balance scale. Lancet 2000, 356, 1001–1002.
- Oliver, D.; Britton, M.; Seed, P.; Martin, F.; Hopper, A. Development and evaluation of evidence based risk assessment tool (STRATIFY) to predict which elderly inpatients will fall: Case-control and cohort studies. BMJ 1997, 315, 1049–1053.
- Park, S.H. Tools for assessing fall risk in the elderly: A systematic review and meta-analysis. Aging Clin. Exp. Res. 2018, 30, 1–16.
- Ruggieri, M.; Palmisano, B.; Fratocchi, G.; Santilli, V.; Mollica, R.; Berardi, A.; Galeoto, G. Validated fall risk assessment tools for use with older adults: A systematic review. Phys. Occup. Ther. Geriatr. 2018, 36, 331–353.
- Howcroft, J.; Lemaire, E.D.; Kofman, J. Wearable-sensor-based classification models of faller status in older adults. PLoS ONE 2016, 11, e0153240.
- Howcroft, J.; Kofman, J.; Lemaire, E.D. Prospective fall-risk prediction models for older adults based on wearable sensors. IEEE Trans. Neural Syst. Rehabil. Eng. 2017, 25, 1812–1820.
- Doheny, E.P.; Walsh, C.; Foran, T.; Greene, B.R.; Fan, C.W.; Cunningham, C.; Kenny, R.A. Falls classification using tri-axial accelerometers during the five-times-sit-to-stand test. Gait Posture 2013, 38, 1021–1025.
- Weiss, A.; Herman, T.; Giladi, N.; Hausdorff, J.M. Objective assessment of fall risk in Parkinson’s disease using a body-fixed sensor worn for 3 days. PLoS ONE 2014, 9, e96675.
- Antwi-Afari, M.F.; Li, H. Fall risk assessment of construction workers based on biomechanical gait stability parameters using wearable insole pressure system. Adv. Eng. Inform. 2018, 38, 683–694.
- Chen, S.; Cunningham, C.L.; Lach, J.; Bennett, B.C. Extracting spatio-temporal information from inertial body sensor networks for gait speed estimation. In Proceedings of the 2011 International Conference on Body Sensor Networks, Dallas, TX, USA, 23–25 May 2011; pp. 71–76.
- Jiang, S.; Wang, X.; Kyrarini, M.; Gräser, A. A robust algorithm for gait cycle segmentation. In Proceedings of the 2017 25th european signal processing conference (eusipco), Kos Island, Greece, 28 August–2 September 2017; pp. 31–35.
- Takeda, R.; Lisco, G.; Fujisawa, T.; Gastaldi, L.; Tohyama, H.; Tadano, S. Drift removal for improving the accuracy of gait parameters using wearable sensor systems. Sensors 2014, 14, 23230–23247.
- Roetenberg, D.; Slycke, P.J.; Veltink, P.H. Ambulatory position and orientation tracking fusing magnetic and inertial sensing. IEEE Trans. Biomed. Eng. 2007, 54, 883–890.
- Kwok, B.-C.; Clark, R.A.; Pua, Y.-H. Novel use of the Wii Balance Board to prospectively predict falls in community-dwelling older adults. Clin. Biomech. 2015, 30, 481–484.
- Nishiguchi, S.; Yamada, M.; Uemura, K.; Matsumura, T.; Takahashi, M.; Moriguchi, T.; Aoyama, T. A novel infrared laser device that measures multilateral parameters of stepping performance for assessment of all risk in elderly individuals. Aging Clin. Exp. Res. 2013, 25, 311–316.
- Dubois, A.; Charpillet, F. A gait analysis method based on a depth camera for fall prevention. In Proceedings of the 2014 36th Annual International Conference of the IEEE Engineering in Medicine and Biology Society, Chicago, IL, USA, 26–30 August 2014; pp. 4515–4518.
- Stone, E.E.; Skubic, M. Evaluation of an inexpensive depth camera for passive in-home fall risk assessment. In Proceedings of the 2011 5th International Conference on Pervasive Computing Technologies for Healthcare (PervasiveHealth) and Workshops, Washington, DC, USA, 23–25 May 2011; pp. 71–77.
- Alexandre, T.S.; Meira, D.M.; Rico, N.C.; Mizuta, S.K. Accuracy of Timed Up and Go Test for screening risk of falls among community-dwelling elderly. Braz. J. Phys. Ther. 2012, 16, 381–388.
- Yamada, M.; Aoyama, T.; Arai, H.; Nagai, K.; Tanaka, B.; Uemura, K.; Mori, S.; Ichihashi, N. Dual-task walk is a reliable predictor of falls in robust elderly adults. J. Am. Geriatr. Soc. 2011, 59, 163–164.
- Okuma, Y. Freezing of gait and falls in Parkinson’s disease. J. Parkinson’s Dis. 2014, 4, 255–260.
- Baker, J.M. Gait disorders. Am. J. Med. 2018, 131, 602–607.
- Callisaya, M.L.; Blizzard, L.; Schmidt, M.D.; McGinley, J.L.; Srikanth, V.K. Ageing and gait variability—A population-based study of older people. Age Ageing 2010, 39, 191–197.
- Brodie, M.A.; Coppens, M.J.; Ejupi, A.; Gschwind, Y.J.; Annegarn, J.; Schoene, D.; Wieching, R.; Lord, S.R.; Delbaere, K. Comparison between clinical gait and daily-life gait assessments of fall risk in older people. Geriatr. Gerontol. Int. 2017, 17, 2274–2282.
- Hausdorff, J.M.; Rios, D.A.; Edelberg, H.K. Gait variability and fall risk in community-living older adults: A 1-year prospective study. Arch. Phys. Med. Rehabil. 2001, 82, 1050–1056.
- Brach, J.S.; Berlin, J.E.; VanSwearingen, J.M.; Newman, A.B.; Studenski, S.A. Too much or too little step width variability is associated with a fall history in older persons who walk at or near normal gait speed. J. Neuroeng. Rehabil. 2005, 2, 1–8.
- Vieira, M.F.; Rodrigues, F.B.; e Souza, G.S.d.S.; Magnani, R.M.; Lehnen, G.C.; Campos, N.G.; Andrade, A.O. Gait stability, variability and complexity on inclined surfaces. J. Biomech. 2017, 54, 73–79.
- Hollman, J.H.; Kovash, F.M.; Kubik, J.J.; Linbo, R.A. Age-related differences in spatiotemporal markers of gait stability during dual task walking. Gait Posture 2007, 26, 113–119.
- Rosenstein, M.T.; Collins, J.J.; De Luca, C.J. A practical method for calculating largest Lyapunov exponents from small data sets. Phys. D Nonlinear Phenom. 1993, 65, 117–134.
- Melzer, I.; Benjuya, N.; Kaplanski, J. Postural stability in the elderly: A comparison between fallers and non-fallers. Age Ageing 2004, 33, 602–607.
- Jiang, S.; Zhang, B.; Wei, D. The elderly fall risk assessment and prediction based on gait analysis. In Proceedings of the 2011 IEEE 11th international conference on computer and information technology, Washington, DC, USA, 28 August–2 September 2011; pp. 176–180.
- Patterson, K.K.; Gage, W.H.; Brooks, D.; Black, S.E.; McIlroy, W.E. Evaluation of gait symmetry after stroke: A comparison of current methods and recommendations for standardization. Gait Posture 2010, 31, 241–246.
- Sadeghi, H.; Allard, P.; Prince, F.; Labelle, H. Symmetry and limb dominance in able-bodied gait: A review. Gait Posture 2000, 12, 34–45.
- Robinson, R.; Herzog, W.; Nigg, B.M. Use of force platform variables to quantify the effects of chiropractic manipulation on gait symmetry. J. Manip. Physiol. Ther. 1987, 10, 172–176.
- Błażkiewicz, M.; Wiszomirska, I.; Wit, A. Comparison of four methods of calculating the symmetry of spatial-temporal parameters of gait. Acta Bioeng. Biomech. 2014, 16, 29–35.
- Zifchock, R.A.; Davis, I.; Higginson, J.; Royer, T. The symmetry angle: A novel, robust method of quantifying asymmetry. Gait Posture 2008, 27, 622–627.
- Doi, T.; Hirata, S.; Ono, R.; Tsutsumimoto, K.; Misu, S.; Ando, H. The harmonic ratio of trunk acceleration predicts falling among older people: Results of a 1-year prospective study. J. Neuroeng. Rehabil. 2013, 10, 1–6.
This entry is offline, you can click here to edit this entry!