Your browser does not fully support modern features. Please upgrade for a smoother experience.
Please note this is an old version of this entry, which may differ significantly from the current revision.
Subjects:
Pediatrics
Liquid chromatography-tandem mass spectrometry (LC-MS/MS) has already been used in many clinical laboratories for a broad range of clinical tests, such as therapeutic drug monitoring (TDM) and the analysis of hormones and vitamins, as well as organic acid analysis.
- Methylmalonic acid
- organic acidemias
- Automated LC-MS/MS
1. Introduction
Newborn screening tests are performed for the early detection of inborn errors in metabolism. Amino acids and acylcarnitines are analyzed in dried blood spot samples, collected from newborns at approximately five days after birth, to determine whether the genes encoding metabolic enzymes are defective [1][2][3]. Newborn screening tests are capable of detecting amino acid and fatty acid disorders; however, they are insufficient to distinguish organic acid disorders. Therefore, additional analyses are required to detect urinary organic acids. Gas chromatography-mass spectrometry (GC-MS) has been widely used to measure more than a hundred kinds of organic acids in urine samples, providing a diagnostic basis for organic acid disorders [4][5][6]. However, GC-MS requires complex sample pretreatment, such as the extraction of organic acids from biological samples, drying of extracted solvents, and reaction with derivatizing reagents, which makes it difficult to operate on a daily basis in a clinical laboratory. It takes more than a week to obtain the test results in Japan, since newborn screenings and organic acid analyses are performed in a limited number of facilities. Organic acid analysis is urgently needed because organic acid disorders cause acute symptoms and prove to be fatal [7][8][9]. Therefore, clinical laboratories require methods to analyze organic acids in a simple, quick, and automated manner while requiring as little human effort as possible.
Liquid chromatography-tandem mass spectrometry (LC-MS/MS) has already been used in many clinical laboratories for a broad range of clinical tests, such as therapeutic drug monitoring (TDM) [10][11] and the analysis of hormones [12][13] and vitamins [14][15], as well as organic acid analysis. However, there is an increasing demand for the employment of LC-MS/MS systems in clinical laboratories for diagnostic purposes. Therefore, the development of an automated system for LC-MS/MS analysis and the pretreatment of clinical samples is warranted.
2. Discussion
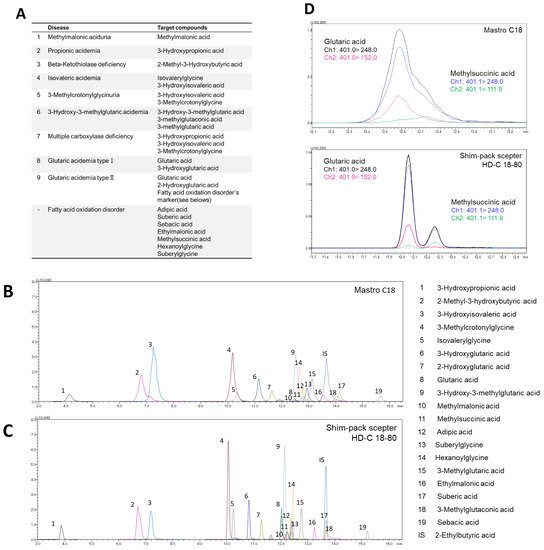
A fully automated LC-MS/MS-based analytical system was developed to quantify serum organic acids, providing a diagnostic basis for metabolic disorders such as organic acidemias. The optimization of the pretreatment process using CLAM-2030 (Figure 2), LC separation (Figure 1), and MS detection (Table 1) improved the performance of the system, which was sufficient in terms of the measurement’s reproducibility (Table 2). We also demonstrated that the levels of organic acid markers in the serum samples of patients were elevated compared to those in healthy subjects (Figure 4). These results strongly suggest that our system is reliable in clinical settings, although further improvements are required.

Figure 1. Investigation of LC separation conditions. (A) Targeted diseases and marker metabolites. MRM chromatogram of 3-NPH derivatized organic acids obtained from (B) MastroC18 and (C) Shim-pack sceptor HD-C18-80. (D) MRM chromatogram of glutaric acid and methylsuccinic acid on MastroC18 and Shim-pack sceptor HD-C18-80 column.


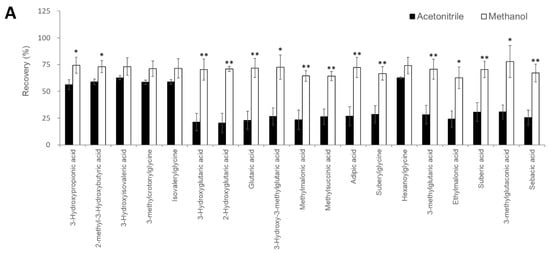
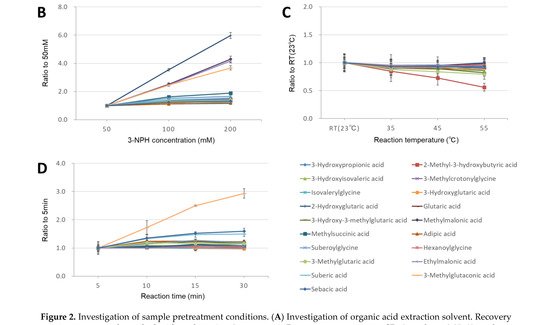
Figure 2. Investigation of sample pretreatment conditions. (A) Investigation of organic acid extraction solvent. Recovery rate in serum samples spiked with analytes (n = 3 per group). Data represents means ± SD. * p value < 0.05, ** p value < 0.01 versus Acetonitrile. Effect of 3-NPH derivatization reaction by (B) 3-NPH concentration, (C) reaction temperature, and (D) reaction time. Data represents means ± SD.
Table 1. Multiple reaction monitoring transitions of 3-Nitrophenylhydrazine (3-NPH) derivatized organic acids. For all compounds, 3-NPH derivatized reaction was found to occur in all carboxyl groups.
| Compounds | Number of Carboxyl Groups | Number of 3-NPH Derivatized | Precursor Ion (m/z) | Product Ion (m/z) | Retention Time (min) | |
|---|---|---|---|---|---|---|
| Quantitation | Reference | |||||
| 3-Hydroxypropionic acid | 1 | 1 | 224.2 | 194.1 | 152.0 | 3.82 |
| 2-Methyl-3-hydroxybutyric acid | 1 | 1 | 252.0 | 208.1 | 165.1 | 6.75 |
| 3-Hydroxyisovaleric acid | 1 | 1 | 252.2 | 194.0 | 152.0 | 7.23 |
| 3-Methylcrotonylglycine | 1 | 1 | 291.0 | 209.0 | 137.0 | 10.11 |
| Isovalerylglycine | 1 | 1 | 293.0 | 137.0 | 209.0 | 10.30 |
| 3-Hydroxyglutaric acid | 2 | 2 | 417.0 | 222.0 | 178.0 | 10.87 |
| 2-Hydroxyglutaric acid | 2 | 2 | 417.0 | 137.0 | 220.0 | 11.33 |
| Glutaric acid | 2 | 2 | 401.0 | 152.0 | 248.0 | 12.08 |
| 3-Hydroxy-3-methylglutaric acid | 2 | 2 | 431.0 | 236.1 | 178.0 | 12.19 |
| Methylmalonic acid | 2 | 2 | 387.0 | 178.0 | 150.0 | 12.22 |
| Methylsuccinic acid | 2 | 2 | 401.1 | 248.0 | 111.9 | 12.28 |
| Adipic acid | 2 | 2 | 415.0 | 178.0 | 262.1 | 12.42 |
| Suberylglycine | 2 | 2 | 500.2 | 137.0 | 209.1 | 12.44 |
| Hexanoylglycine | 1 | 1 | 307.1 | 137.0 | 208.9 | 12.49 |
| 3-Methylglutaric acid | 2 | 2 | 415.1 | 262.1 | 152.0 | 12.80 |
| Ethylmalonic acid | 2 | 2 | 401.1 | 178.0 | 150.0 | 13.29 |
| Suberic acid | 2 | 2 | 443.2 | 152.0 | 137.0 | 13.71 |
| 3-Methylglutaconic acid | 2 | 2 | 413.0 | 260.0 | 178.0 | 13.72 |
| Sebacic acid | 2 | 2 | 471.1 | 137.0 | 152.0 | 15.23 |
| 13C3-3-Hydroxypropionic acid (ISTD) | 1 | 1 | 226.8 | 196.0 | 152.0 | 3.82 |
| 13C4-Methylmalonic acid (ISTD) | 2 | 2 | 391.2 | 151.0 | 179.1 | 12.22 |
| 2-Ethylbutyric acid (ISTD) | 1 | 1 | 250.2 | 137.0 | 107.0 | 13.71 |
Recently, the use of LC-MS has become widespread in clinical laboratories [16]; however, it is necessary to automate and standardize the pretreatment process while requiring as little human labor as possible to operate it on a daily basis [17][18]. CLAM-2030, a pretreatment module that is coupled with LC-MS, has been used in various clinical applications, such as blood TDM and toxin-drug detection [19]. However, the previously described pretreatment process includes only simple deproteinization and does not involve other complex operations. In this study, we optimized the process of the CLAM-2030 module, including not only deproteinization but also the derivatization of the deproteinized sample using 3-NPH (Figure 3A). As thousands of low-molecular-weight compounds are present in blood [20][21], and their chemical properties vary widely, the efficiency of extraction depends on the solvent used [22][23]. Methanol is commonly used as a deproteinization reagent and has excellent extraction efficiency for various metabolites present in blood samples [22][23]. We confirmed that the extraction efficiency of 19 serum organic acids using methanol was superior to when using acetonitrile (Figure 2A). In addition, we performed derivatization using 3-NPH to measure the organic acid levels using LCMS. Generally, organic acids containing carboxyl group(s) are difficult to separate via LC and show a low sensitivity in MS measurements [24]; therefore, direct analysis via LCMS is considered challenging. Therefore, several attempts were made to derivatize organic acids using specific reagents, followed by separation via LC, and the improvement of their sensitivity via MS. Derivatization using 3-NPH has already been reported to be effective in the simultaneous analysis of cellular citric acid cycle intermediates [25] and fecal short-chain fatty acids [26]. In addition, it was recently reported that it can be applied to the analysis of serum acylcarnitines [27], the compounds that are measured in newborn mass screening [1][2][3]. Thus, it is possible to analyze acylcarnitines and organic acids using our automated analytical system.
In addition to 3-NPH, 2-picolylamine and EDC (and others) are used as derivatizing reagents for carboxylic acids [28][29][30]. While the 3-NPH reaction proceeds in an aqueous solution, reactions with other reagents proceed only in organic solvents. Therefore, liquid-liquid extraction (LLE) and solid-phase extraction (SPE) are required along with protein removal to purify the target compounds in the blood, which is laborious. Thus, we believe that 3-NPH derivatization provides an advantage for the CLAM-2030 system.
At present, the GC-MS system is most commonly used for urinary organic acid analysis [4][5][6]. However, pretreatment of GC-MS urine samples is time-consuming and laborious, requiring urease treatment prior to trimethylsilylation (TMS) or tert-butyldimethylsilylation (TBDMS) derivatization [5][6]. These complex processes can affect the reproducibility of the results. Ohie et al. reported the reproducibility of organic acid analysis using GC-MS with CV values in the range of 8.8–16.1% for TMS derivatization and 4.3–11.0% for TBDMS derivatization [6]. By contrast, our study showed that the reproducibility of the automated LC-MS/MS system was approximately 10.4% CV (Table 2), highlighting its effectiveness and high reproducibility.
Table 2. Result of validation study. r2: correlation coefficient of the calibration curves ranging 2–100 µM. LLOD: Low limit of detection. LLOQ: Low limit of quantification.
| Compounds | r2 | LLOD (µM) |
Accuracy (%) | Intra-Assay (n = 5) (CV%) |
Inter-Assay (n = 5) (CV%) |
|||
|---|---|---|---|---|---|---|---|---|
| 5 µM | 25 µM | 5 µM | 25 µM | 5 µM | 25 µM | |||
| 3-Hydroxypropionic acid | 0.998 | 0.13 | 113.6 | 96.8 | 0.9 | 1.8 | 4.5 | 4.6 |
| 2-Methyl-3-hydroxybutyric acid | 0.998 | 0.06 | 100.8 | 93.7 | 4.3 | 4.6 | 3.1 | 4.6 |
| 3-Hydroxyisovaleric acid | 0.996 | 0.25 | 99.9 | 95.4 | 5.5 | 5.3 | 3.4 | 3.6 |
| 3-Methylcrotonylglycine | 0.996 | 0.06 | 100 | 94.9 | 1.8 | 2.0 | 5.6 | 4.3 |
| Isovalerylglycine | 0.997 | 0.06 | 101.6 | 100.6 | 3.4 | 3.4 | 5.2 | 3.5 |
| 3-Hydroxyglutaric acid | 0.994 | 0.06 | 96.3 | 94.0 | 3.7 | 1.8 | 5.3 | 3.6 |
| 2-Hydroxyglutaric acid | 0.998 | 0.06 | 96.5 | 92.5 | 4.6 | 1.7 | 4.1 | 5.7 |
| Glutaric acid | 0.999 | 0.13 | 101.5 | 97.4 | 3.9 | 1.8 | 8.6 | 5.5 |
| 3-Hydroxy-3-methylglutaric acid | 0.998 | 0.06 | 87.2 | 94.7 | 6.0 | 3.6 | 9.3 | 3.7 |
| Methylmalonic acid | 0.999 | 0.06 | 110.4 | 97.2 | 4.8 | 5.2 | 9.0 | 4.9 |
| Methylsuccinic acid | 0.997 | 0.50 | 102.8 | 101.0 | 6.5 | 2.3 | 4.0 | 1.8 |
| Adipic acid | 0.997 | 0.13 | 103.9 | 96.4 | 5.1 | 2.0 | 7.9 | 4.1 |
| Suberylglycine | 0.999 | 0.06 | 108.9 | 103.1 | 2.1 | 4.1 | 10.4 | 3.0 |
| Hexanoylglycine | 0.998 | 0.06 | 109.0 | 100.3 | 4.2 | 3.6 | 5.3 | 3.2 |
| 3-Methylglutaric acid | 0.999 | 0.06 | 105.0 | 100.1 | 2.9 | 1.9 | 3.7 | 2.2 |
| Ethylmalonic acid | 0.992 | 0.13 | 94.7 | 99.5 | 3.0 | 3.9 | 10.2 | 5.6 |
| Suberic acid | 0.997 | 0.06 | 114.1 | 100.6 | 2.3 | 4.3 | 6.0 | 2.3 |
| 3-Methylglutaconic acid | 0.999 | 0.06 | 106.3 | 97.8 | 3.3 | 3.5 | 7.1 | 3.5 |
| Sebacic acid | 0.999 | 0.50 | 109.6 | 99.5 | 2.2 | 3.5 | 8.8 | 3.2 |
One of the major advantages of using LC-MS/MS in clinical laboratories is the ability to analyze multiple components simultaneously. Similar to organic acids, steroid compounds (hormones, etc.) in the blood are suitable for simultaneous analysis, but this has not yet been automated. Conventionally, steroid hormones are individually (or manually) measured by radioimmunoassay (RIA) or their TMS derivatives are measured by GC-MS [31]. TMS derivatization targets the hydroxyl group of a steroid, but the derivative compound is usually unstable. Furthermore, blood hormones that are present in limited amounts are difficult to measure due to their low sensitivity. The derivatization of steroids using picolinic acid (pyridine-2-carboxylic acid) dramatically increases the sensitivity for LC-MS/MS measurements [32][33]. However, this process requires complicated steps such as the LLE of blood steroids and the SPE of their derivatives. Currently, however, the CLAM-2030 system cannot process these steps, but if the function can be extended in the future, the fully automated analysis of steroid compounds will be possible.
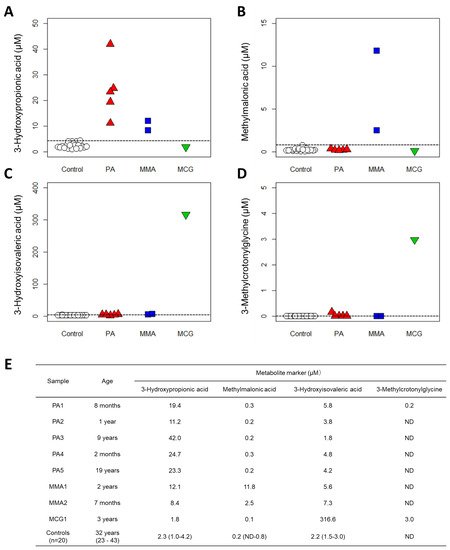
We validated our system using sera from patients with three organic acidemias and observed that the serum levels of marker organic acids were higher in the patient samples than in the samples of healthy subjects (Figure 3). These results strongly suggest that measuring serum organic acid levels can provide a sufficient basis for diagnosis. Urinary organic acid analysis via GC-MS can measure hundreds of organic acids and produce rather qualitative results for diagnosis [34]. However, LC-MS has the advantage of producing highly quantitative data; therefore, if the concentration range of each organic acid in the serum of healthy subjects (also known as “reference interval”) can be determined, then quantitative evaluation will be possible not only for diagnosing diseases but also for monitoring the therapeutic effect or prognosis. Moreover, compared to analyzing urine samples that are less invasive but often difficult to collect from newborns and infants [35][36], the use of blood or serum samples is advantageous in clinical practice, especially in situations where tests are urgently needed.

Figure 3. Results of clinical validation. Quantification results with new method from 20 controls and 8 patients: (A) 3-Hydroxypropionic acid, (B) Methylmalonic acid, (C) 3-Hydroxyisovaleric acid and (D) 3-Methylcrotonylglycine. PA: propionic acidemia. MMA: methylmalonic acidemia. MCG: methylcrotonylglycinuria. Dashed lines indicate the maximum value of controls. (E) Patient data and control data (medians (ranges)). ND: not detected, plotted as 0 µM.
This entry is adapted from the peer-reviewed paper 10.3390/diagnostics11122195
References
- Millington, D.S.; Kodo, N.; Norwood, D.L.; Roe, C.R. Tandem Mass Spectrometry: A New Method for Acylcarnitine Profiling with Potential for Neonatal Screening for Inborn Errors of Metabolism. J. Inherit. Metab. Dis. 1990, 13, 321–324.
- Rashed, M.S.; Ozand, P.T.; Bucknall, M.P.; Little, D. Diagnosis of Inborn Errors of Metabolism from Blood Spots by Acylcarnitines and Amino Acids Profiling Using Automated Electrospray Tandem Mass Spectrometry. Pediatr. Res. 1995, 38, 324–331.
- Schulze, A.; Lindner, M.; Kohlmüller, D.; Olgemöller, K.; Mayatepek, E.; Hoffmann, G.F. Expanded Newborn Screening for Inborn Errors of Metabolism by Electrospray Ionization-Tandem Mass Spectrometry: Results, Outcome, and Implications. Pediatrics 2003, 111, 1399–1406.
- Tanaka, K.; West-Dull, A.; Hine, D.G.; Lynn, T.B.; Lowe, T. Gas-Chromatographic Method of Analysis for Urinary Organic Acids. II. Description of the Procedure, and Its Application to Diagnosis of Patients with Organic Acidurias. Clin. Chem. 1980, 26, 1847–1853.
- Matsumoto, I.; Kuhara, T. A New Chemical Diagnostic Method for Inborn Errors of Metabolism by Mass Spectrometry—Rapid, Practical, and Simultaneous Urinary Metabolites Analysis. Mass Spectrom. Rev. 1996, 15, 43–57.
- Ohie, T.; Fu, X.-W.; Iga, M.; Kimura, M.; Yamaguchi, S. Gas Chromatography-Mass Spectrometry with Tert.-Butyldimethylsilyl Derivatization: Use of the Simplified Sample Preparations and the Automated Data System to Screen for Organic Acidemias. J. Chromatogr. B Biomed. Sci. Appl. 2000, 746, 63–73.
- Deodato, F.; Boenzi, S.; Santorelli, F.M.; Dionisi-Vici, C. Methylmalonic and Propionic Aciduria. Am. J. Med. Genet.-Semin. Med. Genet. 2006, 142C, 104–112.
- Bannwart, C.; Wermuth, B.; Baumgartner, R.; Suormala, T.; Wiesmann, U.N. Isolated Biotin-Resistant Deficiency of 3-Methylcrotonyl-CoA Carboxylase Presenting as a Clinically Severe Form in a Newborn with Fatal Outcome. J. Inherit. Metab. Dis. 1992, 15, 863–868.
- Vockley, J.; Ensenauer, R. Isovaleric Acidemia: New Aspects of Genetic and Phenotypic Heterogeneity. Am. J. Med. Genet.-Semin. Med. Genet. 2006, 142C, 95–103.
- Seger, C.; Shipkova, M.; Christians, U.; Billaud, E.M.; Wang, P.; Holt, D.W.; Brunet, M.; Kunicki, P.K.; Pawinski, T.; Langman, L.J.; et al. Assuring the Proper Analytical Performance of Measurement Procedures for Immunosuppressive Drug Concentrations in Clinical Practice: Recommendations of the International Association of Therapeutic Drug Monitoring and Clinical Toxicology Immunosuppressiv. Ther. Drug Monit. 2016, 38, 170–189.
- Zhang, Y.; Zhang, R. Recent Advances in Analytical Methods for the Therapeutic Drug Monitoring of Immunosuppressive Drugs. Drug Test. Anal. 2018, 10, 81–94.
- Keevil, B.G. LC–MS/MS Analysis of Steroids in the Clinical Laboratory. Clin. Biochem. 2016, 49, 989–997.
- Plenis, A.; Olędzka, I.; Kowalski, P.; Miękus, N.; Bączek, T. Recent Trends in the Quantification of Biogenic Amines in Biofluids as Biomarkers of Various Disorders: A Review. J. Clin. Med. 2019, 8, 640.
- Tai, S.S.-C.; Bedner, M.; Phinney, K.W. Development of a Candidate Reference Measurement Procedure for the Determination of 25-Hydroxyvitamin D₃ and 25-Hydroxyvitamin D₂ in Human Serum Using Isotope-Dilution Liquid Chromatography Tandem Mass Spectrometry. Anal. Chem. 2010, 82, 1942–1948.
- Stepman, H.C.M.; Vanderroost, A.; Van Uytfanghe, K.; Thienpont, L.M. Candidate Reference Measurement Procedures for Serum 25-Hydroxyvitamin D₃ and 25-Hydroxyvitamin D₂ by Using Isotope-Dilution Liquid Chromatography-Tandem Mass Spectrometry. Clin. Chem. 2011, 57, 441–448.
- Grebe, S.K.G.; Singh, R.J. LC-MS/MS in the Clinical Laboratory—Where to from Here? Clin. Biochem. Rev. 2011, 32, 5–31.
- Vogeser, M.; Kirchhoff, F. Progress in Automation of LC-MS in Laboratory Medicine. Clin. Biochem. 2011, 44, 4–13.
- Zhang, Y.V.; Rockwood, A. Impact of Automation on Mass Spectrometry. Clin. Chim. Acta 2015, 450, 298–303.
- Robin, T.; Barnes, A.; Dulaurent, S.; Loftus, N.; Baumgarten, S.; Moreau, S.; Marquet, P.; El Balkhi, S.; Saint-Marcoux, F. Fully Automated Sample Preparation Procedure to Measure Drugs of Abuse in Plasma by Liquid Chromatography Tandem Mass Spectrometry. Anal. Bioanal. Chem. 2018, 410, 5071–5083.
- Psychogios, N.; Hau, D.D.; Peng, J.; Guo, A.C.; Mandal, R.; Bouatra, S.; Sinelnikov, I.; Krishnamurthy, R.; Eisner, R.; Gautam, B.; et al. The Human Serum Metabolome. PLoS ONE 2011, 6, e16957.
- Wishart, D.S.; Jewison, T.; Guo, A.C.; Wilson, M.; Knox, C.; Liu, Y.; Djoumbou, Y.; Mandal, R.; Aziat, F.; Dong, E.; et al. HMDB 3.0-The Human Metabolome Database in 2013. Nucleic Acids Res. 2013, 41, D801–D807.
- A, J.; Trygg, J.; Gullberg, J.; Johansson, A.I.; Jonsson, P.; Antti, H.; Marklund, S.L.; Moritz, T. Extraction and GC/MS Analysis of the Human Blood Plasma Metabolome. Anal. Chem. 2005, 77, 8086–8094.
- Want, E.J.; O’Maille, G.; Smith, C.A.; Brandon, T.R.; Uritboonthai, W.; Qin, C.; Trauger, S.A.; Siuzdak, G. Solvent-Dependent Metabolite Distribution, Clustering, and Protein Extraction for Serum Profiling with Mass Spectrometry. Anal. Chem. 2006, 78, 743–752.
- Minero, C.; Vincenti, M.; Lago, S.; Pelizzetti, E. Determination of Trace Amounts of Highly Hydrophilic Compounds in Water by Direct Derivatization and Gas Chromatography—Mass Spectrometry. Fresenius J. Anal. Chem. 1994, 350, 403–409.
- Han, J.; Gagnon, S.; Eckle, T.; Borchers, C.H. Metabolomic Analysis of Key Central Carbon Metabolism Carboxylic Acids as Their 3-Nitrophenylhydrazones by UPLC/ESI-MS. Electrophoresis 2013, 34, 2891–2900.
- Han, J.; Lin, K.; Sequeira, C.; Borchers, C.H. An Isotope-Labeled Chemical Derivatization Method for the Quantitation of Short-Chain Fatty Acids in Human Feces by Liquid Chromatography-Tandem Mass Spectrometry. Anal. Chim. Acta 2015, 854, 86–94.
- Han, J.; Higgins, R.; Lim, M.D.; Atkinson, K.; Yang, J.; Lin, K.; Borchers, C.H. Isotope-Labeling Derivatization with 3-Nitrophenylhydrazine for LC/Multiple-Reaction Monitoring-Mass-Spectrometry-Based Quantitation of Carnitines in Dried Blood Spots. Anal. Chim. Acta 2018, 1037, 177–187.
- Joo, K.-M.; Choi, D.; Park, Y.-H.; Yi, C.-G.; Jeong, H.-J.; Cho, J.-C.; Lim, K.-M. A Rapid and Highly Sensitive UPLC-MS/MS Method Using Pre-Column Derivatization with 2-Picolylamine for Intravenous and Percutaneous Pharmacokinetics of Valproic Acid in Rats. J. Chromatogr. B Anal. Technol. Biomed. Life Sci. 2013, 938, 35–42.
- Wu, Q.; Xu, Y.; Ji, H.; Wang, Y.; Zhang, Z.; Lu, H. Enhancing Coverage in LC–MS-Based Untargeted Metabolomics by a New Sample Preparation Procedure Using Mixed-Mode Solid-Phase Extraction and Two Derivatizations. Anal. Bioanal. Chem. 2019, 411, 6189–6202.
- Qi, B.-L.; Liu, P.; Wang, Q.-Y.; Cai, W.-J.; Yuan, B.-F.; Feng, Y.-Q. Derivatization for Liquid Chromatography-Mass Spectrometry. TrAC-Trends Anal. Chem. 2014, 59, 121–132.
- Stanczyk, F.Z.; Clarke, N.J. Advantages and Challenges of Mass Spectrometry Assays for Steroid Hormones. J. Steroid Biochem. Mol. Biol. 2010, 121, 491–495.
- Honda, A.; Yamashita, K.; Miyazaki, H.; Shirai, M.; Ikegami, T.; Xu, G.; Numazawa, M.; Hara, T.; Matsuzaki, Y. Highly Sensitive Analysis of Sterol Profiles in Human Serum by LC-ESI-MS/MS. J. Lipid Res. 2008, 49, 2063–2073.
- Honda, A.; Miyazaki, T.; Ikegami, T.; Iwamoto, J.; Yamashita, K.; Numazawa, M.; Matsuzaki, Y. Highly Sensitive and Specific Analysis of Sterol Profiles in Biological Samples by HPLC-ESI-MS/MS. J. Steroid Biochem. Mol. Biol. 2010, 121, 556–564.
- Kuhara, T. Gas Chromatographic-Mass Spectrometric Urinary Metabolome Analysis to Study Mutations of Inborn Errors of Metabolism. Mass Spectrom. Rev. 2005, 24, 814–827.
- Kaufman, J.; Fitzpatrick, P.; Tosif, S.; Hopper, S.M.; Donath, S.M.; Bryant, P.A.; Babl, F.E. Faster Clean Catch Urine Collection (Quick-Wee Method) from Infants: Randomised Controlled Trial. BMJ 2017, 357, j1341.
- Kaufman, J.; Tosif, S.; Fitzpatrick, P.; Hopper, S.M.; Bryant, P.A.; Donath, S.M.; Babl, F.E. Quick-Wee: A Novel Non-Invasive Urine Collection Method. Emerg. Med. J. 2017, 34, 63–64.
This entry is offline, you can click here to edit this entry!
