Citrus cultivation ; plant nutrition;fertilizer use; soil health
1. Introduction
Chemical fertilizer has been excessively used for high yield of citrus around the world, especially in China; meanwhile, it deteriorates the citrus orchard soil environment. To resolve the conflict, the use of organic fertilizer provides a promising solution. However, the data about organic fertilizer used in citrus orchard is rarely available. Here, four treatments including CK (no fertilizer), CF (chemical fertilizer), OF + CF (chemical fertilizer reduction combined with organic fertilizer; application of N, P2O5, K2O fertilizer and organic fertilizer is 0.564, 0.236, 0.336 and 10 kg/plant), and BF + CF (chemical fertilizer reduction combined with bioorganic fertilizer; application of N, P2O5, K2O fertilizer and bioorganic fertilizer is 0.508, 0.320, 0.310 and 10 kg/plant) were performed in a ‘Ponkan’ (Citrus reticulata Blanco) orchard to evaluate the effect of organic fertilizer on citrus yield, growth, soil properties etc. when nutrients of fertilizer of each treatment were equal except CK. The data obtained in 2019 and 2020 showed that both OF + CF and BF + CF were beneficial to improve soil fertility (soil physicochemical and microbe properties) and citrus growth physiology (growth, nutrient and photosynthesis), alleviate NO3−-N leaching, and promote yields. Comprehensive evaluation indicated that BF + CF was more effective than OF + CF. Together, organic fertilizer has the potential to substitute partial chemical fertilizer with improvement in soil properties, growth physiology, and yield of citrus.
2. Effect of Different Treatments on Soil Properties and Environment
2.1.1. Soil Physicochemical Properties
Table 1 presents the effect of CFOF on soil physicochemical properties. In the OF + CF and BF + CF treatments, soil porosity, pH, alkali-hydrolyzable N, available P and K, and soil organic matter were significantly (p ≤ 0.05) higher than that of CF treatments in 2019 and 2020. In addition, soil physicochemical properties of BF + CF were higher than those of OF + CF treatment on the whole, but no significant difference (except available P). These results indicate that CFOF is beneficial to improving soil physicochemical properties, especially when the BF + CF is used.
Table 1. The effect of different treatments on physical and chemical properties.
| Year |
Treatment |
pH Value |
Porosity (%) |
Organic Matter (g·kg−1) |
Alkali-Hydrolyzable N (mg·kg−1) |
Available P (mg·kg−1) |
Available K (mg·kg−1) |
| 2019 |
CK |
5.01 ± 0.06 ab |
44.23 ± 0.50 b |
20.08 ± 0.41 b |
88.82 ± 5.10 c |
49.45 ± 2.96 c |
188.50 ± 1.45 c |
| CF |
4.90 ± 0.16 b |
44.60 ± 0.61 b |
21.13 ± 1.44 b |
115.43 ± 6.31 b |
51.84 ± 0.72 c |
197.96 ± 1.63 b |
| OF + CF |
5.11 ± 0.12 a |
47.82 ± 1.39 a |
24.20 ± 1.06 a |
129.80 ± 3.33 a |
69.12 ± 1.15 a |
218.32 ± 4.50 a |
| BF + CF |
5.18 ± 0.13 a |
48.52 ± 0.59 a |
23.99 ± 0.72 a |
124.54 ± 3.34 a |
61.97 ± 4.48 b |
221.15 ± 5.01 a |
| 2020 |
CK |
4.97 ± 0.09 b |
44.37 ± 1.40 b |
19.52 ± 0.81 c |
86.36 ± 2.96 c |
47.65 ± 3.50 c |
177.76 ± 4.71 c |
| CF |
4.85 ± 0.12 b |
44.21 ± 1.60 b |
20.80 ± 0.70 b |
123.53 ± 8.37 b |
54.15 ± 4.54 b |
196.51 ± 6.13 b |
| OF + CF |
5.22 ± 0.10 a |
50.95 ± 1.34 a |
25.36 ± 0.82 a |
136.20 ± 3.45 a |
77.33 ± 4.26 a |
228.44 ± 7.23 a |
| BF + CF |
5.20 ± 0.09 a |
52.46 ± 0.73 a |
25.84 ± 0.43 a |
138.48 ± 4.58 a |
74.79 ± 4.86 a |
230.26 ± 3.69 a |
2.1.2. Soil Microbe Properties
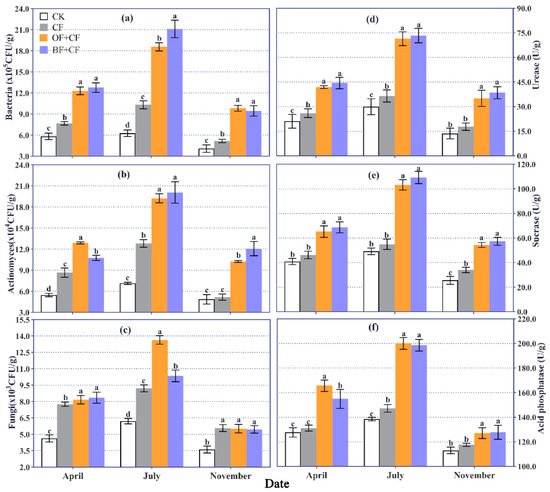
Figure 1 shows the effect of CFOF on soil enzyme activity and the number of cultivable microbes. In each case, soil microbe properties were better in July and lower in April and November. In the OF + CF and BF + CF treatments, soil microbe properties were better than the CK and CF treatments on the whole. In particular, in the OF + CF and BF + CF treatments, soil cultivable bacteria and actinomyces were significantly higher than that of CF in July and November. In addition, when comparing soil cultivable fungus measurements to the CF treatment, OF + CF and BF + CF treatments were significantly higher by 48.1% and 12.4% in July, respectively, while they did not differ significantly in November. Measurements of urease, sucrase, and acid phosphatase activities in the OF + CF and BF + CF treatments were significantly higher than that of CK and CF in July and November. On the whole, soil microbe properties of BF + CF treatment were better than that of OF + CF. These results showed that CFOF improved soil enzyme activity and the number of cultivable microbes, especially in the BF + CF treatment.
Figure 1. The effect of different treatments on microbial properties of soil, including bacteria (a), actinomycetes (b), fungi (c), urease (d), sucrase (e), acid phosphatase (f). CK: no fertilizer; CF: chemical fertilizer; OF + CF: chemical fertilizer combined with organic fertilizer; BF + CF: chemical fertilizer combined with bioorganic fertilizer. The bars were means ± standard error; the column with different letters indicated significant difference at p ≤ 0.05.
2.1.3. Soil Environment
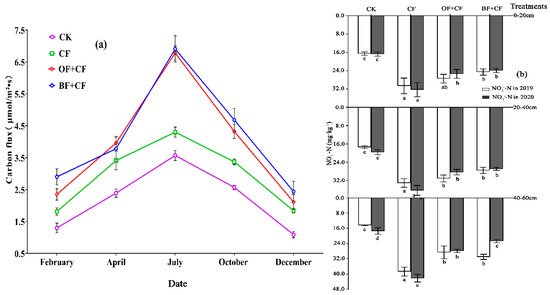
Figure 2 shows the effect of CFOF on CO2 emission flux and NO3−-N in soil. As seen in Figure 2a, CO2 emission flux in OF + CF and BF + CF treatments was higher than that observed under the CK and CF treatments. A rapid growth trend from February to July, with a peak in July, and then and a downward trend were observed. CO2 emission flux was significantly higher in the OF + CF and BF + CF treatments than in the CF treatment by 57.7% and 60.7%, respectively, in July, and significantly higher in the BF + CF treatment than in the OF + CF and CF treatments by 32.6% and 15.6%, respectively. On the whole, CO2 emission flux was also higher in the BF + CF treatment than that of OF + CF. As illustrated in Figure 2b, NO3−-N from different soil layers was significantly higher in the CF, OF + CF and BF + CF treatments than that of CK. The 0–20 cm soil layer, when compared between the CF, BF + CF treatments had NO3−-N that was significantly lower by 19.7% in 2019, while the OF + CF and BF + CF treatments were also significantly lower by 21.2% and 25.7%, respectively, in 2020. In the 20–40 cm soil layer, compared with the CF treatment, NO3−-N was significantly lower by 16.6% in the BF + CF treatment in 2019, while OF + CF and BF + CF treatments also had significantly lower NO3−-N by 21.9% and 25.9%, respectively, in 2020. In the 40–60 cm soil layer, compared with the CF treatment, NO3−-N in the OF + CF and BF + CF treatments was also significantly lower by 26.0% and 19.9%, respectively, in 2019, while significantly lower by 33.9% and 46.2%, respectively, in 2020. Additionally, NO3−-N in the 40–60 cm soil layer of the CF treatment was larger than that of any other soil layer, while NO3−-N in the 20–40 cm soil layer of the OF + CF and BF + CF treatments was larger than that of any other soil layer. Furthermore, NO3−-N from each soil layer of the BF + CF treatment was lower than that of those measured from the OF + CF treatment on the whole. Therefore, CFOF is beneficial for slowing down the accumulation and migration of NO3−-N in the soil while promoting CO2 emission flux to some degree, especially in the BF + CF treatment.
Figure 2. The effect of different treatments on environments of soil, including carbon flux (a), NO3-N (b).CK: no fertilizer; CF: chemical fertilizer; OF + CF: chemical fertilizer combined with organic fertilizer; BF + CF: chemical fertilizer combined with bioorganic fertilizer. The bars were means ± standard error; the column with different letters indicated significant difference at p ≤ 0.05.
3. Effect of Different Treatments on Growth Physiology
3.1. Plant Growth
Table 2 presents the effect of CFOF on plant growth index. In comparison with leaf area, thickness of a hundred leaves, dry matter of a hundred leaves of CK and CF, all that of CFOF was promoted in 2019, especially BF + CF significantly. In the OF + CF and BF + CF treatments, twig length was longer than that observed in the CK and CF treatments in 2019. In addition, the plant growth index in 2019 was similar to that of 2020. The plant growth index observed in the BF + CF treatment was higher than that of OF + CF treatment on the whole. These results show that CFOF is beneficial for promoting plant growth, especially the BF + CF treatment.
Table 2. The effect of different treatments on plant growth.
| Year |
Treatment |
Area of Leaf (cm2) |
Thickness of Hundred Leaves (mm) |
Dry Matter of Hundred Leaves (g) |
Length of Twigs (cm) |
| 2019 |
CK |
17.53 ± 0.77 c |
26.74 ± 0.38 c |
15.63 ± 0.52 c |
6.98 ± 0.54 b |
| CF |
18.59 ± 1.06 bc |
27.02 ± 0.35 bc |
17.03 ± 0.19 b |
7.60 ± 0.86 ab |
| OF + CF |
19.71 ± 1.05 ab |
27.85 ± 0.69 b |
17.75 ± 0.69 ab |
7.96 ± 0.92 ab |
| BF + CF |
20.78 ± 1.42 a |
28.88 ± 0.74 a |
18.06 ± 0.78 a |
8.50 ± 0.83 a |
| 2020 |
CK |
17.38 ± 0.86 c |
26.00 ± 0.33 c |
14.86 ± 0.62 c |
6.80 ± 0.30 b |
| CF |
18.76 ± 0.33 b |
27.73 ± 0.32 b |
16.52 ± 0.56 b |
7.95 ± 0.10 a |
| OF + CF |
20.30 ± 0.56 a |
28.50 ± 0.62 a |
17.36 ± 0.35 a |
8.13 ± 0.39 a |
| BF + CF |
20.34 ± 0.90 a |
28.62 ± 0.42 a |
17.95 ± 0.44 a |
8.38 ± 0.56 a |
3.2. Nutrient Elements
Table 3 presents the effect of CFOF on leaf nutrient physiology and twigs. The results showed that N, P, and K contents of leaves and twigs were higher in the OF + CF and BF + CF treatments than that of CK and CF treatments, in general. Moreover, N content of leaves in the OF + CF and BF + CF treatments was significantly higher than that observed in the CK treatment by 4.8% and 5.4%, respectively, in 2019, and by 6.2% and 6.3%, respectively, in 2020. Compared with the CK treatment, leaf K content in the OF + CF and BF + CF treatments was significantly higher by 12.6% and 16.6%, respectively, in 2019, and by 27.9% and 29.5%, respectively, in 2020. N, P, and K contents of twigs measured under the OF + CF and BF + CF treatments were significantly higher than that observed in the CK treatment in 2019 and 2020.Moreover, leaf K content in the BF + CF treatment was significantly higher than that observed in the CF treatment by 7.3% and 7.4% in 2019 and 2020. Furthermore, the nutrient content of leaves and twigs from the BF + CF treatment was higher than that of the OF + CF treatment; however, no significant difference was observed.
Table 3. The effect of different treatments on nutrients of leave and twigs.
| Year |
Treatment |
Leave |
Twigs |
| N (g·kg−1) |
P (g·kg−1) |
K (g·kg−1) |
N (g·kg−1) |
P (g·kg−1) |
K (g·kg−1) |
| |
CK |
27.95 ± 0.66 b |
1.34 ± 0.16 a |
13.10 ± 0.51 c |
11.17 ± 0.25 b |
0.81 ± 0.06 b |
8.17 ± 0.40 a |
| 2019 |
CF |
29.15 ± 0.55 a |
1.40 ± 0.05 a |
14.23 ± 0.46 b |
11.70 ± 0.37 ab |
0.92 ± 0.07 a |
8.46 ± 0.15 a |
| |
OF + CF |
29.30 ± 0.15 a |
1.43 ± 0.04 a |
14.75 ± 0.52 ab |
11.85 ± 0.40 a |
0.95 ± 0.08 a |
8.49 ± 0.32 a |
| |
BF + CF |
29.47 ± 0.74 a |
1.46 ± 0.02 a |
15.27 ± 0.56 a |
11.97 ± 0.60 a |
0.97 ± 0.04 a |
8.63 ± 0.37 a |
| 2020 |
CK |
27.89 ± 0.53 b |
1.36 ± 0.30 a |
12.38 ± 1.05 c |
11.22 ± 0.40 b |
0.78 ± 0.06 b |
8.20 ± 0.73 b |
| CF |
29.40 ± 0.89 a |
1.43 ± 0.07 a |
14.93 ± 0.52 b |
12.57 ± 0.36 a |
0.88 ± 0.05 a |
8.98 ± 0.23 a |
| OF + CF |
29.62 ± 0.16 a |
1.41 ± 0.07 a |
15.83 ± 0.14 ab |
12.11 ± 0.13 a |
0.93 ± 0.06 a |
9.01 ± 0.16 a |
| BF + CF |
29.66 ± 0.87 a |
1.45 ± 0.09 a |
16.03 ± 0.64 a |
12.53 ± 0.71 a |
0.95 ± 0.05 a |
8.92 ± 0.18 a |
Table 4 presents the effect of CFOF on nutrient physiology of fruits and roots. The nutrient content of fruits and roots grown under the OF + CF and BF + CF treatments was higher than that observed for the CK and CF treatments in 2019 and 2020. In 2019, compared with the CF treatment, nutrient content of fruits was significantly higher in the OF + CF and BF + CF treatments, while the nutrient content of roots grown under the BF + CF treatment was also significantly higher. In 2020, N and P contents of fruits were significantly higher in the OF + CF and BF + CF treatments than that observed in the CF treatment, and P and K contents of roots grown in the BF + CF treatment were significantly higher than that seen in the CF treatment by 16.7% and 8.9%, respectively. In addition, nutrient content of fruits and roots in the BF + CF treatment was higher than that seen in the OF + CF treatment; however, no statistically significant difference was observed. Therefore, CFOF is beneficial in promoting the absorption of nutrients in the citrus organ, especially the BF + CF treatment.
Table 4. The effect of different treatments on nutrients of fruits and roots.
| Year |
Treatment |
Fruits |
Roots |
| N (g·kg−1) |
P (g·kg−1) |
K (g·kg−1) |
N (g·kg−1) |
P (g·kg−1) |
K (g·kg−1) |
| 2019 |
CK |
19.17 ± 0.23 d |
1.26 ± 0.05 c |
11.23 ± 0.41 b |
10.82 ± 0.11 b |
0.36 ± 0.02 c |
8.56 ± 0.39 b |
| CF |
19.70 ± 0.48 c |
1.37 ± 0.07 b |
11.71 ± 0.13 b |
11.03 ± 0.44 b |
0.38 ± 0.03 bc |
8.62 ± 0.67 b |
| OF + CF |
20.77 ± 0.14 b |
1.45 ± 0.02 a |
12.57 ± 0.34 a |
11.46 ± 0.46 ab |
0.41 ± 0.01 ab |
8.87 ± 0.39 b |
| BF + CF |
21.87 ± 0.31 a |
1.48 ± 0.04 a |
12.73 ± 0.48 a |
11.83 ± 0.56 a |
0.43 ± 0.04 a |
9.72 ± 0.45 a |
| 2020 |
CK |
19.23 ± 0.23 d |
1.29 ± 0.05 c |
11.20 ± 0.56 b |
10.84 ± 1.07 a |
0.33 ± 0.03 c |
8.46 ± 0.32 c |
| CF |
20.19 ± 6.19 c |
1.44 ± 0.05 b |
11.91 ± 0.08 ab |
11.10 ± 0.91 a |
0.36 ± 0.04 bc |
8.86 ± 0.45 bc |
| OF + CF |
20.94 ± 5.94 b |
1.51 ± 0.02 a |
12.13 ± 0.23 a |
12.14 ± 1.13 a |
0.39 ± 0.02 ab |
9.21 ± 0.33 ab |
| BF + CF |
22.03 ± 1.03 a |
1.53 ± 0.01 a |
12.35 ± 0.78 a |
12.11 ± 0.17 a |
0.42 ± 0.01 a |
9.65 ± 0.42 a |
This entry is adapted from the peer-reviewed paper 10.3390/agriculture11121207