Your browser does not fully support modern features. Please upgrade for a smoother experience.
Please note this is an old version of this entry, which may differ significantly from the current revision.
Subjects:
Cell Biology
Tissue homeostasis via the elimination of aberrant cells is fundamental for organism survival. Cell competition is a key homeostatic mechanism, contributing to the recognition and elimination of aberrant cells, preventing their malignant progression and the development of tumors.
- PTP61F
- RAS
- JAK–STAT
- cell competition
1. Introduction
The vinegar fly, Drosophila melanogaster, is a valuable organism for modelling many human disorders, including cancer. Most of the “hallmarks of cancer” are able to be modelled in Drosophila, and along with the conservation ~70% of disease-relevant genes and its short life cycle, makes Drosophila a useful model for studying tumorigenesis (reviewed in [1,2,3]). Indeed Drosophila is a useful model organism for studying cooperative tumorigenesis—such as upon the activation of the GTPase RAS85D (commonly referred to as RAS, human orthologues HRAS/KRAS/NRAS) and loss of the apico-basal cell polarity regulators Scribble (SCRIB) or Discs large 1 (DLG1) (human orthologues SCRIB and DLG1-4, respectively) (reviewed in [4]). These alterations cooperate to promote the formation of neoplastic, invasive tumors in developing Drosophila larvae via the the promotion of cell proliferation and anti-apoptotic signals, and contribute to the co-option of c-Jun N-terminal Kinase (JNK) signalling into a proliferation-promoting signalling pathway (reviewed in [5]). However, individually activating RAS85D or impairing polarity cause only “pre-tumorigenic” tissue disruptions—RAS85D activation leads to benign tissue overgrowth [6,7], while polarity impairment leads to increased cell proliferation but also cell death, differentiation defects, and increased cell migration/invasion [7,8,9,10,11,12,13,14]. When entire tissues are depleted of SCRIB or DLG1 massive overgrowth occurs, but when scrib or dlg1 mutant cells are generated in a clonal manner in Drosophila developing epithelial tissues (the wing or eye-antennal imaginal discs), these cells are subject to a tissue surveillance and homeostasis mechanism known as cell competition [10,15]. The core concept of cell competition is that the fitness of each cell is surveyed relative to their neighbouring cells, and cells that are less fit are actively eliminated to maintain tissue homeostasis (reviewed in [16]). This is an evolutionarily conserved mechanism, though it is less studied in mammals compared with flies (reviewed in [17]). The eliminated cells are termed “loser cells”, while those that eliminate and replace them are termed “winner cells”. In Drosophila epithelial tissues, scrib/dlg1 mutant clones undergo cell competition, and are eliminated by their wild-type neighbours [10,15]. Mechanistically, the modulation of several signalling pathways is required for the elimination of polarity-impaired cells during cell competition, including the JNK, the Hippo tissue growth inhibitory, the Janus kinase-signal transducer and activator of transcription (JAK–STAT), and the Epidermal Growth Factor Receptor (EGFR)-RAS–Mitogen Activated Protein Kinase (MAPK) signalling pathways (reviewed in [16]). The precise functions and targets of each cell competition-induced signalling pathway and the interplay between them are not completely understood, but many involve protein tyrosine kinase (PTK) pathways, and therefore the investigation in cell competition of protein tyrosine phosphatases (PTPs) that regulate these pathways is a logical step.
The spatial and temporal activity of many signalling pathways are regulated by phosphorylation of proteins by protein kinases and dephosphorylation by protein phosphatases. Protein phosphatases are classified into three groups: protein serine/threonine phosphatases, PTPs, and dual-specificity phosphatases (DUSPs) (reviewed in [18,19,20]). Serine/threonine phosphorylation is the major type of protein phosphorylation in mammalian cells, but tyrosine phosphorylation-dependent signalling is critical for the relaying of cues from the extracellular environment and for cell-cell communication. More than 100 structurally and functionally diverse PTPs have been identified in the human genome [20], whist in Drosophila melanogaster, there are currently 44 known PTPs (including DUSPs), all with conserved human orthologues, though not all human PTPs have fly orthologues [21,22,23]. PTPs in Drosophila, as in mammals, belong to either the transmembrane receptor or non-receptor subtypes [21]. The Drosophila non-receptor protein tyrosine phosphatase 61F (Ptp61F) functions as a negative regulator in a number of highly conserved signalling pathways, including the JAK–STAT pathway [24,25,26,27], the Insulin-like Receptor (INR) pathway [24,27,28,29], the EGFR pathway [27,28], and the Platelet-Derived Growth Factor (PDGF)- and Vascular Endothelial Growth Factor (VEGF)-receptor-related (PVR) pathway [27]. The mammalian orthologs of PTP61F are PTP1B (encoded by PTPN1) and TCPTP (encoded by PTPN2), which share 74% catalytic domain sequence identity and 86% similarity, respectively (reviewed in [30,31]). PTP1B, the first mammalian PTP identified [32], is localised to the cytoplasmic face of the endoplasmic reticulum and plays an important role in immunity and metabolism, acting to dephosphorylate substrates such as the INR [33,34,35] and JAK-family PTKs JAK-2 and Tyk2 [36]. PTP1B can act as a tumor suppressor, but also has oncogenic roles as the upregulation of PTP1B can contribute to the activation of SRC-family PTKs [37,38] and mediate signalling by the HER-2 oncoprotein [39,40]. PTPN2 encodes two splice variants: A 48 kDa TCPTP (TC48) which, like PTP1B, is localised to the endoplasmic reticulum, and a 45 kDa variant (TC45) that is targeted to the nucleus but shuttles between the nuclear and cytoplasmic environments [41,42,43,44]. Thus, TCPTP has access to both nuclear substrates, such as STAT-1/3/5, and cytoplasmic substrates, such as INR and JAK-1/3 [31,44]. TCPTP and PTP1B have both overlapping and distinct functions in mammals [31]. TCPTP is thought to serve as a tumor suppressor, particularly in T cell acute lymphoblastic leukemia [45,46], but also there is evidence in breast cancer [47] and liver cancer [48,49]. However, the role of Ptp61F in Drosophila cancer models has not been explored.
2. Ptp61F Impairment Confers a Competitive Advantage on Epithelial Clones
Various highly conserved well-characterised signalling pathways, such as EGFR-RAS–MAPK and JAK–STAT signalling, are involved in cell competition in Drosophila epithelial tissues (reviewed in [16]). Since the regulation of these pathways are orchestrated by reversible tyrosine phosphorylation, the authors reasoned that PTPs might play an unappreciated role in cell competition. The Drosophila tyrosine phosphatase protein tyrosine phosphatase 61F (Ptp61F) was selected as a candidate to investigate, as it has been shown to negatively regulate EGFR-RAS–MAPK and JAK–STAT signalling [27].
First, the authors utilised a technique known as “twin-clone generation”, whereby a single recombination event simultaneously generates GFP-double-positive wild-type clones and GFP-negative mutant clones, in a background of GFP-single-positive wild-type Drosophila third-instar larval (L3) epithelial tissues (technique adapted from Froldi et al. [50]). In control third instar larval (L3) wing imaginal discs, the generation of twin-clones where both are wild-type, although one twin is GFP-double positive and the other is GFP negative (Figure 1A,A’), leads to clones where the GFP-double-positive clones are consistently slightly larger than their GFP-negative twins, perhaps due to background genetic effects (Figure 1E). However, when the GFP-negative clones are homozygous mutant for Ptp61F (Figure 1B,B’), using the null allele Ptp61FΔ [24], the trend was reversed and Ptp61FΔ/Δ clones are consistently larger than their wild-type twins (Figure 1E). Analysing the GFP-negative/GFP-double-positive size ratio for each twin-clone pair further revealed a statistically significant, ~30% increase in the size ratios between wild-type/wild-type and wild-type/Ptp61FΔ/Δ twin-clones in wing imaginal discs.
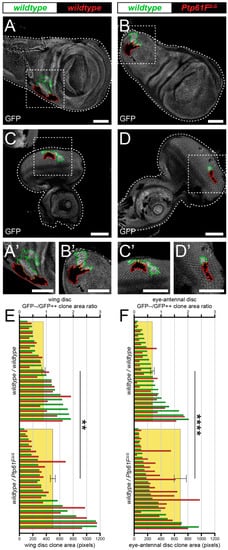
Figure 1. Ptp61F loss enhances epithelial clone relative fitness. (A–D) Confocal images of L3 imaginal tissues of the indicated genotypes (boxes at top, white indicates GFP-positive clones, black indicates remaining GFP-negative tissue) taken from animals where twin-clones were generated. The twins were either GFP-double positive (outlined in green) or GFP negative (outlined in red), with all other cells being GFP-single positive. (A,B) Twin clone analysis in wing imaginal discs. (A,A’) In wing imaginal discs, the GFP-double-positive clones in wild-type/wild-type twins are slightly larger (twin-clone size ratio = 0.895 ± 0.091). (B,B’) The reverse is true for wing disc wild-type/Ptp61FΔ/Δ twin-clones, with the GFP-negative mutant clones being generally larger (twin-clone size ratio = 1.244 ± 0.093). (C–D) Twin clone analysis in eye-antennal imaginal discs. (C,C’) In eye-antennal imaginal discs, the GFP-double-positive clones in wild-type/wild-type twin-clones are again generally larger (twin-clone size ratio = 0.680 ± 0.072). (D,D’) Similarly, eye-antennal wild-type/Ptp61FΔ/Δ twin-clones have generally larger GFP-negative mutant clones (twin-clone size ratio = 1.712 ± 0.228). (E) Quantification of L3 wing imaginal disc clone size profiles from wild-type/wild-type and wild-type/Ptp61FΔ/Δ twin-clone pairs. Green bars indicate the GFP-double-positive clone of the twin-clone pair, and red bars indicate the GFP-negative clone, and use the lower x-axis. Yellow rectangles indicate the average GFP-negative/GFP-double-positive clone area ratios, and use the upper x-axis, showing that Ptp61FΔ/Δ clones are significantly larger that the wild-type twin-clones (Student’s t-test, d.f. = 39, t = 3.169, p < 0.01). (F) Quantification of L3 eye-antennal imaginal disc clone size profiles from wild-type/wild-type and wild-type/Ptp61FΔ/Δ twin-clone pairs. Green bars indicate the GFP-double-positive clone of the twin-clone pair, and red bars indicate the GFP-negative clone, and use the lower x-axis. Yellow rectangles indicate the average GFP-negative/GFP-double-positive clone area ratios, and use the upper x-axis, showing that Ptp61FΔ/Δ clones are significantly larger that the wild-type twin-clones (Student’s t-test, d.f. = 47, t = 4.272, p < 0.0001). ** = p < 0.01, **** = p < 0.0001. Error bars = S.E.M. Note that clones were observed in all regions of both the eye-antennal and wing disc tissues, but that the figures show representative clones with GFP-negative/GFP-double-positive clone area ratios close to the average. Confocal microscopy images are single planes. Boxes in (A–D) are represented in (A’–D’), and dotted lines outline the tissue. Scale bars = 100 μm.
These results are supported by similar findings in experiments using L3 eye-antennal imaginal discs, where wild-type/wild-type twins were observed to have a slightly larger GFP-double-positive twin (Figure 1C,C’,F), but wild-type/Ptp61FΔ/Δ twins had a consistently larger GFP-negative, Ptp61F mutant twin (Figure 1D,D’,F). Similar to the wing discs, the GFP-negative/GFP-double-positive size ratio was significantly larger in wild-type/Ptp61FΔ/Δ twins compared to wild-type/wild-type twins, by ~2-fold. Altogether, these data show that loss of Ptp61F confers a competitive advantage upon epithelial tissue clones, possibly by promoting cell survival and/or proliferation.
3. Ptp61F Regulates Polarity-Impaired Clone Survival/Growth during Cell Competition
One mode of cell competition in Drosophila occurs during the removal of polarity-impaired (such as scrib or dlg1 mutant) cells from larval epithelial tissues, where these mutant cells are actively outcompeted and eliminated from epithelial tissue by mechanisms involving several cell competition and signalling pathways (reviewed in [16]). The twin-clone analyses suggested that PTP61F has a role in suppressing the ability of cells to compete, reducing their relative fitness and facilitating their elimination, as knocking-out Ptp61F clonally allows cells to outcompete their neighbours (Figure 1). The authors then tested whether Ptp61F reduction in cells that are relatively less fit (e.g., scrib mutant cells) might abrogate their elimination phenotype (Figure 2A). To investigate this, the mosaic analysis with a repressible cell marker (MARCM) technique was used, allowing for transgenes of interest and cell markers to be expressed in cells mutated for a gene-of-interest [51]. Using L3 eye-antennal imaginal discs, it was examined how Ptp61F knockdown affected the growth of clones with mutant scrib (scrib1) that have a loser cell fate. In control discs, where both GFP-marked clones and the remainder of the tissue were otherwise wild-type (except that a UAS-myr RFP transgene was present in RNAi-free control samples as a UAS balancing element, and UAS-Dcr-2 (a.k.a. Dicer) was also present in all samples), the induced clones make up ~40% of the tissue volume (Figure 2B,F). Expression of RNAi against Ptp61F (v37436) alone did not significantly alter this clonal tissue volume, with it remaining ~40% (Figure 2C,F). When clones homozygous for mutant scrib were induced, they contributed to a markedly smaller proportion of the total tissue volume, at ~11% (Figure 2D,F). However, expression of RNAi against Ptp61F within those scrib1/1 clones led to a small but statistically significant increase in their total volume to ~13% of the total tissue (Figure 2E,F). These data suggest that Ptp61F has a role, albeit small, in suppressing the ability of polarity-impaired cells to “fight back” against the efforts of neighbouring wild-type cells to eliminate them.
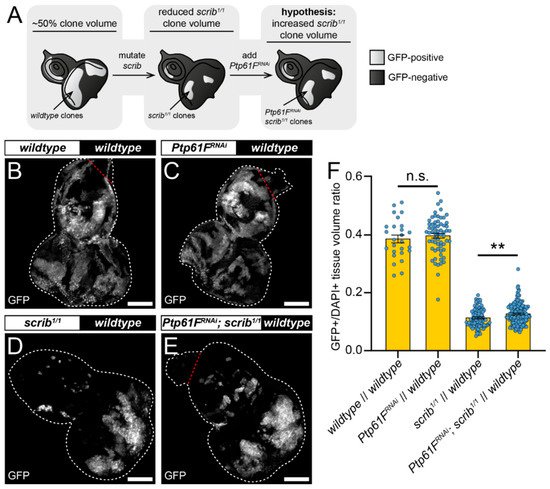
Figure 2. Ptp61F contributes to scrib-mutant clone elimination. (A) Diagram of our experimental process and hypothesis. (B–E) Confocal images of L3 eye-antennal imaginal discs of the indicated genotypes (boxes at top, white indicates GFP-positive clones, black indicates remaining GFP-negative tissue) taken from animals where clones were generated via MARCM to express transgenes in scrib-mutant, GFP-positive cells. (B,C) When GFP-positive tissue is wild-type (B) it makes up ~40% of the tissue (n = 26, = 0.386 ± 0.013), and Ptp61FRNAi expression (C) does not significantly alter the contribution of the clones to the tissue (n = 64, = 0.397 ± 0.008) (Student’s t-test, d.f. = 88, t = 0.7263, p > 0.05). (D,E) scrib-mutant clones (D) make up only ~11% of the tissue (n = 88, = 0.113 ± 0.003), but Ptp61FRNAi expressed in scrib-mutant clones (E) leads to a small, but statistically significant increase in clonal volume to ~13% (n = 144, = 0.127 ± 0.003) (Student’s t-test, d.f. = 230, t = 2.829, p < 0.01). (F) Quantification of the clone tissue volume contributions, as measured by the ratio of GFP-positive tissue to DAPI-positive tissue, showing that Ptp61F knockdown significantly increases the size of scrib-mutant clones. Note that Dcr-2 is also expressed wherever GFP is expressed. ** = p < 0.01. Error bars = S.E.M. Confocal microscopy images are maximum intensity projections. White dotted lines outline the tissue, red dotted lines indicate tissue excluded from quantification for consistency. Scale bars = 100 μm.
4. JAK–STAT Signalling Plays a Role in the Fitness of Scrib-Mutant Clones and Is Required Downstream of Ptp61F Knockdown for the Increased Survival of Scrib-Mutant Clones
The data thus far have demonstrated a new role for PTP61F as contributing to polarity-impaired cell competition. Previous studies have shown that PTP61F can attenuate JAK–STAT signalling in Drosophila [24,25,26,27,52], but whether PTP61F regulates JAK–STAT signalling in the context of cell competition is unclear. Moreover, although JAK–STAT signalling is known to play a role in the wild-type winner cells during polarity-impaired cell competition [53], it is unclear whether JAK–STAT signalling has a role within the polarity-impaired loser cells. Therefore, using MARCM techniques, the authors investigated the requirement of JAK–STAT signalling in the competitiveness of polarity-impaired cells, and whether this occurs downstream of PTP61F.
RNAi against Stat92E (v43866) was used to determine whether JAK–STAT signalling is necessary for scrib-mutant clone elimination. Eye-antennal discs expressing Stat92ERNAi had clones contributing to ~20% of the tissue volume, a significantly smaller fraction than the wild-type controls at ~40% (compare Figure 3A,C, quantified in Figure 3I), consistent with Stat92E influencing clonal fitness. Similarly, discs with Stat92ERNAi-expressing scrib1/1 clones contributed to ~5% of the tissue volume, which was a significantly smaller proportion than the scrib1/1 controls at ~11% (compare Figure 3E,G, quantified in Figure 3I). These data suggest that STAT92E functions within scrib-mutant clones during cell competition to oppose their elimination.
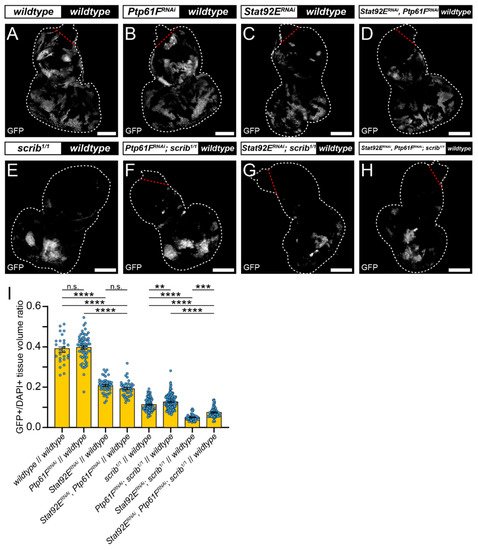
Figure 3. Stat92E is required for rescue of scrib-mutant clone size by Ptp61F knockdown. (A–H) Confocal images of L3 eye-antennal imaginal discs of the indicated genotypes (boxes at top, white indicates GFP-positive clones, black indicates remaining GFP-negative tissue) taken from animals where clones were generated via MARCM to express transgenes in GFP-positive cells. (A–D) Wild-type clones (A) and Ptp61FRNAi-expressing (B) clones appear largely the same (for statistics see Figure 2). Stat92ERNAi expression in a wild-type background ((C); n = 48, = 0.208 ± 0.005) leads to significantly smaller clones compared to the wild-type control (one-way ANOVA ((F) (3,175) = 193.3, p < 0.0001), with Tukey’s multiple comparisons (p < 0.0001)), and combining Stat92E and Ptp61F knockdown in a wild-type background ((D); n = 41, = 0.192 ± 0.006) does not result in significantly different clone sizes to Stat92E knockdown alone (one-way ANOVA ((F) (3,175) = 193.3, p > 0.05), with Tukey’s multiple comparisons (p > 0.05)), but does significantly reduce the average clone size relative to Ptp61FRNAi clones (one-way ANOVA ((F) (3,175) = 193.3, p > 0.05), with Tukey’s multiple comparisons (p > 0.05)). (E–H) Clones homozygous mutant for scrib (E) have their reduced volume somewhat rescued by Ptp61F knockdown (F) (for statistics see Figure 2). Knockdown of Stat92E in a scrib-mutant background ((G); n = 51, = 0.050 ± 0.002) leads to clones that are significantly smaller in their contribution to the tissue volume than the scrib-mutant control (one-way ANOVA ((F) (3,342) = 97.72, p < 0.0001), with Tukey’s multiple comparisons (p < 0.0001)). Simultaneous knockdown of Stat92E and Ptp61F in scrib1/1 clones ((H); n = 63, = 0.075 ± 0.003) led to a statistically significant increase in clone volume relative to scrib-mutant, Stat92E knockdown clones (one-way ANOVA ((F) (3,342) = 97.72, p < 0.0001), with Tukey’s multiple comparisons (p < 0.001)), and also resulted in a statistically significant decrease in clone volume compared to scrib-mutant, Ptp61FRNAi-expressing clones (one-way ANOVA ((F) (3,342) = 97.72, p < 0.0001), with Tukey’s multiple comparisons (p < 0.0001)). (I) Quantification of the clone tissue volume contributions, as measured by the ratio of GFP-positive tissue to DAPI-positive tissue, showing that simultaneous Ptp61F and Stat92E knockdown significantly increases the size of scrib-mutant clones compared to Stat92E knockdown alone in scrib-mutant clones. Note that some sample sets here are taken from Figure 2, as the experiments were performed under the same conditions and soon afterwards allowing them to be utilised as controls. Note that Dcr-2 is also expressed wherever GFP is expressed. ** = p < 0.01, *** = p < 0.001, **** = p < 0.0001. Error bars = S.E.M. Confocal microscopy images are single planes. White dotted lines outline the tissue, red dotted lines indicate tissue excluded from quantification for consistency. Scale bars = 100 μm.
Next, it was examined whether elevated JAK–STAT signalling was driving scrib-mutant clone growth suppression upon Ptp61F knockdown. To analyse this Stat92E and Ptp61F were both knocked down in MARCM-generated clonal tissue. In otherwise wild-type clones, expression of both Stat92ERNAi and Ptp61FRNAi resulted in clones that contributed to ~20% of the tissue, a non-significant effect relative to the Stat92E knockdown alone (also ~20%; compare Figure 3C,D, quantified in Figure 3I). However, these clones were significantly smaller than the Ptp61FRNAi-only clones (tissue volume of ~40%; compare Figure 3B,D, quantified in Figure 3I). By contrast, in scrib-mutant clones (which contribute to 11% of the tissue), simultaneous Ptp61F and Stat92E knockdown led to clones contributing to ~7% of the tissue, a statistically significant decrease in clonal tissue volume compared to scrib-mutant Ptp61F knockdown-only clones at ~13% (compare Figure 3F,H, quantified in Figure 3I), revealing a requirement for Stat92E in the Ptp61F-knockdown-mediated rescue of scrib-mutant clone size. In comparison with scrib-mutant Stat92E knockdown-only clones, which made up only ~5% of the tissue, simultaneous Ptp61F and Stat92E knockdown in scrib-mutant clones resulted in a statistically significant increase to 7% in clonal tissue volume (compare Figure 3G,H, quantified in Figure 3I), showing that the presence of Ptp61F contributes to the competitive disadvantage of scrib-mutant Stat92E knockdown clones. Together, these data show that STAT92E levels influence the survival of scrib-mutant clones, and that the increased survival of scrib-mutant clones upon Ptp61F knockdown is dependent on Stat92E.
This entry is adapted from the peer-reviewed paper 10.3390/ijms222312732
This entry is offline, you can click here to edit this entry!