Crystallization of LiNbO3: History
Please note this is an old version of this entry, which may differ significantly from the current revision.
Contributor:

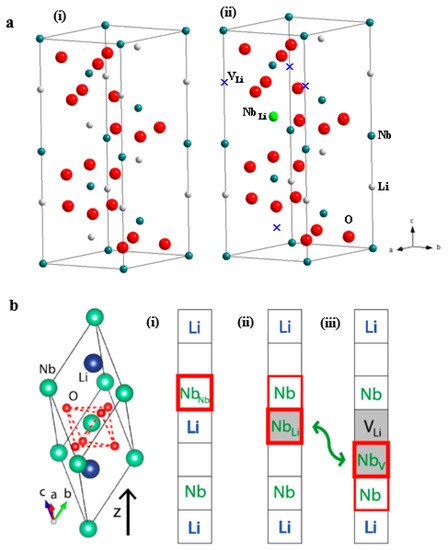
Due to its piezoelectric, ferroelectric, nonlinear optics, and pyroelectric properties, LiNbO3 crystal has found its wide applications in surface acoustic wave (SAW) devices, optical waveguides, optical modulators, and second-harmonic generators (SHG). LiNbO3 crystallized as R3c space group below Curie temperature shows spontaneous polarization that leads to its ferroelectric and piezoelectric properties. Physical and chemical characteristics of LiNbO3 are mainly determined by Li/Nb ratio, impurity cations, vacancies in a cation sublattice. Different sizes of LiNbO3 ranging from nanoscale and microscale to bulk size have been synthesized by solid state method, hydrothermal/solvothermal method, Czochralski (Cz) growth method, etc. Most basic and applied studies of LiNbO3 focus on its bulk single crystal.

  • LiNbO3
  • crystal growth
  • piezoelectric property
  • optical property

1. Crystal and Defect Structures of LiNbO3

Crystal structure of LiNbO3 can be described as hexagonal unit cells (Figure 1a) or rhombohedral unit cells [16,17]. In stoichiometric LiNbO3, along c row direction, the O octahedral interstitials are filled by Li ions (one-third), Nb ions (one-third), and empty (one-third), forming –Li–Nb–▯–Li–Nb– sequence [18,19,20]. Much experimental and simulation effort have been made in the past in order to understand the defect structure in LN crystal [8]. Several defect models have been constructed—i.e., oxygen vacancy model, niobium vacancy model ([Li1−5xNb5x][Nb1−4xV4x]O3), and lithium vacancy model ([Li1−5xV4xNbx]NbO3) [18,19,20]. Congruent LiNbO3 crystals were grown with LiCO3 and Nb2O5 as starting materials, which contain a high concentration of Nb anti-sites (NbLi4+) and Li vacancies (VLi) (Figure 1a(ii)) [21]. Owing to atomic radius differences between Nb and Li, it forbids Li replacement in a Nb site. Thus, the composition deviates from stoichiometric only toward the Nb-rich side [22,23]. The Li vacancy model is mostly accepted nowadays thanks to a great number of investigations, some of them very important and performed in the 1990s. This is given in detail in [8]. Since these defects are charged, further defects with counter charges are required in order to guarantee overall charge neutrality [23]. Thus, for energetic reasons, complex ionic complexes and spaced clusters are present as shown in Figure 1b [17]. However, debate still prevails on the available models on defect clusters. The understanding and control of LiNbO3 intrinsic and extrinsic defects during crystallization and operational process is important for specific applications.
Figure 1. (a) Crystal structures of stoichiometric LiNbO3 (i) and congruent LN with anti-site NbLi4+ and VLi defects (ii) [22]; (b) Free and defect-bound (bi)polarons in LiNbO3 [17].

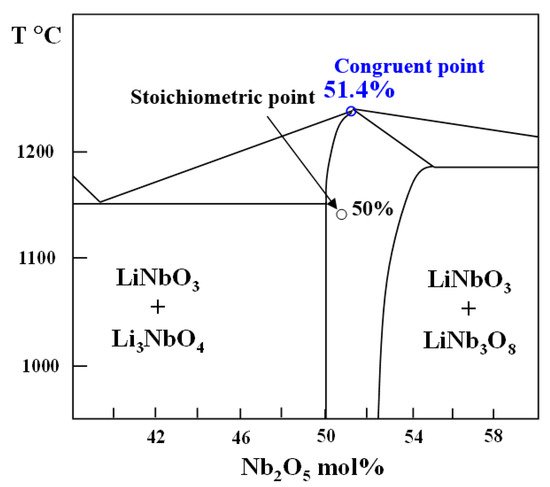
2. Crystallization of LiNbO3

According to binary phase diagram, LiNbO3 has a large solid solution range, which can exist and be stable on Li composition from 46.5 mol% to 50 mol% (Figure 2). The liquid–solid curve reveals a diffuse maximum at approximately 48.6% Li2O [24]. With exceeding composition range, the secondary LiNb3O8 and Li3NbO4 phases can be created. The binary phase diagram can be determined by measuring XRD of different samples along solid lines. However, it is also needed to probe precise composition range, because LiNbO3’s bulk properties are composition dependent [25].
Figure 2. Schematic equilibrium phase diagram of binary system of Li2O and Nb2O5 m in the vicinity of LiNbO3.
LiNbO3 polycrystalline can be grown by solid-state reaction, sol–gel, hydrothermal, vapor phase methods. The crystallization method of LiNbO3 single crystal includes Cz, Bridgeman, high-temperature top-seeded solution growth. Cz method is the current mainstream technology for growing bulk LiNbO3 single crystal [26,27,28]. With LiNbO3 polycrystalline as starting materials, the Cz crystal growth is often controlled by the pulling/rotation rate and heater power [29,30]. The growth of LiNbO3 crystal was affected by various factors together, such as the ratio of raw materials, quality of seed crystal, temperature gradient, growth parameters, etc. [24]. In reality, the Li evaporation at high temperature is hard to be eliminated, which results in the segregation of Li content inside the as-grown crystal. Congruent LiNbO3 with good compositional uniformity can be formed with Li content can range from 47 to 50 mol%. Nearly stoichiometric LiNbO3 composition can be achieved by more elaborate growth processes.
A slower pulling rate is helpful to obtain a crystal with less internal stress and high quality. Table 1 shows pulling rate and rotation rate [26,27,28,29,30]. Recently, 6-inch LiNbO3 crystals have been grown with a rotation rate of 5~10 rpm, and the pulling rate of 1–2 mm/h [26]. The obtained 6-inch LiNbO3 crystal shows good homogeneity with the absolute deviation of Curie temperature ≤1.3 °C. In addition, fast growth rate can lead to low-cost LiNbO3 crystal, which is important for industry production. Thus, under the premise of ensuring quality, fast pulling rate is also demanded.
Table 1. Growth parameters of LiNbO3 reported in literatures.
Pulling Rate (mm/h) Rotation Rate (rpm) Size ϕ × l (mm) Li Content (mol%/cm) Ref.
1–2 5–10 153 × 110 Δ[Li2O] ≈ 0.001 [26]
0.3–3 20–35 8 × 10 - [27]
1 7 30 × 50 - [28]
0.4–1.5 10–30 50 × 30 Δ[Li2O] < 0.005 [29]
1–2.5 10–25 80 × 60 Δ[Li2O] < 0.02 [30]
2.8–4.0 3–10 100 × 80 Δ[Li2O] < 0.002 [22]

3. Composition Characterizations of LiNbO3

The performances of LiNbO3 are most depend upon their chemical composition. Therefore, the development of the precise analysis method to detect the chemical composition (Li content) of LiNbO3 is very important. Table 2 shows available testing methods for determine Li content of LiNbO3, for example, X-ray diffraction (XRD), Raman spectroscopy (RS), UV–vis diffuse reflectance (DR), and differential thermal analysis (DTA) [31,32,33,34,35,36].
Table 2. Testing method of Li composition for LiNbO3.
Testing Method Advantages Disadvantages
Raman scattering method Raman systems have become cheaper and easier to use The use of a correct configuration of the detection and excitation polarizers (in the case of single crystals)
Curie temperature Linearly with Li/[Li + Nb] ratio
Reliable and sufficient sensitivity for composition
High Curie temperature close to the melting point
UV absorption edge Convenient and accurate way for determining the composition Nonlinear relationship
Accuracy is governed by the wavelength calibration
Doping compound will deteriorate the accuracy
Refractive indices Function of wavelength and stoichiometry Nonlinear relationship
Birefringence Approximately linear correspondence between Li content and birefringence The nonlinear relationships dominated by the wavelength
In Raman spectroscopy, the Li content can be calculated according to the linewidth (Γ) at 876 cm−1 [37,38,39].
CLi = 53.29–0.1837Γ                   
The Li content of LiNbO3 can be also calculated via measuring Curie temperature
CLi = 17.37 + 0.02725Tc                 
where Tc is Curie temperature in °C. Curie temperature is the temperature at which LiNbO3 tends to lose its ferroelectric properties. When use above reported characterizations, the applicability and calibration method need to be concerned. Some indirect optical and non-optical methods for the determination of the chemical composition of LN single crystals can be referred to [8].

This entry is adapted from the peer-reviewed paper 10.3390/molecules26227044

This entry is offline, you can click here to edit this entry!