Your browser does not fully support modern features. Please upgrade for a smoother experience.
Please note this is an old version of this entry, which may differ significantly from the current revision.
Subjects:
Biochemical Research Methods
Bacuri (Platonia insignis Mart) is a species from the Clusiaceae genus. Its fruit pulp is commonly used in South America in several food products, such as beverages, ice cream and candies. Only the pulp of the fruit is used, and the peels and seeds are considered waste from these industries.
- bacuri
- Amazonia
- Platonia insignis
- antioxidants
- prenylated benzophenones
- food residues
1. Introduction
Bacuri is a South American species of Clusiaceae named Platonia insignis Mart. It is found from Paraguay to Suriname and is widely distributed in the Amazon and Cerrado biomes [1]. The fruit is famous for its pleasant and bittersweet taste, being largely consumed in food products such as beverages, ice cream and candies, for its sensorial attributes and for its remarkable biological properties [2,3]. Despite its commercial potential, its production still relies on extractivism, with an annual production of 3,061 tonnes of fresh fruit in 2017 [4,5]. The pulp used in the production of food comprises only 26% of the fresh fruit’s weight, with the other 58% of the weight considered waste [5,6,7]. This significant waste of biomass could be used to improve the local bioeconomy and develop new bioproducts, as several studies reported that P. insignis’s volatile fractions and the polar extracts of its seeds are rich in antioxidant, anti-inflammatory, anticonvulsant, antiparasitic, hypotensive and immunoregulatory compounds [1,2,3,8]. Moreover, the chemical profile of the bioproduct highlights terpenes and phenolic compounds as its main bioactive compounds [9,10].
Phenolic compounds are of great interest to industry due to their antioxidant potential. The food and cosmetics industries, in particular, have been using them as food preservatives and active agents for antiaging skin creams, respectively. In addition, they are also used in so-called healthy foods as well as the treatment of diseases resulting from the action of free radicals [3,11]. Fruit peels and seeds, which are generally not used in industrial processes, may be promising sources of phenolic substances. However, there are still few initiatives to develop processes so that industries can use this waste. For instance, none of the published research of P. insignis has aimed to determine better processing methods to add value to its agro-industrial waste. The studies on Amazonian biodiversity still rely mainly on chemical characterization [12,13], searching for patterns [14] or drug development based on traditional knowledge [15].
The optimization of extraction processes of biologically active substances is a procedure that has become considerably more common in recent years [16,17,18], and the search for sustainable, efficient and selective extraction methods is one of the main goals of industry. Generally, the effectiveness of the extraction of phenolic compounds from natural products is influenced by multiple factors, such as extraction temperature, time, water-to-raw-material ratio, pressure, and type of solvent.
2. Crude Extraction Yield
The crude extraction yield (CEY) was significantly influenced by the solvent-water ratio. Mesocarp samples (MS) presented a higher CEY (36.63%) than any epicarp samples, highlighting the different chemical compositions of each fruit part. For MS, most of the tested methods presented an increasing pattern of CEY until 100% ethanol was used as the extraction solvent. An exception was observed for acid sonication, in which the highest CEY was obtained with 80% ethanol (Table 1). Methods applied to epicarp samples (ES) were distinctively influenced by the percentage of ethanol in the extraction solvent. Maceration methods presented an increasing CEY until 80% ethanol, while ultrasonic-based methods decreased CEY linearly as more ethanol was used in the extraction solvent (Table 1). The different behaviour observed in sonication methods may be associated with the increase in the extraction solvent viscosity caused by the addition of ethanol, which reduces the cavitation process within the solvent [31]. Of the tested methods, the maceration techniques showed the highest extraction yields for both sample types. The CEY of maceration methods was also significantly influenced by the extraction temperature of the extraction method. When 80% ethanol (which was the solvent that produced the highest CEY of ES) was used, the highest temperature increased CEY by approximately 20% for both sample types (Table 1).
Table 1. Results of extractions carried out with different methods at different ethanol percentages in water on the mesocarp and epicarp of bacuri.
| Sample | Extraction Method | % of Ethanol | Crude Extraction Yield (%) ± SD | Total Phenolic Compounds (% w/w ± SD) |
Total Flavonoids (% w/w ± SD) | Antioxidant Capacity Assays (% of Inhibition) |
|
|---|---|---|---|---|---|---|---|
| DPPH | ABTS | ||||||
| Mesocarp | Cold maceration | 100 | 30.18 ± 1.45 | 14.60 ± 0.42 | 14.51 ± 0.24 | 77.34 ± 2.13 | 74.09 ± 1.48 ** |
| 80 | 28.22 ± 1.28 | 9.59 ± 0.50 | 10.06 ± 0.36 | 58.16 ± 2.29 | 44.12 ± 3.21 | ||
| 50 | 22.16 ± 1.52 | 5.23 ± 0.30 | 2.54 ± 0.19 | 33.91 ± 1.78 | 25.80 ± 1.47 | ||
| 20 | 13.49 ± 0.61 | 2.64 ± 0.16 | 1.12 ± 0.08 | 15.14 ± 0.76 | 10.06 ± 0.42 | ||
| Hot maceration | 100 | 36.63 ± 0.55 | 15.80 ± 0.83 | 15.05 ± 0.80 | 74.81 ± 1.25 | 73.31 ± 1.21 ** | |
| 80 | 31.95 ± 2.03 | 12.34 ± 0.04 | 12.50 ± 0.42 | 61.10 ± 1.17 | 48.91 ± 3.37 | ||
| 50 | 27.62 ± 0.26 | 6.86 ± 0.30 | 3.72 ± 0.19 | 33.75 ± 1.72 | 24.26 ± 1.18 | ||
| 20 | 20.49 ± 0.85 | 3.64 ± 0.14 | 1.64 ± 0.10 | 16.72 ± 0.78 | 9.95 ± 0.31 | ||
| Neutral sonication | 100 | 27.88 ± 1.36 | 14.12 ± 0.72 | 12.93 ± 0.42 | 72.78 ± 1.16 | 70.38 ± 1.55 | |
| 80 | 25.62 ± 0.62 | 11.50 ± 0.48 | 11.26 ± 0.99 | 54.30 ± 1.12 | 51.05 ± 2.50 | ||
| 50 | 24.26 ± 0.25 | 6.42 ± 0.59 | 4.29 ± 0.15 | 34.26 ± 1.71 | 24.27 ± 1.23 | ||
| 20 | 19.84 ± 0.73 | 2.86 ± 0.23 | 0.97 ± 0.04 | 10.18 ± 0.94 | 8.59 ± 0.66 | ||
| Acid sonication | 100 | 16.98 ± 0.69 | 14.31 ± 0.53 | 13.95 ± 0.62 | 74.14 ± 1.31 | 73.49 ± 2.82 ** | |
| 80 | 18.25 ± 1.34 | 10.22 ± 0.54 | 10.87 ± 0.48 | 54.61 ± 4.20 | 39.18 ± 1.80 | ||
| 50 | 14.95 ± 0.61 | 6.38 ± 0.46 | 6.18 ± 0.41 | 35.02 ± 1.42 | 20.48 ± 1.10 | ||
| 20 | 11.70 ± 0.49 | 3.58 ± 0.19 | 1.06 ± 0.03 | 14.96 ± 1.02 | 10.19 ± 0.41 | ||
| Epicarp | Cold maceration | 100 | 10.90 ± 0.26 | 6.51 ± 0.41 | 2.85 ± 0.15 | 52.14 ± 2.23 | 54.89 ± 1.92 |
| 80 | 17.32 ± 0.56 | 5.47 ± 0.25 | 2.03 ± 0.11 | 34.56 ± 1.78 | 32.90 ± 1.08 | ||
| 50 | 15.79 ± 0.76 | 3.56 ± 0.22 | 1.04 ± 0.09 | 15.47 ± 1.00 | 14.69 ± 0.96 | ||
| 20 | 8.85 ± 0.29 | 3.57 ± 0.18 | 0.68 ± 0.04 | 5.07 ± 0.39 | 9.08 ± 0.59 | ||
| Hot maceration | 100 | 12.69 ± 0.53 | 7.02 ± 0.31 | 3.97 ± 0.23 | 53.36 ± 2.37 | 58.58 ± 2.62 | |
| 80 | 14.47 ± 0.83 | 5.15 ± 0.37 | 2.37 ± 0.16 | 38.84 ± 1.94 | 38.87 ± 0.42 | ||
| 50 | 13.38 ± 0.58 | 4.70 ± 0.26 | 1.09 ± 0.09 | 25.05 ± 1.54 | 17.15 ± 1.06 | ||
| 20 | 10.66 ± 0.59 | 4.40 ± 0.27 | 0.61 ± 0.04 | 13.08 ± 1.03 | 9.12 ± 0.44 | ||
| Neutral sonication | 100 | 4.84 ± 0.23 | 7.14 ± 0.39 | 6.95 ± 0.30 | 53.77 ± 1.75 | 56.44 ± 0.36 | |
| 80 | 7.80 ± 0.38 | 6.24 ± 0.23 | 4.92 ± 0.20 | 46.00 ± 2.33 | 39.99 ± 1.59 | ||
| 50 | 10.94 ± 0.69 | 5.35 ± 0.29 | 2.99 ± 0.16 | 30.06 ± 2.35 | 18.17 ± 0.68 | ||
| 20 | 13.73 ± 0.74 | 3.27 ± 0.15 | 0.57 ± 0.04 | 12.23 ± 0.71 | 7.81 ± 0.54 | ||
| Acid sonication | 100 | 6.40 ± 0.39 | 7.22 ± 0.16 | 6.51 ± 0.39 | 55.91 ± 0.86 | 60.23 ± 2.52 | |
| 80 | 7.97 ± 0.07 | 6.62 ± 0.31 | 3.58 ± 0.25 | 42.63 ± 2.89 | 41.75 ± 2.48 | ||
| 50 | 10.72 ± 0.32 | 6.58 ± 0.32 | 2.92 ± 0.25 | 30.52 ± 0.75 | 22.08 ± 1.23 | ||
| 20 | 13.19 ± 0.87 | 4.02 ± 0.08 | 0.59 ± 0.03 | 14.65 ± 0.93 | 11.00 ± 0.84 | ||
SD = standard deviation ** Not statistically significant difference. The highest values for each response are written in bold.
3. Chemical Characterization
The ethanolic extracts of epicarp and mesocarp were partitioned with medium polarity solvents (dichloromethane and ethyl acetate) and fractionated using chromatographic techniques to isolate the major compounds of these residues. Different open-column chromatography fractionations with silica gel and low-to-medium polarity solvents were performed, which returned the isolation of two substances, with one returned from each bacuri fruit part. The substances were evaluated by mass spectrometry and nuclear magnetic resonance, showing similar structures and the same low resolution molecular mass: prenylated benzophenones with mass 602 u.m.a. In samples from the epicarp, the tautomers from garcinielliptone (Figure 1) were detected using APCI mass spectrometry with m/z 603 (positive mode) and m/z 601 (negative mode). This is a common substance in the Clusiaceae family and Garcinia genus. The confirmation was performed by NMR experiments with 1H, 13C, HSQC and HMBC, the results of which were compared with literature data obtained in CDCl3 [32,33], together with the analysis of the fragments m/z 465 and m/z 409 observed by MSn from m/z 601 ionized in APCI (-) [34].
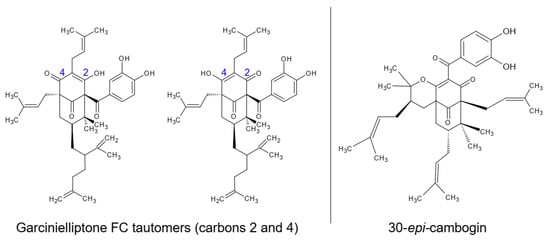
Figure 1. Identified prenylated benzophenones on epicarp (garcinielliptone FC tautomers) and mesocarp (30-epi-cambogin).
From the mesocarp, another prenylated benzophenone, 30-epi-cambogin, was isolated. With the same molecular mass, 602 u.m.a., MSn from m/z 601 ionized in APCI (-) allowed the observation of fragments such as m/z 136, which is typical from phloroglucinol units. The confirmation was also performed by 1H, 13C, HSQC and HMBC NMR experiments, the results of which were compared with literature data (obtained in CD3OD) [35].
4. Evaluation of Phenolic Composition and Antioxidant Capacity
Phenolic and flavonoid compounds are known antioxidants agents that are capable of inhibiting the oxidation of low-density lipoproteins and stabilizing unstable radicals. Therefore, their content can be used to assess the nutritional value and biological properties of different matrices [1,4,5]. To evaluate the effects of the extraction methods and solvent compositions on the total flavonoid content, total phenolic content and antioxidant capacity, it was first evaluated whether these response variables have high linear correlation (nominal correlation higher than 0.800) using multivariate analysis (MANOVA). High correlation can provide insight if response variables are independent from each other and also highlight which statistical methods is better suited for analysing the data. Correlation between each response variable was weak within both sample types during MANOVA (Table 2), indicating the need for individual analysis instead of multivariate. Thus, an individual factorial experimental design was adopted for each of these response variables.
Table 2. Multivariate analysis correlation matrix of the response variables screened.
| Mesocarp Samples | Epicarp Samples | |||||||||
|---|---|---|---|---|---|---|---|---|---|---|
| Response-variables | TFC | TPC | CEY | DPPH | ABTS | TFC | TPC | CEY | DPPH | ABTS |
| TFC | 1.0000 | −0.0104 | 0.1124 | 0.2391 | −0.0035 | 1.0000 | −0.0021 | 0.1067 | 0.1312 | 0.2697 |
| TPC | −0.0104 | 1.0000 | −0.3430 | −0.0510 | 0.0334 | −0.0021 | 1.0000 | 0.1552 | −0.1947 | 0.3763 |
| CEY | 0.1124 | −0.3430 | 1.0000 | −0.0862 | 0.0992 | 0.1067 | 0.1552 | 1.0000 | 0.0352 | 0.1225 |
| DPPH | 0.2391 | −0.0510 | −0.0862 | 1.0000 | −0.0684 | 0.1312 | −0.1947 | 0.0352 | 1.0000 | 0.0299 |
| ABTS | −0.0035 | 0.0334 | 0.0992 | −0.0684 | 1.0000 | 0.2697 | 0.3763 | 0.1225 | 0.0299 | 1.0000 |
TPC = Total phenolic content; TFC = Total flavonoid content; CEY = Crude extraction yield; DPPH = Antioxidant capacity by DDPH assay; ABTS = Antioxidant capacity by DDPH assay.
Since the correlation of response variables by multivariate statistic was weak (Table 2), univariate analysis of variance (ANOVA) was conducted. ANOVA demonstrated that within each response variable there was a significant interaction effect between the extraction method and solvent composition, with p-value < 0.0001, indicating the possibility to screening method performance through response surface methods.
Response surface methodology demonstrated that the extraction method, temperature and pH did not significantly affect the results of mesocarp extraction, producing plane-like surfaces (Figure 2). Total phenolic content, total flavonoid content, and antioxidant activities of DPPH and ABTS assays exhibited qualitatively the same pattern observed for the crude extraction yield, with almost all linearly increasing as ethanol proportion in the solvent increased from 20 to 100%. These increases were 4.7-fold (Figure 2a), 13-fold (Figure 2b), 5-fold (Figure 2c) and 7-fold (Figure 2d), respectively, which suggests that these classes of compounds are linked to the matrix through different types of bonds. Such increases can be related, in general, to the ability of ethanol to induce disruption of vegetable cell membranes, thereby enhancing solvent permeability into the solid matrix [36]. The more effective the extraction of phenolic compounds and flavonoids, the stronger the antioxidant activity almost regardless of their detection method.
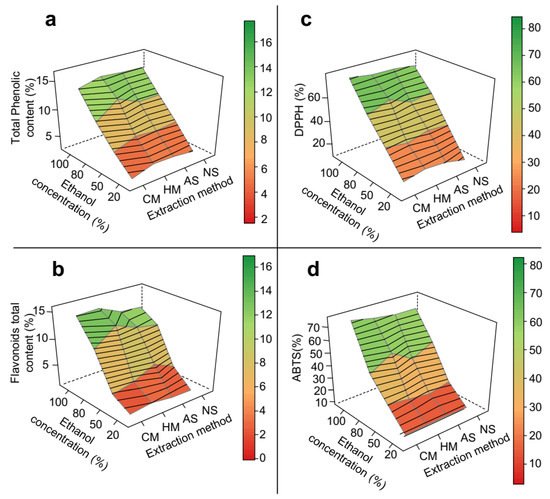
Figure 2. 3D response surface graph of the optimization of phenolic extraction from P. insignis mesocarp. (a) Total phenolic, (b) Total flavonoid, (c) DPPH, and (d) ABTS. CM = cold maceration; HM = hot maceration; AS = acid sonication; NS = neutral sonication; DPPH = Antioxidant capacity by DDPH assay; ABTS = Antioxidant capacity by DDPH assay.
In epicarp samples, the type of extraction method had a significant impact on the total content of both phenolic compounds (Figure 3a) and flavonoids (Figure 3b). Ultrasound methods produced higher yields of bioactive compounds compared to maceration methods. The ultrasound-assisted methods had as a major extraction mechanism, the sonication phenomenon, which produced soundwave shocks capable of disrupting plant cells, and thus facilitated the diffusion of the solvent into the plant matrix [31]. Even though the effects of the considered factors on the radical scavenging activity of epicarp samples were in general not statistically significant (Table 1), it was possible to observe an increase in the ABTS radical inhibition when ultrasound methods were applied (Figure 3d).
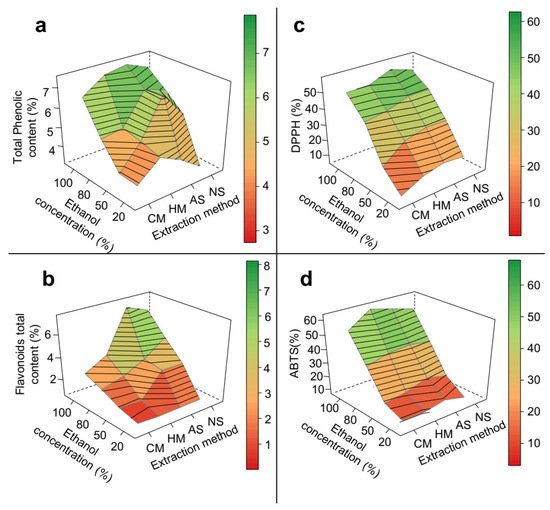
Figure 3. 3D response surface graph of the optimization of phenolic extraction from P. insignis epicarp. (a) Total phenolic, (b) Total flavonoid, (c) DPPH, and (d) ABTS. CM = cold maceration; HM = hot maceration; AS = acid sonication; NS = neutral sonication; DPPH = Antioxidant capacity by DDPH assay; ABTS = Antioxidant capacity by DDPH assay.
The different results obtained with AS and NS indicate that a change in the pH of the extraction solution interfered with ES extraction performance (Figure 3). In contrast to the extraction yield, there was a significant increase (approximately 13%) in the effectiveness of phenolic compound and flavonoid extraction when a more acidic medium was used for AS, but not for NS (Table 1, Figure 3). Similar results have been reported in the optimization of phenolics extraction from other plant matrices such as Citrus reticulata [37].
This entry is adapted from the peer-reviewed paper 10.3390/biom11121767
This entry is offline, you can click here to edit this entry!