Your browser does not fully support modern features. Please upgrade for a smoother experience.
Please note this is an old version of this entry, which may differ significantly from the current revision.
Subjects:
Biochemistry & Molecular Biology
Anorexia nervosa (AN) is a mental disorder characterized by an intense fear of weight gain that affects mainly young women. It courses with a negative body image leading to altered eating behaviors that have devastating physical, metabolic, and psychological consequences for the patients. Metabolomics is the comprehensive analysis of the metabolites included in a specific biological compartment at a specific time (metabolome). Metabolomics is proposed as a powerful tool for the elucidation of disease mechanisms and to provide new insights into the diagnosis, treatment, and prognosis of AN.
- anorexia
- metabolomics
- metabolic phenotype
- metabolism
- microbiota
- mass spectrometry
1. Metabolic Alterations in Anorexia Nervosa
Individuals with anorexia nervosa present severe metabolic disturbances as a consequence of abnormal eating behaviors. Alterations in biochemical parameters have been described in AN (cortisol, cholesterol, electrolytes, etc.). However, the metabolic phenotype or fingerprinting of AN has been scarcely studied. Predominantly, plasma and serum samples are analyzed due to the ease of sample acquisition and the information they provide about the metabolic status. Generally, studies are focused on small groups of metabolites such as amino acids, lipids, or carbohydrates. Hence, wide untargeted metabolomics analyses are still lacking in AN. The main metabolomics alterations found in plasma from AN patients are summarized in Figure 1 and detailed below.
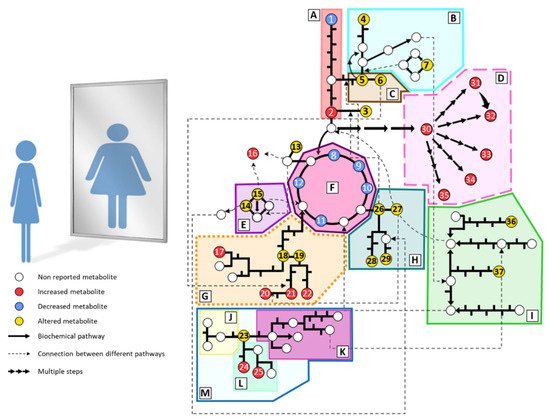
Figure 1. Summary of the main metabolomic alterations found in plasma or serum samples from AN patients in the included studies. Altered pathways: (A) glycolysis and gluconeogenesis, (B) methionine and cysteine metabolism, (C) serine and glycine metabolism, (D) lipid metabolism, (E) urea cycle, (F) tricarboxylate cycle, (G) phenylalanine and tyrosine metabolism, (H) glutamate, glutamine, proline and histidine metabolism, (I) branched-chain amino acids metabolism, (J) serotonin pathway, (K) kynurenine pathway, (L) indole pathway, (M) tryptophan metabolism. Metabolites: (1) glucose, (2) pyruvate, (3) alanine, (4) taurine, (5) serine, (6) glycine, (7) methionine, (8) citrate, (9) cis-aconitate, (10) isocitrate, (11) succinate, (12) malate, (13) asparagine, (14) ornithine, (15) arginine, (16) guanidinosuccinate, (17) p-cresyl sulfate, (18) tyrosine, (19) phenylalanine, (20) phenylacetylglutamine, (21) phenylacetate, (22) hippurate, (23) tryptophan, (24) indole-3-acetate, (25) indoxyl sulfate, (26) glutamate, (27) glutamine, (28) histidine, (29) proline, (30) fatty acids, (31) phosphatidylcholines, (32) lysophosphatidylcholines, (33) sphingomyelins, (34) acylcarnitines, (35) oxylipins, (36) leucine, (37) isoleucine.
2. Amino Acids
Amino acid dysregulation is usually found in patients with AN, probably related to chronic starvation and altered dietary habits. Some studies have analyzed the amino acid profile in AN patients and the results are inconsistent. However, only a few studies have used metabolomics to assess the amino acidic profile.
2.1. Plasma and Serum
M. Föcker et al. performed a targeted metabolomics assay to determine 163 metabolites in serum of acute patients, weight-restored patients, and controls. The analysis was done by FIA-MS/MS (Flow injection analysis with tandem mass spectrometry) using the AbsoluteIDQkit® p150 from Biocrates (Innsbruck, Austria). They found mild hyper aminoacidemia in patients, with significantly increased concentrations of glutamine, glycine, histidine, leucine, methionine, ornithine, phenylalanine, serine, and tryptophan [48]. However, in a second study a few years later with the AbsoluteIDQkit® p180, they only reported a significant increase in glutamine, glycine, histidine, serine, and tryptophan [47]. Surprisingly, they described more important metabolic alterations in the weight-restored patients than in the acute phase compared to controls, meaning either that the acute patients adapt to chronic starvation or that the rapid weight gain has a huge impact on metabolism.
Conversely, Miyata et al. studied serum amino acids of individuals with anorexia nervosa through an untargeted approach combining UPLC-MS and CE-MS. They found significantly lower values of alanine, asparagine, betaine, histidine, allo-isoleucine, isoleucine, leucine, methionine, proline, taurine, and tyrosine. They also described decreasing tendencies in some other amino acids such as arginine, aspartate, phenylalanine, serine, tryptophan, valine, and threonine. The authors mentioned increasing tendencies in the levels of glutamate, glutamine, glycine, and lysine, although they were not statistically significant. Cysteine levels were not assessed [51].
Burdo et al., in their study on plasma levels of carbon metabolism in AN, reported increased levels of betaine and no variation in methionine in acute patients compared with controls and recovered women [49], contrary to what Miyata et al. and M. Föcker et al. have described [48,51].
Salehi et al. performed a metabolomics study based on 1H NMR on serum samples. They compared the profile of acute AN patients (AN) with recovered patients (RecAN) and healthy controls. Five out of twenty-one metabolites were significantly different between the groups. Glutamine was higher in AN when compared to the other groups, but it did not show significant differences between healthy controls and RecAN. Threonine was significantly increased only in RecAN when compared with the AN group. Proline, alanine, serine, and glycine did not show significant variations between the groups [55].
2.2. Feces
Monteleone et al. performed an untargeted metabolomics assay by GC-MS of fecal samples in acute AN patients, weight restored patients, and healthy controls. They studied 224 identified metabolites, and phenylalanine was significantly decreased in weight-restored patients but acute patients had normal levels compared to healthy controls [57]. However, one year later, Monteleone et al. described decreased levels of phenylalanine, aspartate, serine, and methionine in acute and weight restored AN patients. Leucine was decreased but only in acute patients compared to healthy controls [58]. In 2021, this group performed a new study by using an untargeted metabolomics approach with GC-MS in fecal samples comparing both types of AN [37]. They found that isoleucine, leucine, valine, and pyroglutamate are decreased in both types of AN, but the AN-BP subtype presents lower levels than the restricting type compared to controls. Nonetheless, tyrosine and threonine were decreased in AN-R but increased in AN-BP patients.
Although the described amino acid disturbances are not consistent between studies, there is a clear disorder in the amino acidic profile of AN patients. Despite the direction of those variations, we can presume that the mechanisms for homeostasis of amino acids are altered in AN, which in turn leads to modified concentrations of these metabolites in patients. Free amino acid concentrations are the result of the relationship between the incoming sources of amino acid, which include dietary uptake, endogenous synthesis, and gut-bacteria metabolism, and amino acid depletion by protein synthesis and catabolism to increase energy uptake. The altered amino acid pattern is therefore associated with these processes, and whether it is a consequence of chronic starvation or a marked trait of AN that could play a role in the biological origin needs to be clarified.
3. Lipids
Alterations in the lipid profiles in the plasma, serum, and feces of AN patients have also been described. Distorted eating behaviors, related to fasting and reduction of carbohydrates and fats, produce massive disturbances in metabolism, increasing lipolysis, gluconeogenesis, fatty acid oxidation, and proteolysis [59]. These variations are reflected in the lipidome of individuals with anorexia nervosa. Different strategies have been used to assess the lipid profile in AN.
3.1. Plasma and Serum
Föcker et al. studied the serum lipidome by targeted metabolomics. In a first approach, they reported increased lipid concentrations in AN patients during acute starvation and after weight recovery compared to healthy controls. Glycerophospholipids, including phosphatidylcholines (PC), lysophosphatidylcholines (LPC) and sphingomyelins (SM) were significantly increased in patients (e.g., LPC(14:0), LPC(17:0), PC(32:2), PC(32:3), SM(16:0), SM(18:1). In addition, they also observed increased concentrations of some carnitines in serum of AN patients at both time points (e.g., carnitine, acetyl-carnitine) [48]. These results are consistent with previous studies that described the lipid profile of plasma in AN by non-metabolomics approaches [60]. However, Miyata et al. reported that by untargeted metabolomics lower concentrations of some acylcarnitines (AC), such as palmitoylcarnitine, butyrylcarnitine, O-acetylcarnitine, and octanoylcarnitine are observed [51]. Additionally, the changes found by Föcker et al. after renourishment therapy were higher than in the acute state, similar to that found with amino acids, meaning that metabolism is highly susceptible to maintained starvation but even more to the subsequent weight recovery [48]. Nonetheless, in a subsequent study, Föcker et al. found fewer differences between controls and the acute starvation state. The most significant changes were between the starvation state and short-term weight recovery. After complete renourishment therapy, the metabolome was restored, reaching values close to those of the healthy controls. Hence, metabolism seems to adapt to long starvation and renourishment processes, reaching stable metabolic states. The discordances between these studies were justified by the methodological differences and the small sample size in both cases. The most relevant findings in this second study are some compounds that are proposed as potential biomarkers of different states in disease and treatment of AN. These compounds showed significant associations with their respective states and homogeneous time-course behavior in the tested samples. For the starvation state, PC(34:4) and PC(38:3) are significantly decreased and are restored after therapy. In short-term weight recovery, LPC(16:1) and LPC(20:3) are increased, while PC(38:6) and pimelylcarnitine are decreased, suggesting that they could serve as possible markers of the metabolic state during renourishment therapies in AN [47].
Shih et al. used an untargeted metabolomics approach by using GC-MS for the determination of polyunsaturated fatty acids (PUFAs) and a targeted metabolomics analysis (HPLC-MS/MS) for oxylipins measurement in plasma. Oxylipins are derived from PUFAs by enzymatic (cyclooxygenases, lipoxygenases, and cytochrome P450) or non-enzymatic oxidations, and they are the most relevant mediators of PUFAs functions in the human body. The concentrations of the free fatty acids n-3 (alpha-linolenate-ALA, stearidonate-SDA, eicosapentaenoate-EPA, and docosahexaenoate-DHA) and n-6 (gamma-linolenate-GLA, dihomo-gamma-linolenate-DGLA, arachidonate-ARA, and osbond acid-OBA) were reported to be increased in the plasma of individuals with AN compared to controls. They analyzed the two major ratios between n-3 and n-6 PUFAs (LA (linolenate): ALA and ARA: EPA), which are significantly decreased in AN compared to controls. Moreover, those ratios were inversely correlated with anxiety in individuals with anorexia nervosa, and ARA: EPA was significantly correlated with BMI in patients as well. They also reported significant differences in individual oxylipins and oxylipins ratios. The eicosanoids significantly altered in AN included DHA and ARA metabolites, which belong to the CYP450 pathway. They also studied sEH (soluble epoxide hydrolase) activity which is an enzyme involved in the inactivation of epoxy-fatty acids from CYP catabolism of PUFAs. They finally suggested a greater in vivo activity, concentration, or efficiency of sEH in AN patients when compared to controls. The higher activity of this enzyme, involved in the CYP oxylipin pathway, has been related to increased inflammation and psychiatric disorders such as depression or anxiety, which are comorbidities of AN [61]. As a general overview, individuals with AN showed altered lipidome profiles that were correlated with increased neuroinflammation, anxiety disorders, and lower BMI [52,53].
Nguyen et al. also studied the plasma lipidic profile in acute and recovered individuals with anorexia nervosa compared to healthy controls at two different time points: fasting and postprandial. They examined 26 compounds, including saturated and unsaturated FA by GC-MS. Out of these 26 FA, AN patients presented significant increases in four species under fasting conditions and in only one of them after food intake. Similar to what Shih et al. described, laurate, EPA, and DPA (docosapentaenoate) were increased under fasting while ALA was increased at both timepoints in AN patients [52,56].
Bulant et al. analyzed the steroid profile of serum samples from 33 hospitalized women with AN. The aim was to determine the steroid variations after renourishment therapy. By GC-MS in selected ion monitoring (SIM) mode, they found significantly decreased concentrations of 7β-hydroxy-metabolites of C19Δ5steroids (7β-hydroxydehydroepiandrosterone and 5-androstene-3β,7β,17β-triol) which have been related to immunostimulation and anti-inflammatory properties. They also observed increased concentrations of the steroids at the beginning of the steroidogenic pathway, pregnenolone sulfate, and 20α-dihydro-pregnenolone sulfate after treatment [50].
3.2. Feces
Monteleone et al. determined the concentration of some FA in feces by GC-MS. They described lower levels of palmitate in AN-R and AN-BP when compared to healthy controls. Glycerol was also found to decrease in AN-R but not in AN-BP patients. Glycerol depletion can occur as a consequence of starvation due to shifts in the energy sources in carbohydrate deficiency [37]. Monteleone et al. also described increased concentrations of laurate as well as stearic and hydroxystearates in acute patients, but levels were restored after treatment [57].
Overall, the plasma/serum lipidome of individuals with AN is characterized by altered concentrations of n-3 and n-6 FA, glycerophospholipids (PC and LPC), sphingophospholipids (SM), carnitines (AC), steroids; and oxylipins [47,48,50,51,52,53,56]. Additionally, hypercholesterolemia and hyperlipoproteinemia have been widely described in AN patients [24,25,62]. Therefore, LPC, PC, and SM as components of lipoproteins are expected to increase, which is supported by some of the studies mentioned above [47,48]. Moreover, during starvation the lipolysis rate is increased to provide energy substrates for the organism. Hence, triglycerides are hydrolyzed, and FA are mobilized by AC to produce energy through β-oxidation. Therefore, it is plausible that there is an increase of FA and AC in starvation states [48,59,62]. Lipid metabolism is complex and highly variable and can be associated with the state of the disease, sex, age, and more importantly, diet. However, follow-up studies have shown that lipidic profiles are completely restored after treatment, supporting the existence of underlying alterations that need further research [62,63].
4. Sugars
4.1. Plasma and Serum
Carbohydrate profiles also differ in patients and controls. By using 1H NMR, Salehi et al. reported lower glucose levels in AN patients compared to controls, but it did not follow the same trend in the recovered patients [55]. In addition, the sum of hexoses determined by Föcker et al. was significantly decreased in acute patients compared to long-term treated patients and controls. In the short-term treated group, hexoses were diminished compared only to healthy controls [47]. In contrast, their previous study showed a higher concentration of hexose in acute and weight-restored patients than in healthy women. However, there were no differences between the patients, either in the acute phase or after treatment [48].
4.2. Feces
Monteleone et al. compared the fecal profile of AN-R and AN-BP patients to controls and found that allose, arabinose, lactose, rhamnose, scylloinositol, and xylose were decreased in both groups, but AN-BP presented lower levels when compared to controls. On the contrary, sorbose and tagatose levels were lower in the AN-R group, although both types of patients had significantly decreased concentrations. In summary, a general decrease of carbohydrates was found in the plasma of AN patients independently of their type [37]. Accordingly, in a previous study, they determined that fucose, rhamnose, and xylose were diminished in patients, but normal levels were recovered after renourishment therapy [57,58]. These authors also found that arabinose and tagatose were lower in acute patients, reaching the highest concentration after weight restoration [58].
Altered carbohydrate metabolism is expected in AN. The dietary habits in AN are usually characterized by a low intake of fat and carbohydrate, which makes the organism rely on other sources of energy. Carbohydrate depletion is generally described in undernutrition and starvation. Under fasting conditions, the physiological response involves glycogen breakdown to resort to glucose fuels, which are the main energy source for the cells. Thus, during the early stages of AN, we might find a temporary increase of the carbohydrates in blood that are rapidly consumed. Nevertheless, in chronic starvation, glycogen deposits are exhausted, and there is a shift towards lipolysis and muscle breakdown as energy sources [59].
5. Tricarboxylate Cycle
Profound metabolic alterations that affect energy metabolism will also impact the tricarboxylate (TCA) cycle. Therefore, disturbances in metabolites within this pathway have been found in AN.
5.1. Plasma and Serum
Miyata et al. reported lower levels of intermediates of the TCA cycle in the serum of individuals with AN compared to healthy controls, including malate, succinate, and cis-aconitate [51].
5.2. Feces
Likewise, Monteleone et al., in their study of fecal samples from AN patients, reported lower levels of malate in AN-BP and AN-R, while succinate was decreased in AN-R and increased in the AN-BP group [37].
6. Uremic Toxins
Miyata et al. performed a targeted metabolomics analysis of six uremic toxins in serum samples by LC-MS/MS. They found that all, p-cresyl sulfate, hippurate, indoxyl sulfate, indole-3-acetate, phenylacetate, and phenyl sulfate, were significantly higher in AN patients versus the control group. Moreover, by an untargeted approach, they were able to identify increased concentrations of another two toxins in the AN-R group: guanidinosuccinate and N2-phenylacetylglutamine. Although there was no signal of renal damage in the patients, uremic toxins were increased. As some gut microbiota species can produce uremic toxins, it has been suggested that this increase could be potentially linked to gut dysbiosis in AN patients [51].
7. Microbial Metabolites
Recent research has focused the attention on the gut-microbiota-brain axis. The impact of gut microbiota on health and disease has recently been described and appears to be an important biological factor in the development and maintenance of EDs. Gut microbiota is defined as the heterogeneous, unique, and dynamic ecosystem of the intestine that depends on complex interactions between genetic and environmental factors [21,64]. Its role in normal physiology and homeostasis is unquestionable. The microbiota is mainly constituted of bacteria, although there are other organisms such as archaea or protozoa. The composition is highly variable among individuals depending on endogenous and exogenous factors such as sex, age, physical activity, genetic features of the host, and infections, among others. However, it has been demonstrated that the predominant factor determining microbiota composition is the diet [36].
The numerous implications of gut microbiota on host health and wellness range from nutrient/energy metabolism to brain function and mood regulation pathways [65]. Moreover, complex direct and indirect interactions between the microbiota, gut, and brain, have been described constituting the termed “microbiota-gut-brain axis”; and microbiota appears to be involved in the regulation of behaviors and emotions, such as learning, stress, depression, and anxiety, that are common traits in AN [39,66].
Once established that the host diet is critical in the gut microbial composition [21] and that patients with EDs have altered nutritional patterns, it can be assumed that these patients will present a modified microbiota [39] and indeed, this has been described in AN. This dysbiosis results from starvation and malnutrition, but the impact on the onset and progression of the disease needs to be further elucidated [18,67,68,69,70,71,72]. Gut microbiota produces a set of bioactive molecules that can induce different responses in the host. Experimental data suggest that an important part of the circulating metabolites in the human body are derived from gut microbiota [73]. Some of these metabolites can interact with receptors in enteroendocrine cells (EECs), and some others can enter systemic circulation performing paracrine functions [74]. Among those metabolites, short-chain fatty acids (SCFAs), neurotransmitters, and lipopolysaccharides are widely studied due to their autocrine and paracrine effects.
To assess the putative effect of dysbiosis on the physiopathology of AN, a combined analytical strategy that determines the composition of the microbiota and its subproducts should be performed. Metabolomics tools can be applied to analyze the products of bacterial metabolism that develop important functions in the human body. To do so, the patient’s fecal sample constitutes a high-value specimen and should be analyzed. However, alterations in feces have been poorly studied for AN.
SCFAs, such as butyrate, propionate, and acetate, are one of the main products of bacterial metabolism. They come from the fermentation of non-digestible carbohydrates, fiber, and resistant starch. SCFAs can target the ENS stimulating the sympathetic nervous system, which is implicated in energy consumption [73,75].
P. Monteleone et al. and A.M. Monteleone et al. performed untargeted metabolomics of fecal samples by GC-MS. In their comparative analysis between both anorexia types, they found that acetate was decreased in AN-R patients but not in the AN-BP group [37]. Moreover, they described increased propionate in AN patients that is restored after treatment, contrary to butyrate that is unchanged in patients and decreases after weight recovery [57,58].
Prochazkova et al. performed a multi-omics study with fecal samples from individuals with AN before and after renourishment compared to healthy controls. They determined the composition of gut microbiota and performed targeted metabolomics assays for the analysis of fecal SCFAs and neurotransmitters. Butyrate, acetate, and propionate were analyzed by NMR while the neurotransmitters were determined by MS on selective reaction monitoring (SRM). Butyrate was diminished in the ill patients but showed partial recovery after renourishment therapies, although normal values were not achieved. On the contrary, propionate was significantly decreased in patients after treatment, but there were no significant differences in acute patients compared to controls. Acetate levels were significantly lower in both groups of patients, which implies that renourishment does not restore the normal SCFAs profile.
As suggested previously, the changes in fecal metabolites in patients with AN may result from either their chronic malnutrition and/or changes in their gut microbiota composition [37,57]. Regarding this, butyrate has been related to a reduction of anxiety and depressive-like symptoms and to lower neuroinflammation [76,77,78,79]. Thus, decreased butyrate levels might increase susceptibility to depressive-like symptoms. Moreover, the administration of the three SCFAs to mice showed decreased stress-related behaviors [78]. Propionate has also been found to exert direct functions in the central nervous system, it can cross the blood-brain barrier acting on different receptors related to the protection of neuroinflammation mainly [80].
Regarding neurotransmitters, ill patients showed a significant decrease in γ-aminobutyrate (GABA) and dopamine levels. A.M Monteleone et al. also reported significantly decreased GABA levels in both types of AN patients (AN-R and AN-BP) [37]. However, serotonin was only significantly lower in renourished patients. Contrary to expected, the comparison between the patients before and after weight restoration did not yield any significant variation. Tyramine, kynurenine, and hydroxytryptophan concentrations did not vary between groups and they did not change during the course of hospitalization. As a result, novel therapeutic approaches are required to be combined with renourishment to improve the metabolic state of patients [54].
This entry is adapted from the peer-reviewed paper 10.3390/nu13124249
This entry is offline, you can click here to edit this entry!