Your browser does not fully support modern features. Please upgrade for a smoother experience.
Please note this is an old version of this entry, which may differ significantly from the current revision.
Subjects:
Cell Biology
MyD88 is a dependent pathway for all TLRs to activate the NF-kB inflammation pathway. Activation of MyD88 pathway has been reported in hepatic fibrotic diseases. MyD88 deficiency significantly reduces liver fibrosis and decreases eosinophil percentage in vivo . Targeted deletion of B-cell-intrinsic MyD88 signaling resulted in reduced infiltration of migratory CD11c+ dendritic cells and Ly6C+ monocytes and hence reduced liver fibrosis . In addition, inhibition of MyD88 led to the inhibition of HSC activation in vitro .
- MyD88
- macrophage
- HSC
- liver fibrosis
- NLRP3
1. MyD88 Expression in Macrophages Is Upregulated during the Progression of Liver Fibrosis
To investigate the role of MyD88 during liver fibrosis, C57BL/6 mice were administered with CCl4. Liver tissues were harvested at various time points in the progression of liver fibrosis, as shown in Figure 1A. The degree of liver fibrosis was enhanced and collagen deposition was significantly increased in livers during the progression of liver fibrosis, as indicated by H&E staining and Sirius Red staining (Figure 1B,C). Double immunofluorescence staining revealed that MyD88 was highly expressed in F4/80+macrophagesin fibrotic liver tissues (Figure 1D,E). Then we isolated BMDMs from control and 4W CCL4 treated mice, qPCR analysis revealed that MyD88 and IL-1R were also increased significantly after CCl4 treatment (Figure 1F,G). In addition, qPCR analysis showed that IL-1R was decreased significantly in MyD88Lyz-KOmice (Figure 1G). The obtained results suggest that MyD88 is significantly upregulated in macrophages during the progression of liver fibrosis. These results suggest that MyD88 in macrophages may play an important role in liver fibrosis.
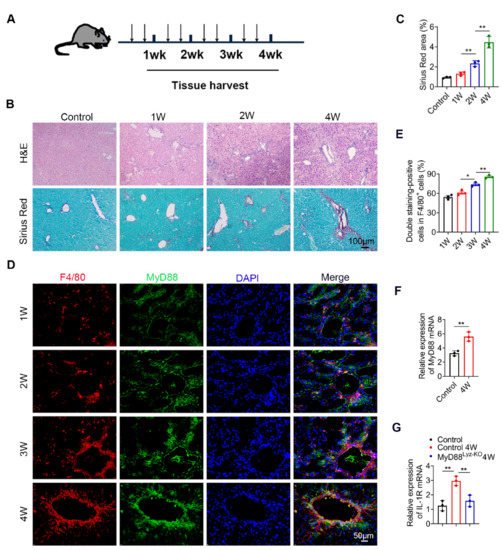
Figure 1. MyD88 expression in macrophages is upregulated during the progression of liver fibrosis. Groups of C57BL/6 mice (n = 5 per group) were subjected to CCl4-induced liver fibrosis. The data are representative of at least three independent experiments. (A) Schematic illustration of CCl4-induced liver fibrosis. (B) Liver tissues were harvested at the indicated time points and stained with H&E, Sirius Red. Scale bar, 100 μm. (C) Statistical analysis of Sirius Red staining in liver tissues. ** p < 0.01. (D,E) Representative double staining and statistical analysis of F4/80 and MyD88 in liver tissues. Scale bar, 50 μm. * p < 0.05 and ** p < 0.01. (F) Fold change of MyD88 mRNA in isolated BMDMs from control and 4W CCL4 treated mice. ** p < 0.01. (G) Fold change of IL-1R mRNA in isolated BMDMs. ** p < 0.01.
2. MyD88 Deficiency in Myeloid Cells Attenuates Liver Fibrosis in Mice
To evaluate the effect of MyD88 signaling in myeloid cells in liver fibrosis, we generated mice lacking MyD88 in myeloid cells (MyD88Lyz-KO mice). Transgenic mice expressing Cre recombinase from the lyz promoter were crossed with MyD88flox/flox mice. The lyz-Cre MyD88flox/flox conditional knockout mice were designated MyD88Lyz-KO mice, whereas their littermate single-transgenic mice were used as control mice. The absence of MyD88 in myeloid cells from the MyD88Lyz-KO mice was demonstrated by double immunofluorescence staining (Figure 2A,B). MyD88Lyz-KO mice and control mice were treated with CCl4 for 4 weeks. As shown in Figure 2C, the serum levels of ALT and AST were significantly decreased in CCl4-treated MyD88Lyz-KO mice compared to the CCl4-treated control mice. Furthermore, CCl4-treated MyD88Lyz-KO mice exhibited weakened liver injury and fibrosis compared with CCl4-treated control mice as assessed by H&E staining (Figure 2D) and Sirius Red staining (Figure 2E). Consistently, less hepatic expression of α-SMA and collagen I were found in CCl4-treated MyD88Lyz-KO mice (Figure 2F). These results indicate that MyD88 deletion in myeloid cells attenuates liver injury and inhibits CCl4-induced liver fibrosis.

Figure 2. Myeloid cell-specific MyD88 deletion attenuates CCl4-induced liver fibrosis. (A,B) Representative immunofluorescence analysis of MyD88 expression in macrophages and myofibroblasts from CCl4-treated control and MyD88Lyz-KO mice. F4/80 and α-SMA were used as cell-specific markers. Scale bar, 50 μm. (C–F) Groups of control and MyD88Lyz-KO mice (n = 5 per group) were subjected to CCl4-induced liver fibrosis. The data are representative of at least three independent experiments. (C) Serum ALT and AST levels. * p < 0.05 and ** p < 0.01. (D) Representative staining of H&E in liver tissues. Scale bar, 100 μm (left). Scale bar, 50 μm (right). (E) Liver tissues were harvested and stained with Sirius Red. Scale bar, 100 μm (left). Scale bar, 50 μm (right). Statistical analysis of Sirius Red staining in liver tissues. ** p < 0.01. (F) Representative staining and statistical analysis of α-SMA and collagen I in liver tissues. Scale bar, 50 μm. * p < 0.05 and ** p < 0.01.
3. MyD88 Deficiency in Myeloid Cells Decreases Inflammatory Cell Infiltration in the Liver
To explore whether MyD88 signaling in myeloid cells regulates inflammatory cell infiltration during fibrosis, F4/80, CD11b and Gr1 immunohistochemical staining and flow cytometry were performed to evaluate inflammatory cell infiltration. As shown in Figure 3A,B, the infiltration of CD11b+ macrophages and F4/80+ macrophages were prominently decreased in liver tissues from MyD88Lyz-KO mice compared with those from control mice following repetitive CCl4 injection. MyD88 deficiency in myeloid cells also reduced CCl4-induced Gr1+ neutrophil infiltration in livers compared with those in control mice. Furthermore, the qPCR analysis revealed that hepatic levels of the pro-inflammatory cytokines, such as TNF-α, IL-1β and IL-6, were also decreased significantly in MyD88Lyz-KOmice compared to those in control mice after CCl4 treatment (Figure 3C).
To determine whether and how MyD88 participated in the regulation of macrophage polarization, we first determined the effect of MyD88 deficiency on BMDMs polarized to M1 and M2 macrophages with LPS/IFN-γ and IL-4/IL-13, respectively (Figure 3D,E). As shown in Figure 3D, MyD88 deletion markedly suppressed the expression of the M1-specific marker genes IL-6, IL-12 and iNOS upon LPS/IFN-γ stimulation. In contrast, MyD88 deletion significantly enhanced the M2-specific marker genes IL-10, YM1 and Arg1upon IL-4/IL-13 stimulation (Figure 3E). Collectively, these results demonstrated that MyD88 deletion in macrophages attenuates the CCl4-induced inflammatory response.

Figure 3. Myeloid cell-specific MyD88 deletion attenuates the liver inflammatory response. Groups of control and MyD88Lyz-KO mice (n = 5 per group) were subjected to CCl4-induced liver fibrosis. The data are representative of at least three independent experiments. (A) Representative staining and statistical analysis of CD11b, F4/80, and Gr-1 in liver tissues. Scale bar, 50 μm. ** p < 0.01. (B) Isolation of liver lymphocytes from CCl4-induced control and MyD88Lyz-KO mice and flow cytometry analysis of the proportion of CD11b+F4/80+ macrophages and Gr-1+ neutrophils in the livers after staining with F4/80, CD11b, and Gr-1 antibodies, ** p < 0.01. (C) The mRNA levels of TNF-α, IL-1β and IL-6 in liver tissues were measured using qPCR analysis. * p < 0.05 and ** p < 0.01. (D) Fold change of IL-6, IL-12 and iNOS mRNA in control and MyD88Lyz-KO BMDMs polarized to M1 with LPS/IFN-γ for 24 h. ** p < 0.01. (E) Fold change of IL-10, YM1 and Arg1 mRNA in control and MyD88Lyz-KO BMDMs polarized to M2 with IL-4/IL-13 for 48 h. ** p < 0.01.
4. Specific Genetic Deletion of MyD88 in Macrophages Reduces CXCL2 Secretion
To further compare detailed changes in the gene expression signature, we performed protein-coding mRNA-seq analysis of liver tissues from CCl4-treated MyD88Lyz-KO mice and control mice. A total of 196 differentially expressed genes (DEGs) were identified, including 37 upregulated and 159 downregulated genes (Figure 4A; p < 0.05). Consistently, genes related to inflammation in control mice had higher expression compared with those in MyD88Lyz-KO mice. The top 30 differential expressed genes were selected to be shown in a heat map (Figure 4B). Next, Pathway analysis showed that MyD88Lyz-KO mice had significantly downregulated inflammation-related genes. In particular, the expression of CXCL2 was decreased significantly in CCl4-treated MyD88Lyz-KOmice compared with control mice (Figure 4C,D). qPCR analysis showed that the deletion of MyD88 partly suppressed LPS-induced CXCL2 expression in BMDMs (Figure 4E). The protein expression level of CXCL2 was further analyzed by ELISA of the BMDMs-conditioned media (CM). Deletion of MyD88 partly attenuated the expression of CXCL2 in LPS-induced BMDMs CM (Figure 4F). Consistent with all experimental results, the expression of CXCL2 in F4/80+cells was decreased significantly in MyD88Lyz-KO mice in fibrotic liver tissues (Figure 4G). Furthermore, serum ELISA analysis revealed that CCL4-treated MyD88Lyz-KOmice also significantly reduced CXCL2 secretion compared with control mice (Figure 4H). These results indicate that macrophage-derived CXCL2 may play important roles in the process of liver fibrosis.
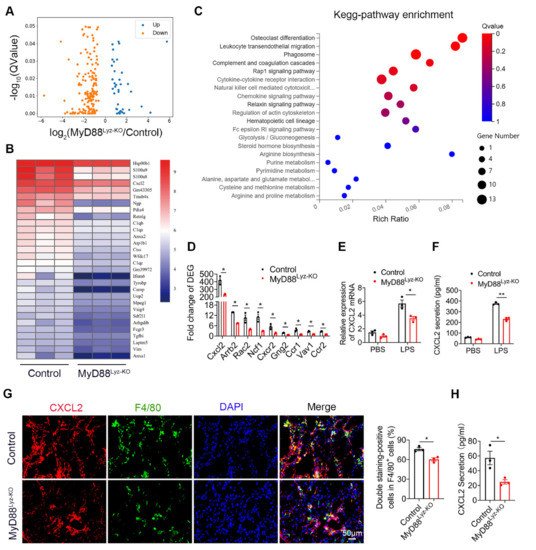
Figure 4. CXCL2 secreted by macrophages is critical for liver fibrosis. RNA sequencing analysis of DEGs between CCL4-induced liver tissues from control and MyD88Lyz-KO mice. (A) Volcano diagram of DEGs, the threshold is padj < 0.05. (B) Heatmap view of the most significant differential expressed genes. (C) KEGG enriched signal pathway analysis with up-regulated genes. (D) Analysis of fold change of DEGs, * p < 0.05. (E) The relative RNA expression of CXCL2 in LPS treated BMDMs were measured by q-PCR, * p < 0.05. (F) The secretory protein levels of CXCL2 in LPS treated BMDMs were measured by ELISA, ** p < 0.01. (G) Double immunofluorescence staining and statistical analysis for F4/80 and CXCL2 in liver tissues. Scale bar, 50 μm. * p < 0.05. (H) ELISA verification for serum CXCL2 levels in MyD88Lyz-KO or control mice treated with CCL4. * p < 0.05.
5. Macrophages Promote the Activation of HSCs by Secreting CXCL2
HSCs play important roles in liver fibrosis. We further investigated the effect of macrophage-derived CXCL2 on HSCs. To assess whether MyD88 in BMDMs could induce HSCs activation, human HSC cell line LX-2 cells were used and treated with the CM, which was collected from cultured BMDMs isolated from MyD88Lyz-KO or control mice treated with CCL4. Following incubation for 24 h, α-SMA expression was analyzed by immunostaining. MyD88 deficiency in BMDMs significantly decreased the expression of α-SMA in LX-2 cells (Figure 5A). qPCR analysis showed that expression of α-SMA and collagen I was also significantly decreased in LX-2 cells treated with CM of MyD88 deficiency in BMDMs (Figure 5B). The Western blot also revealed similar results (Figure 5C).
Since the deletion of MyD88 in macrophages decreases the secretion of CXCL2, we wondered whether MyD88 in macrophages promotes the activation of HSCs through CXCL2. Next, LX-2 cells were cultured with exogenous addition of CXCL2 recombinant protein for 24 h. We found that the levels of α-SMA were increased significantly compared to those in the untreated group by immunostaining (Figure 5D). Consistently, qPCR and Western blot also revealed similar results (Figure 5E,F). Furthermore, Western blot and qPCR revealed that LX-2 cells treated with exogenous CXCL2 co-cultured with BMDMs isolated from MyD88Lyz-KO mice rescue α-SMA expression and HSCs activation (Figure 5G,H). These results indicate that MyD88 in macrophages promotes the activation of HSCs by secreting CXCL2.
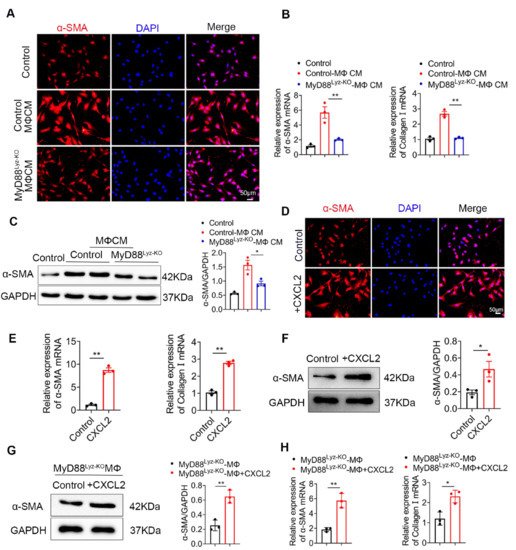
Figure 5. CXCL2 secreted by macrophages promotes the activation of HSCs. (A–C) LX-2 cells were cultured with control and MyD88Lyz-KO mice BMDM CM for 24 h. (A) Immunofluorescence staining for α-SMA in LX-2 cells. Scale bar, 50 μm. (B) The mRNA levels of the activation-related genes α-SMA and collagen I in LX-2 cells were measured using qPCR analysis. ** p < 0.01. (C) The protein levels of α-SMA in LX-2 cells were detected by Western blot. The densities of proteins were quantified by densitometry. α-SMA were normalized to GAPDH. * p < 0.05. (D–F) LX-2 cells were treated with CXCL2 for 24 h. (D) Immunofluorescence staining for α-SMA in LX-2 cells. Scale bar, 50 μm. (E) The mRNA levels of α-SMA and collagen I in LX-2 cells were measured using qPCR analysis. ** p < 0.01. (F) The protein levels of α-SMA in LX-2 cells were detected by Western blot. The densities of proteins were quantified by densitometry. α-SMA were normalized to GAPDH. * p < 0.05. (G,H) LX-2 cells treated with exogenous CXCL2 co-cultured with BMDMs isolated from MyD88Lyz-KO mice for 24 h. (G) The protein levels of α-SMA in LX-2 cells were detected by Western blot. The densities of proteins were quantified by densitometry. α-SMA were normalized to GAPDH. ** p < 0.01. (H) The mRNA levels of α-SMA and collagen I in LX-2 cells were measured using qPCR analysis. * p < 0.05 and ** p < 0.01.
6. CXCL2 Induced NLRP3 Inflammasome Activation in HSCs
Inflammasome activation had been associated with several chronic liver diseases, including fibrosis development [25]. Some studies reported that NLRP3 activation was required for hepatic inflammation and fibrosis [26,27]. We wonder whether the NLRP3 inflammasome activated in HSCs directly contributed to liver fibrosis development. As shown in Figure 6A, the activation of NLRP3 in α-SMA+ cells was significantly weakened in MyD88Lyz-KO mice in fibrotic liver tissues. Inhibition of inflammasome activation may be an important cause of attenuated liver fibrosis in mice with myeloid-specific deletion of MyD88. Then, the HSC cell line LX-2 cells were stimulated with BMDM CM of control and MyD88Lyz-KO mice and NLRP3 inflammasome related proteins were analyzed by Western blot. As a result, MyD88 deficiency in BMDMs significantly decreased the expression of NLRP3, Cleaved-Caspase 1 and ASC in LX-2 cells (Figure 6B). To further identify the molecular mechanisms underlying the effects of extracellular CXCL2 on the activation of the inflammasome, LX-2 cells were cultured with CXCL2 recombinant protein and NLRP3 inflammasome related proteins were analyzed by Western blot (Figure 6C). We found that NLRP3, Cleaved-Caspase 1 and ASC were significantly upregulated by CXCL2 protein. When NLRP3 activation was inhibited with NLRP3 inhibitor CY-09 in LX-2 cells, CXCL2-induced NLRP3, Cleaved-Caspase 1, ASC and α-SMA expression were weakened (Figure 6C). The results demonstrated that CXCL2 promotes HSC activation by activating NLRP3 inflammasome. Previous studies reported that NLRP3 puncta were formed on the outside of vesicle-like structures [28]. Furthermore, we also observed that in LX-2 cells stimulated with recombinant protein CXCL2, a number of giant vesicles appeared in the perinuclear (Figure 6D). Moreover, immunofluorescence staining showed that CXCL2 stimulation significantly enhanced the activation of NLRP3 in LX-2 cells (Figure 6E).
CXCL2 functions via its specific receptor CXCR2. Next, we test whether CXCL2-induced NLRP3 inflammasome in HSCs depends on CXCR2. As shown in Figure 6F, we observed the expression of CXCR2 on HSCs. Furthermore, we used a CXCR2-specific inhibitor (SB225002) to prevent CXCR2 activation in CXCL2-cultured HSCs. As a result, the CXCR2 inhibitor significantly inhibited NLRP3-mediated activation of HSCs (Figure 6G). These results showed that CXCL2 induces HSCs activation via NLRP3 inflammasome.
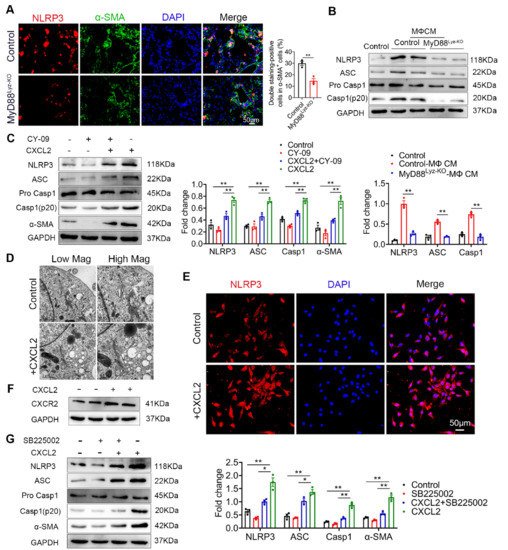
Figure 6. CXCL2 activates NLRP3 inflammasome in HSCs. (A) Groups of control and MyD88Lyz-KO mice (n = 5 per group) were subjected to CCl4-induced liver fibrosis. Double immunofluorescence staining and statistical analysis for NLRP3 and α-SMA in liver tissues. Scale bar, 50 μm. ** p < 0.01. (B) Control and MyD88Lyz-KO mice BMDM CM-treated LX-2 cells for 24 h; the expression levels of NLRP3 inflammasome-associated protein were detected by Western blot analysis. The densities of proteins were quantified by densitometry. NLRP3, Cleaved-Caspase 1 and ASC were normalized to GAPDH. ** p < 0.01. (C) After pretreatment of LX-2 cells with or without CY-09 (NLRP3 inhibitor) for 2 h, 200 ng/mL CXCL2 recombinant protein was incubated for 24 h, and the expression of NLRP3 inflammasome-associated protein was detected by Western blot analysis. The densities of proteins were quantified by densitometry. NLRP3, Cleaved-Caspase 1 and ASC were normalized to GAPDH. ** p < 0.01. (D) Representative electron microscopy of LX-2 cells treated with or without 300 ng/mL CXCL2 for 24 h. Scale bar, 1 μm (left). Scale bar, 0.5 μm (right). (E) Immunofluorescence staining for NLRP3 in LX-2 cells. Scale bar, 50 μm. (F) cells were stimulated with 200 ng/mL CXCL2 recombinant protein for 24 h, and CXCR2 protein level was determined by Western blot analysis. (G) LX-2 cells were pretreated with or without SB225002 (CXCR2 inhibitor) for 30 min, and then treated with CXCL2 for 24 h, and the expression levels of NLRP3 inflammasome-related proteins were detected by Western blot analysis. The densities of proteins were quantified by densitometry. NLRP3, Cleaved-Caspase 1 and ASC were normalized to GAPDH. The data are representative of at least three independent experiments. * p < 0.05 and ** p < 0.01.
This entry is adapted from the peer-reviewed paper 10.3390/ijms222212413
This entry is offline, you can click here to edit this entry!