New Gene Origination in a Special Fish Lineage: History
Please note this is an old version of this entry, which may differ significantly from the current revision.
Contributor: ,

Origin of new genes are of inherent interest of evolutionary geneticists for decades, but few studies have addressed general pattern of origin of new genes in a fish lineage. Flatfishes evolved one of the most specialized and asymmetric body plans in vertebrates. Providing recent released whole genome data that well represent ingroup and outgroup species, 1541 flatfish-lineage-specific genes were identified with the synteny-based pipeline. The origination pattern of these flatfish new genes is largely similar to those observed in other vertebrates, and they were mainly originated through DNA-mediated duplication, with some RNA-mediated duplication (retrogenes) or de novo genes.

  • flatfishes
  • phylogenomic context
  • origin
  • new genes

1. Introduction

As they only exist in certain species or evolutionary lineages, new genes are also called species or lineage-specific genes [1]. The main origin mechanisms of new genes include DNA-mediated duplication, RNA-mediated duplication and de novo origination, which can be identified from their sequence features [2]. With large number of genomes being sequenced, comparative genomic methods can be used to identify new genes based on the species phylogeny [3][4]. The synteny-based pipeline (SBP) method [5] is suited for recently duplicated genes’ identification, whereas the protein-family-based methods are useful for ancient new genes [6][7]. The establishment of these method provides us an opportunity to understand the pattern of origin of new genes in a lineage.
So far, many studies on new genes have focused on the model organisms including primates, rodents and Drosophila [8][9][10][11][12]. However, there are few researches on new genes in non-model vertebrates, and no study using phylogenomic data has been conducted to investigate new genes in a lineage of teleosts [13]. In addition, teleosts usually have an additional genome-wide duplication event, compared to other vertebrates, which may result in more duplicate genes and some of them may have functions in these fishes [14][15]. Among teleosts, flatfishes have evolved a very unique body plan, especially for its asymmetric body structure has been of great interest [16][17]. Recently, a relatively complete set of genome data of flatfishes and their outgroup species were published by us [18][19], providing a valuable opportunity to comprehensively identify new genes and investigate their possible roles in the evolution of flatfishes.

2. New Genes Emerged in Pleuronectoidei
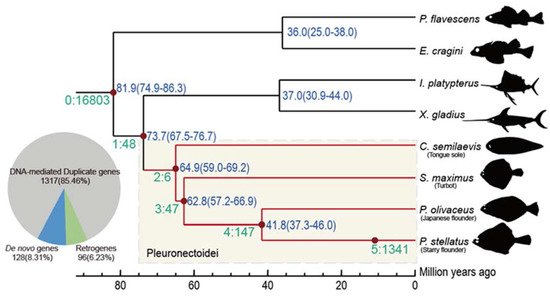
We re-constructed the phylogenetic tree and estimated the divergence time in order to identify new genes by the SBP method [5][20][21]. The divergence time between the reference species (P. stellatus) and its closest species is around 41.8 million year ago (Mya), and in the flatfishes with outgroups is 73.7 Mya. Then, there are 1541 Pleuronectoidei-specific new genes (assigned on branch 2–5) were identified, which account for 6.9% of the genes that were located on chromosomes of the starry flounder (Figure 1). The species-specific genes emergence rate is 32.1 Mya and the whole average level rate for the Pleuronectoidei lineage genes is 20.9 per Mya. There are 1317 (85.5%) DNA-mediated duplicates, 96 (6.2%) RNA-mediated duplicates (retrogenes) and 128 (8.3%) de novo genes. We did not detect any new genes originated from horizontal gene transfer. The proportions of different categories of new genes are consistent with previous results in mammals [5][21][22]. Indicating the pattern of new gene origination in Pleuronectoidei is largely similar to other animal taxa [23] and that the ancient fish-specific genome duplication event may not retain many duplicates in the modern teleosts [23][24].
Figure 1. Branch view of the distribution of new genes. In SBP, a total of six distinct age groups (branch 0–5) were specified based on the phylogenetic context. Genes postdating P. stellatus-C. semilaevis split (branch 2–5) are referred as Pleuronectoidei-specific genes, marked with light yellow block. The number and proportion for each origin mechanism of the 1541 Pleuronectoidei-specific genes are plotted in a pie chart.

3. Most New Genes Are Expressed and Some under Natural Selection
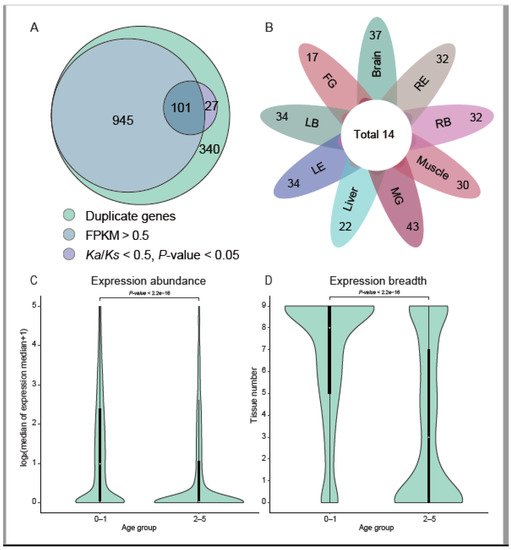
About 74.0% (1046 out of all the 1413 duplicate genes, including both the DNA and RNA mediated duplications) of new duplicate genes are found to be expressed in at least one tissue (FPKM > 0.5; Figure 2B). After filter genes with outlier Ks, 308 of the 1413 duplicate genes can be conducted using paralog Ka/Ks analysis. Among the 308 genes, 128 (31.4%) genes were shown to be under negative selection (Ka/Ks < 0.5; p-value < 0.05) (Figure 2A), of which 101 genes were also expressed. In a previous study on primates [5], the proportion of old genes under negative selection was significantly higher than the new duplicate genes (65.0% in old genes and 4.0% in new genes). In our study, the proportion of old genes (branches 0–1) under negative selection was 66.4% (1299 genes under negative selection/1964 old genes), but the proportion of new duplicate genes under selection in our study is much higher, which may be explained by the deeper divergence of Pleuronectoidei (~73 Mya [14]) compared to the primates (~43 Mya [5]), or the new duplicate genes in Pleuronectoidei might have been under higher selection pressure.
Figure 2. Expression of new genes. (A) Expression evidence of new genes. New genes with evidence of expression mean expressed in at least one tissue (FPKM > 0.5). Genes with significant paralog Ka/Ks < 0.5 are 128 (101 + 27). (B) Expression of de novo genes in different tissues. Each petal represents the number of genes expressed in the tissue (left-eye type’s tissues around eyes (LB), left-eye type’s two eyes (LE), right-eye type’s tissues around eyes (RB), right-eye type’s two eyes (RE), female gonad (FG), male gonad (MG). Fourteen de novo genes are expressed in all the studied tissues. (C,D) show violin plots of expression abundance and breadth of Pleuronectoidei-specific genes across indicated age groups (log2-based median of the median expression in 9 starry flounder tissues and the numbers of tissues where genes are expressed (FPKM > 0.5). In each case, the violin curve indicates the probability density of the data, the black bar in the center shows the interquartile range and the white dot shows the median. The genes were divided into two age groups. Results of Wilcox tests of the significance of differences between the age groups are also presented.
There are 128 de novo genes in Pleuronectoidei, of which 45 genes were found to be expressed in the analysis of the transcriptome (FPKM > 0.5), accounting for 35.2% of the de novo genes in Pleuronectoidei. We counted the expression of all de novo genes in various tissues (Figure 2C), and found that the number of genes expressed in all tissues is 14, the number of genes expressed in only a single tissue is 5, and the others expressed in two or more tissues. The expression of de novo genes varied in different tissues, with the highest number of 61 genes expressed in male gonad and lowest number of 19 genes expressed in female gonad. The result of more de novo genes expressed in male gonads is consistent with the observation in other animals by the previous study [5], but the specific functions of these de novo genes need further investigation. Among the 128 de novo genes, through Ka/Ks analysis with the orthologous genes in Japanese flounder, we found only two genes have been under significant negative selection, including gene evm.model.Hic_chr_10.1034 (Ka/Ks = 0.16; p-value = 1.4 × 10⁻²) and gene evm.model.Hic_chr_16.310 (Ka/Ks = 0.13; p-value =2.8 × 10⁻⁵). Among them, the gene evm.model.Hic_chr_10.1034 was expressed in all tissues, which might have evolved into a housekeeping gene in Pleuronectoidei.
By analyzing RNA-seq data in nine tissues of starry flounder, we found that gene transcription profiles changed across different gene age groups. The median expression of young genes (Pleuronectoidei-specific genes; branch 2–5) is close to 0 FPKM, while the median of nearly half of the old genes (branch 0–1) is higher than 1.0 FPKM (Figure 2C). In the expression profiles of various tissues, the young genes (branch 2–5) are expressed with a median less than 1.0 FPKM in 3 tissues, while the old gene (branch 0–1) are expressed with a median higher than 2.0 FPKM in 8 tissues. This age-related expression trend was also observed in the results of previous studies in primate- or rodent-specific genes [2][5].

4. Asymmetric Expression of Some New Genes May Play Roles in the Formation of the Unique Body Plan of Flatfishes
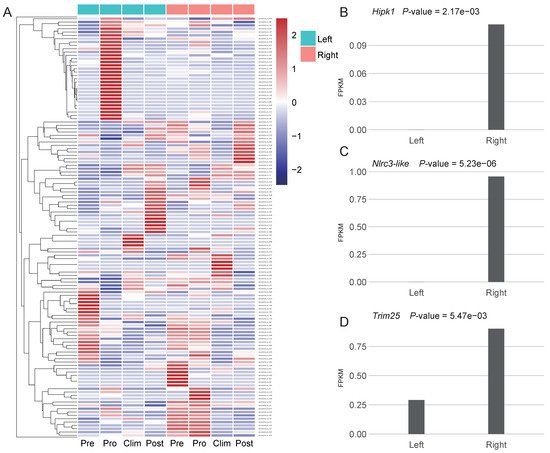
To investigate the possible roles of new genes on the asymmetric body plan of the Pleuronectoidei, unfortunately, we lacked two sides’ transcriptome data of starry flounder from same individuals (see Methods). We thus tentatively used the transcriptome data from Japanese flounder for differential expression analysis for the 200 Pleuronectoidei-specific new genes which are also present in Japanese flounder (branch 2–4; Figure 3A). By comparing the expression level of left and right side in each stage, we found that the stage and tissue containing the most number of differentially expressed genes (DEGs) was the pro-metamorphic larva of muscle. In other tissues, only one or zero new genes were significantly differentially expressed. In these DEGs at pro-metamorphic larva of muscle, nine new genes were significantly differentially expressed (p-value < 0.05), eight genes are DNA-mediated new duplicate genes, and one gene is de novo gene (evm.model.Hic_chr_6.523) which has no functional annotation information yet.
Among the new genes with significantly higher expression on the right side, one gene is Hipk1 (Figure 3B), which is related to the regulation of eyeball size, lens formation and retinal morphogenesis [25], and we found 14 genes that belonged to Hipk gene family in the Pleuronectoidei-specific new genes. The Hipk gene family were also found to have flatfish-specific expansion in previous study [26]. Besides, two new genes associated with cell proliferation were also highly expressed on the right side, including Nlrc3-like [27] (Figure 3C) and Trim25 [28] (Figure 3D). Asymmetric expression of these three new genes may have potential functions in the formation of the asymmetry of the left and right sides of the Japanese flounder.
Figure 3. New genes expressed in Japanese flounder. (A) Heatmap of expression of 200 Pleuronectoidei-specific new genes which are present in Japanese flounder in left and right side muscle at different development stages, Pre, pre-metamorphic larva; Pro, pro-metamorphic larva; Clim, metamorphic climax larva; Post, post-metamorphic larva. Genes were clustered by hclust [29]. (BD) Expression level and p-value of genes Hipk1, Nlrc3-like and Trim25 at the pro-metamorphic larva of muscle.

This entry is adapted from the peer-reviewed paper 10.3390/genes12111819

References

  1. Long, M.; Betrán, E.; Thornton, K.; Wang, W. The origin of new genes: Glimpses from the young and old. Nat. Rev. Genet. 2003, 4, 865–875.
  2. Zhang, Y.E.; Landback, P.; Vibranovski, M.; Long, M.Y. New genes expressed in human brains: Implications for annotating evolving genomes. Bioessays 2012, 34, 982–991.
  3. Cardoso-Moreira, M.; Long, M. The origin and evolution of new genes. Methods Mol. Biol. Clifton N. J. 2012, 856, 161–186.
  4. Ranz, J.M.; Parsch, J. Newly evolved genes: Moving from comparative genomics to functional studies in model systems. Bioessays 2012, 34, 477–483.
  5. Shao, Y.; Chen, C.Y.; Shen, H.; He, B.Z.; Yu, D.Q.; Jiang, S.; Zhao, S.L.; Gao, Z.Q.; Zhu, Z.L.; Chen, X.; et al. GenTree, an integrated resource for analyzing the evolution and function of primate-specific coding genes. Genome Res. 2019, 29, 682–696.
  6. Domazet-Loso, T.; Tautz, D. Phylostratigraphic tracking of cancer genes suggests a link to the emergence of multicellularity in metazoa. BMC Biol. 2010, 8, 66.
  7. Capra, J.A.; Williams, A.G.; Pollard, K.S. ProteinHistorian: Tools for the comparative analysis of eukaryote protein origin. PLoS Comput. Biol. 2012, 8, e1002567.
  8. Zhang, Y.E.; Long, M.Y. New genes contribute to genetic and phenotypic novelties in human evolution. Curr. Opin. Genet. Dev. 2014, 29, 90–96.
  9. Villanueva-Canas, J.L.; Ruiz-Orera, J.; Agea, M.I.; Gallo, M.; Andreu, D.; Alba, M.M. New Genes and Functional Innovation in Mammals. Genome Biol. Evol. 2017, 9, 1886–1900.
  10. Huminiecki, L.; Wolfe, K.H. Divergence of spatial gene expression profiles following species-specific gene duplications in human and mouse. Genome Res. 2004, 14, 1870–1879.
  11. Zhang, W.; Landback, P.; Gschwend, A.R.; Shen, B.; Long, M. New genes drive the evolution of gene interaction networks in the human and mouse genomes. Genome Biol. 2015, 16, 202.
  12. Shiao, M.S.; Khil, P.; Camerini-Otero, R.D.; Shiroishi, T.; Moriwaki, K.; Yu, H.T.; Long, M. Origins of new male germ-line functions from X-derived autosomal retrogenes in the mouse. Mol. Biol. Evol. 2007, 24, 2242–2253.
  13. Cheng, Y.; Shang, D.; Luo, M.; Huang, C.; Lai, F.; Wang, X.; Xu, X.; Ying, R.; Wang, L.; Zhao, Y.; et al. Whole genome-wide chromosome fusion and new gene birth in the Monopterus albus genome. Cell Biosci. 2020, 10, 67.
  14. Meyer, A.; Schartl, M. Gene and genome duplications in vertebrates: The one-to-four (-to-eight in fish) rule and the evolution of novel gene functions. Curr. Opin. Cell Biol. 1999, 11, 699–704.
  15. Zhang, Y.B.; Liu, T.K.; Jiang, J.; Shi, J.; Liu, Y.; Li, S.; Gui, J.F. Identification of a Novel Gig2 Gene Family Specific to Non-Amniote Vertebrates. PLoS ONE 2013, 8, 14.
  16. Friedman, M. The evolutionary origin of flatfish asymmetry. Nature 2008, 454, 209–212.
  17. Schreiber, A.M. Flatfish: An asymmetric perspective on metamorphosis. Curr. Top. Dev. Biol. 2013, 103, 167–194.
  18. Lu, Z.M.; Gong, L.; Ren, Y.D.; Chen, Y.J.; Wang, Z.K.; Liu, L.Q.; Li, H.R.; Chen, X.Q.; Li, Z.Z.; Luo, H.R.; et al. Large-scale sequencing of flatfish genomes provides insights into the polyphyletic origin of their specialized body plan. Nat. Genet. 2021, 53, 742–751.
  19. Wu, B.; Feng, C.; Zhu, C.; Xu, W.; Yuan, Y.; Hu, M.; Yuan, K.; Li, Y.; Ren, Y.; Zhou, Y.; et al. The Genomes of Two Billfishes Provide Insights into the Evolution of Endothermy in Teleosts. Mol. Biol. Evol. 2021, 38, 2413–2427.
  20. Zhang, Y.E.; Vibranovski, M.D.; Krinsky, B.H.; Long, M.Y. Age-dependent chromosomal distribution of male-biased genes in Drosophila. Genome Res. 2010, 20, 1526–1533.
  21. Zhang, Y.E.; Vibranovski, M.D.; Landback, P.; Marais, G.A.; Long, M. Chromosomal redistribution of male-biased genes in mammalian evolution with two bursts of gene gain on the X chromosome. PLoS Biol. 2010, 8, e1000494.
  22. Magadum, S.; Banerjee, U.; Murugan, P.; Gangapur, D.; Ravikesavan, R. Gene duplication as a major force in evolution. J. Genet. 2013, 92, 155–161.
  23. Blomme, T.; Vandepoele, K.; De Bodt, S.; Simillion, C.; Maere, S.; Van de Peer, Y. The gain and loss of genes during 600 million years of vertebrate evolution. Genome Biol. 2006, 7, 12.
  24. Lu, J.; Peatman, E.; Tang, H.; Lewis, J.; Liu, Z. Profiling of gene duplication patterns of sequenced teleost genomes: Evidence for rapid lineage-specific genome expansion mediated by recent tandem duplications. BMC Genom. 2012, 13, 246.
  25. Inoue, T.; Kagawa, T.; Inoue-Mochita, M.; Isono, K.; Ohtsu, N.; Nobuhisa, I.; Fukushima, M.; Tanihara, H.; Taga, T. Involvement of the Hipk family in regulation of eyeball size, lens formation and retinal morphogenesis. FEBS Lett. 2010, 584, 3233–3238.
  26. Shao, C.; Bao, B.; Xie, Z.; Chen, X.; Li, B.; Jia, X.; Yao, Q.; Ortí, G.; Li, W.; Li, X.; et al. The genome and transcriptome of Japanese flounder provide insights into flatfish asymmetry. Nat. Genet. 2017, 49, 119–124.
  27. Zha, L.H.; Zhou, J.; Tan, Y.; Guo, S.; Zhang, M.Q.; Li, S.; Yan, P.; Yu, Z.X. NLRC3 inhibits PDGF-induced PASMCs proliferation via PI3K-mTOR pathway. J. Cell. Physiol. 2020, 235, 9557–9567.
  28. Takayama, K.I.; Suzuki, T.; Tanaka, T.; Fujimura, T.; Takahashi, S.; Urano, T.; Ikeda, K.; Inoue, S. TRIM25 enhances cell growth and cell survival by modulating p53 signals via interaction with G3BP2 in prostate cancer. Oncogene 2018, 37, 2165–2180.
  29. Kolde, R. Pheatmap: Pretty Heatmaps. 2015. Available online: https://rdrr.io/cran/pheatmap/ (accessed on 25 February 2021).
More
Video Production Service