Your browser does not fully support modern features. Please upgrade for a smoother experience.
Please note this is an old version of this entry, which may differ significantly from the current revision.
Subjects:
Biology
|
Environmental Sciences
Small non-translated regulatory RNAs control plenty of bacterial vital activities. The small RNA GcvB has been extensively studied, indicating the multifaceted roles of GcvB beyond amino acid metabolism.
- Escherichia coli
- small RNA
- GcvB
- oxidative stress
- OxyR
1. Introduction
The Escherichia coli chromosome encodes more than 80 small non-translated regulatory RNAs [1] that control plenty of bacterial vital activities, including biofilm formation [2], transcription termination [3], cell signaling [4] and cellular responses to growth conditions of various factors of oxidative stress, osmolarities, temperature or iron levels [5,6,7,8,9,10,11,12].
The small RNA GcvB has been extensively studied since its discovery two decades ago [5]. GcvB is approximately 200 nt in length and is highly conserved among Enterobacteriaceae [13,14]. GcvB expression is tightly related to glycine metabolism [15,16,17,18,19] and GcvA activates the transcription of GcvB [20] when glycine is abundant. Intriguingly, GcvB expression shows a strong growth condition-dependent feature. GcvB is abundant when cells are grown in rich medium during the exponential phase but is deficient when cells reach the stationary phase or are grown in minimal medium [5,13,15,21]. GcvB is depicted as a regulator of 1–2% of all the mRNAs in Salmonella Typhimurium and E. coli by using genome-wide experimental approaches including microarray [16] and RIL-seq [14], or by applying network [22] or in silico prediction [16,17]. Most of the known targets negatively regulated by GcvB are amino acid biosynthesis proteins and transporters of amino acids or peptides, as exampled by the two asparagine synthetases of AsnA and AsnB [21], the periplasmic transporter components of DppA and OppA [20], the serine/threonine transporter of SstT [23], and a certain amino acids transporter of CycA [15], suggesting the primary physiology role of GcvB could be to limit the uptake and biosynthesis of energy-expensive amino acid under nutrient-rich conditions [13,20]. In parallel, GcvB also negatively regulates the expression of several transcription factors including Lrp [24], a global regulator responding to the intracellular leucine level [25]; PhoP [26] in the PhoQP two-component system, which controls the expression of genes with functions in magnesium transport, acid resistance and lipopolysaccharide modification [27,28,29]; and CsgD [30], the master regulator of curli synthesis [31] Moreover, in a direct or an indirect mode, GcvB is positively involved in the acid stress response [32] and stress-induced DNA mutagenic break repair [33]. All this evidence indicates the relatively multifaceted roles of GcvB that are beyond amino acid metabolism.
In most cases, GcvB functions as a repressor. It blocks translational initiation by classically interfering with the 30S ribosome subunit binding to a ribosome-binding site or inducing an active mRNA decay via the recruitment of ribonuclease E after pairing to the target mRNA [21]. GcvB also works as an activator. GcvB maintains the stability of the rbn mRNA with the help of Hfq and protects it from RNase E cleavage [34]. GcvB up-regulates sigma factors RpoS [32] and RpoE [33], although the precise nature of the interactions between GcvB and these sigma factors is to be determined.
2. The Expression of Flu Was Highly Induced in the gcvB Deletion Strain
To characterize the putative target genes controlled by the small RNA GcvB (GenBank acc. n: CP011496.1, region 4,184,713–4,184,917), we compared the transcriptomes of the wild-type E. coli K-12 strain NCM3722 and its gcvB deletion derivative CY325 grown in glucose minimal medium by high resolution RNA-seq [35]. We first found that both the gcvB deletion and wild-type strains showed similar doubling times in the glucose minimal medium, indicative of a relatively limited role of GcvB regulation in this condition (Supplementary Figure S1). In total, five genes were retained as significant with a two-fold cutoff (with an FDR smaller than 0.01) (Figure 1A, Supplementary Table S3) in the transcriptome study. Compared to their expression in NCM3722, the genes of flu (GenBank acc. n: CP011496.1, region 3,331,422–3,334,541) and yeeR (GenBank acc. n: CP011496.1, region 3,334,662–3,336,223) exhibited highly increased expression in CY325, respectively, showing a fold change of 63.6 and 4.6, whereas the remaining three genes showed an approximately two-fold decreased expression in CY325. Since flu and yeeR showed the biggest fold of expression changes, we further tested their expression in the two strains using the RT-qPCR assay. Consistent with the RNA-seq data, the mRNA levels of flu and yeeR in CY325 were significantly higher than that in the wild type when cells were grown in glucose minimal medium (Figure 1B,C). Similar results were also observed when cells were grown in LB rich medium (Figure 1D,E). Thus, flu and yeeR could be negatively regulated by GcvB in a direct or an indirect mode.
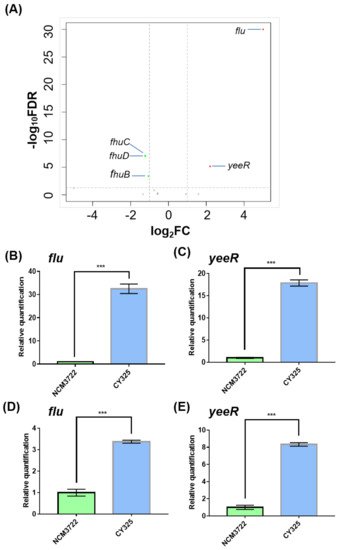
Figure 1. Genes responding to GcvB. (A) Volcano map comparing the expression of genes in the gcvB knockout strain CY325 versus that in the wild-type strain NCM3722. The horizontal dashed line points to q-value (FDR) = 0.01 on y-axis and the vertical dashed lines point to 2-fold cutoff of the expression on x-axis. Red dots indicate up-expressed genes; green dots indicate down-expressed genes; grey dots indicate genes showed no significant changes. Note that the data points of the remaining genomic genes carrying a q-value (FDR) = 1 with a corresponding −log10FDR = 0 were not shown. (B,E) Gene expression of flu and yeeR detected using RT-qPCR in the gcvB knockout strain CY325 and in the wild-type strain NCM3722 grown in glucose minimal medium (B,C) or in LB rich medium (D,E). The mRNA level of each gene in NCM3722 was normalized to 1 and that in CY325 was determined relative to this value. The relative expression was shown as the average ± S.D. of three independent experiments. *** p < 0.001 using Student’s t-test.
In the genome of NCM3722, the gene of flu localized right upstream of the gene of yeeR in the same DNA strand. The gene of yeeR is a pseudogene and the gene of flu encodes antigen 43 (Ag43). Ag43 is an abundant outer membrane protein that belongs to the auto-transporter family and is a major determinant of auto-aggregation in E. coli [45,46]. Thus, we studied the auto-aggregation of both the gcvB knockout and wild-type strains. As reported, bacterial motility and chemotaxis were required for the Ag43-dependent aggregation of E. coli [46]. However, the two strains applied in the transcriptome study were non-motile [47] because the flagellar filament structural protein [48] encoded by fliC (GenBank acc. n: CP011496.1, region 3,261,993–3,263,489) carries a lone mis-sense mutation (N87K) [42]. We complemented the mutated fliC of NCM3722 to the wild-type fliC to obtain the motile strain CY713, and the gene of gcvB was deleted in CY713 to obtain the gcvB knockout strain CY1027. Consequently, the auto-aggregation ability of CY713 and CY1027 was then compared using microscopy. Indeed, we observed that the gcvB knockout strain CY1027 aggregated more efficiently than the gcvB wild-type strain CY713 (Figure 2), supporting the highly induced flu expression in the gcvB knockout strain.
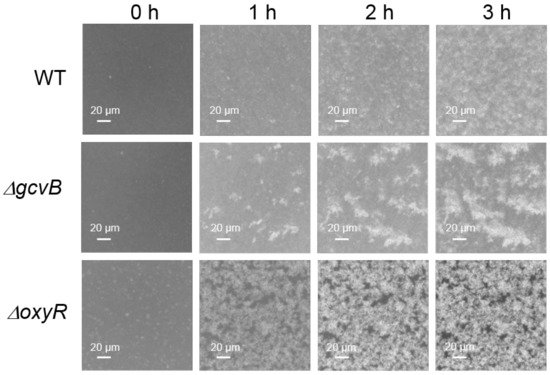
Figure 2. Aggregation assays of three E. coli strains. The aggregation of CY713 (WT), CY1027 (gcvB::cm) and CY1038 (oxyR::cm) was detected at 37 °C into a 24-well polystyrene plate using microscopy as described in methods. Bacterial aggregation was monitored at various time points (0–3 h). The formation of the white cluster indicates aggregation of cells. One representative result of two independent observations is shown.
3. OxyR Showed Decreased Expression in the gcvB Deletion Strain
As reported, the transcription of flu was repressed by OxyR [49]. Accordingly, we identified the highly induced expression of flu in the oxyR (GenBank acc. n: CP011496.1, region 736,030–736,947) deletion strain (Supplementary Figure S2A). In parallel, the oxyR deletion strain was observed to exhibit the high auto-aggregation efficiency (Figure 2) indicative of the highly expressed flu. Moreover, we monitored the expression of yeeR in the oxyR deleted background and found that yeeR showed a similar induced expression as flu (Supplementary Figure S2B). Given their congruent responses and their concatenated locations in the genome, it was very likely that flu and yeeR formed an operon and both were under the control of OxyR.
Thus, the protein levels of OxyR in the gcvB knockout and wild-type strains grown in the LB rich medium or the glucose minimal medium were determined using Western blot. We identified that the protein amount of OxyR in CY455 (ΔgcvB) was approximately half that in the gcvB wild-type strain CY454 in both conditions (Figure 3). As a result, the decreased expression of the OxyR repressor in the gcvB knockout strain could induce the high expression of flu.
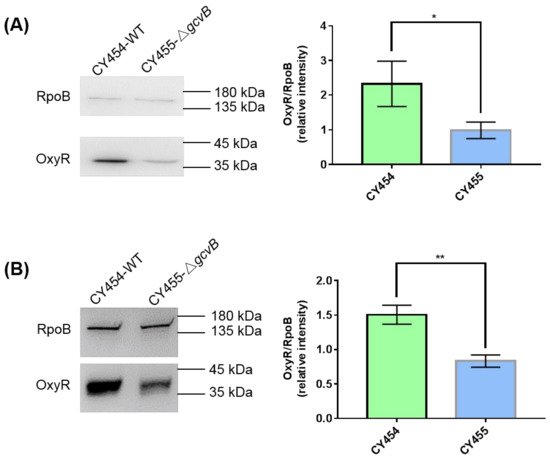
Figure 3. The protein levels of OxyR in the gcvB knockout and wild-type strains. The protein levels of OxyR in the gcvB wild-type strain CY454 and in the gcvB knockout strain CY455 cultured in LB rich medium (A) or in glucose minimal medium (B) were tested using Western blot. RpoB was applied as a loading control. The 0.025 OD600 (A) or 0.05 OD600 (B) cells were loaded. One representative result of six repeats in two independent Western blots is shown on the left. The relative protein level of three repeats in one Western blot is shown as the average ± S.D. on the right. The protein level of OxyR in CY455 was normalized to 1 and that in CY454 was determined relative to this value. ** p < 0.01, * p < 0.05 using Student’s t-test.
4. The Small RNA GcvB Enhanced the Expression of OxyR at the Translational Level
We next explored how GcvB stimulated the expression of OxyR. The mRNA level of oxyR did not show significant changes in the two transcriptomes of the gcvB wild-type and knockout strains (Supplementary Figure S3A) and this finding was further demonstrated using the RT-qPCR assay (Supplementary Figure S3B). Moreover, we made an oxyR promoter with lacZ transcriptional fusion (Supplementary Figure S3C) in both the gcvB wild-type and knockout strains and observed that the β-galactosidase activity showed no significant changes in the two backgrounds (Supplementary Figure S3D). As a result, it was most likely that the regulation of GcvB on OxyR existed at the post-transcriptional level. To substantiate this hypothesis, we constructed the oxyR promoter with lacZ translational fusions in both the gcvB wild-type and knockout strains. We made two fusion constructions, with P1 and P2, respectively, carrying 99 and 45 nt after the translational start codon of oxyR (Figure 4A). Supporting the Western blot result (Figure 3), both translational fusions showed significantly decreased β-galactosidase activity in the gcvB knockout strain when being compared to that in the gcvB wild-type strain (Figure 4B,C), indicating GcvB activated the expression of OxyR at the translational level.
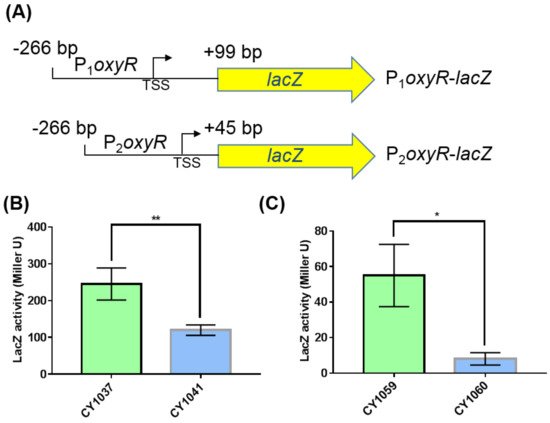
Figure 4. β-galactosidase activities of the oxyR promoter with lacZ translational fusions in the gcvB knockout and wild-type strains. (A) Composition diagrams of the promoters of oxyR with lacZ translational fusions. P1oxyR covers the DNA region from −266 bp to +99 bp relative to oxyR translational start point and P2oxyR covers the DNA region from −266 bp to +45 bp relative to oxyR translational start point. Yellow arrow indicates the entire coding region of lacZ. TSS indicates the transcriptional start site of oxyR. (B) β-galactosidase activities of P1oxyR-lacZ fusion in the gcvB wild-type (CY1037) and knockout strains (CY1041). (C) β-galactosidase activities of P2oxyR-lacZ fusion in the gcvB wild-type (CY1059) and knockout strains (CY1060). The LacZ activity was shown as the average ± S.D. of three independent experiments. ** p < 0.01, * p < 0.05 using Student’s t-test.
5. The gcvB Deletion Strain Was Sensitive to Oxidative Stress
Since OxyR is the transcriptional regulator that induces the expression of antioxidant genes in response to oxidative stress [38,39], the reduced expression of OxyR when gcvB was deleted suggested that the gcvB deletion strain could be sensitive to oxidative stress. Therefore, we tested the response of the gcvB wild-type and knockout strains to oxidative stress. Indeed, when additional H2O2 was supplied to the growth medium, the gcvB mutant grew more slowly and showed less resistance to H2O2 than the gcvB wild-type strain (Figure 5A). Moreover, we also tested the response of the oxyR deletion strain to H2O2 treatment. As expected, the oxyR deletion strain was sensitive to the oxidative stress. In the same line, both the gcvB and the oxyR mutants showed significantly lower survival rates than the wild type in the survival assay (Figure 5B).
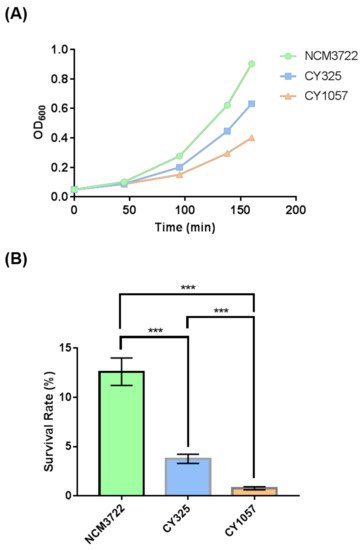
Figure 5. The sensitivity of the gcvB deletion strain to oxidative stress. (A) The growth of strains with H2O2 supplied to the medium. The growth curve of each strain was recorded after 3 mM H2O2 was supplied into the growth medium. One representative result of three independent experiments is shown. NCM3722 (WT); CY325 (ΔgcvB); CY1057 (ΔoxyR). (B) Survival rate of the three strains after a 10-minute challenge of 20 mM H2O2. The survival rate is shown as the average ± S.D. of the six replicates in two independent experiments. *** p < 0.001 using Student’s t-test.
The endogenous ROS were generated as byproducts of aerobic respiration [50]. Given the decreased expression of OxyR in the gcvB mutant, the gcvB mutant could accumulate more endogenous ROS. To verify this point, using fluorescence microscopy, we monitored the intracellular amount of ROS that remained in the gcvB wild-type and knockout strains by employing two kinds of ROS indicators, DHE (dihydroethidium) and H2DCFDA (2′,7′-dichloro-dihydro-fluorescein diacetate), both of which are membrane-permeant dyes that can be oxidized to show red and green fluorescence, respectively, and have been widely used as fluorescence probes for the detection of superoxide and peroxide due to their specificity to these radicals [51]. The phase contrast and fluorescence micro-photographs of the two strains stained with DHE and H2DCFDA were exhibited (Figure 6A and Figure 7A). Compared to the gcvB wild-type cells, larger numbers of gcvB knockout cells showed stronger fluorescence using both indicators indicative of higher levels of ROS remaining in the gcvB knockout cells. The mean fluorescence intensity of CY325 cells, respectively, stained with DHE or H2DCFDA was approximately two- to six-fold stronger than that of NCM3722 cells (Figure 6B and Figure 7B). These observations suggested that, compared to the gcvB wild-type cells, the gcvB knockout cells could lose some of their ability to eliminate endogenous ROS where the expression of OxyR was reduced.
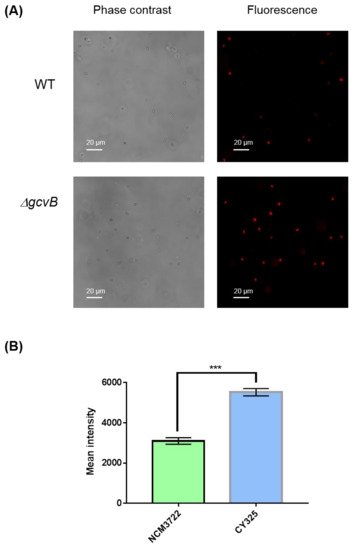
Figure 6. Detection of superoxide. (A) Detection of superoxide by DHE staining. The phase contrast shows the cells under microscope and the red fluorescence represents the detection of superoxide. Two to three independent observations were performed and one image containing representative cells is shown. (B) Quantification of fluorescence intensity. Fluorescence intensity was expressed as the average ± S.E.M., calculated from 393 to 416 individual cells. NCM3722 (WT); CY325 (ΔgcvB). *** p < 0.001 using Student’s t-test.
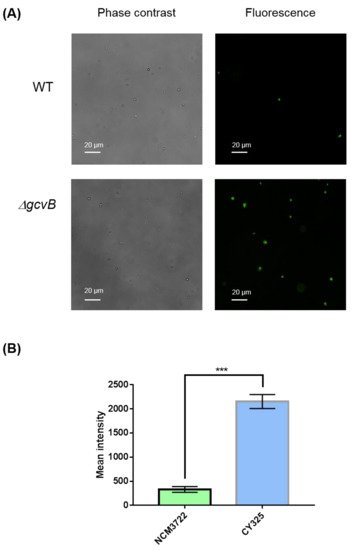
Figure 7. Detection of peroxide. (A) Detection of peroxide by H2DCFDA staining. The phase contrast shows the cells under microscope and the green fluorescence represents the detection of peroxide. Two to three independent observations were performed and one image containing representative cells is shown. (B) Quantification of fluorescence intensity. Fluorescence intensity was expressed as the average ± S.E.M., calculated from 468 to 741 individual cells. NCM3722 (WT); CY325 (ΔgcvB). *** p < 0.001 using Student’s t-test.
This entry is adapted from the peer-reviewed paper 10.3390/antiox10111774
This entry is offline, you can click here to edit this entry!