Your browser does not fully support modern features. Please upgrade for a smoother experience.
Please note this is an old version of this entry, which may differ significantly from the current revision.
Subjects:
Oncology
|
Neuroimaging
Boron neutron capture therapy (BNCT) is a type of targeted radiotherapy. BNCT shows promising results in treating lung cancer, recurrent head and neck cancer, sarcomas, and high grade brain tumors.
- 18F-FBPA
- boron neutron capture therapy (BNCT)
- malignant tumor
- radiomics
1. Introduction
Boron neutron capture therapy (BNCT) is a type of targeted radiotherapy. BNCT shows promising results in treating lung cancer, recurrent head and neck cancer, sarcomas, and high grade brain tumors [1,2]. Due to the high local tumor control rate, BNCT is considered a promising treatment for malignant tumors [3]. Tumor cells tend to show a higher uptake level of the 10B-containing drug, such as Boronophenylalanine (BPA), than do normal tissues. The high tumor specificity of BPA is because of the selective transport by L-type amino acid transporter 1, which is upregulated in cancers [4]. Thermal neutrons are captured with high probability by BPA drugs, leading to the nuclear reaction of 10B (n, α, γ) 7Li. High linear energy transfer particles, i.e., alpha particle and 7Li, are generated in this reaction [5,6,7]. An effective BNCT for cancer treatment requires a sufficient tumor-to-normal tissue ratio (T/N ratio, greater than 2.5) of BPA [8]. A radio-labeled phenylalanine analogue for positron emission tomography (PET), 4–borono-2-18F-fluoro-phenylalanine (18F-FBPA), has been used to evaluate the T/N ratio of BPA in clinical practice [9,10,11]. The 18F-FBPA may be considered a superior tumor-specific tracer to the frequently-used PET tracer, 2-18fluoro-2-deoxy-D-glucose (18F-FDG) with regard to reducing false positive rates caused by uptakes in normal gray matter and inflammation tissues [4,12,13].
Due to high soft-tissue contrast, functional imaging capability and low radiation exposure, PET/MR becomes more available and partly replaces PET/CT in some clinical examinations including the brain, head and neck [14]. However, PET/CT still has advantages compared to PET/MR, such as good lung-to-bone contrast, accurate attenuation correction, and relatively low costs [14]. Furthermore, PET/CT technology has strong and long clinical experience and does not require MRI skills for nuclear physicians in comparison to PET/MR. Accordingly, both PET/CT and PET/MR play critical roles in investigating tumor metabolism. Several PET-derived characteristics are applied in the diagnosis of cancers, including conventional and radiomic features. Conventional features are mostly voxel-based to reflect the uptake of PET tracers in tumor cells, such as standardized uptake values (SUV) and the T/N ratio [15]. Radiomic features are high throughput and quantitative characteristics which describe the image pattern and heterogeneity of a tumor [16,17,18]. Nevertheless, variability of the image features is observed between PET/MR and PET/CT. This is potentially caused by the different reconstruction processes of images, such as the correction of attenuation and partial volume effect as well as the noise reduction [19,20].
2. Radiomic Feature Extraction
A semi-automatic method based on the maximum SUV was used to define tumor region of interest (ROI). In this study, we defined the regions with SUV higher than 50% of SUVmax as the ROIs. This criteria for tumor segmentation is commonly used in clinical PET imaging [29]. The ROIs were delineated on both modalities of PET images, respectively, and reviewed by a team comprised of experienced nuclear medicine physicians and radiation oncologists for pre-BNCT evaluation. Figure 1 shows representative PET/CT and PET/MR images of patients with brain tumor and head and neck cancer. Finally, 449 radiomic features, including geometric, histogram, texture and wavelet, were extracted from each PET dataset. The histogram features described the intensity distribution of the 18F-FBPA uptake within ROI. Geometric features measured the 3D shape and size of tumor ROIs. Texture features quantified the heterogeneity of ROIs based on the gray level co-occurrence matrices (GLCM) and gray level run length matrix (GLRLM) [30,31,32]. Wavelet features provided the detail of images by filtering image signals based on different levels of spatial frequency. Wavelet decomposition was performed by applying low-(L) and high-(H) pass dimensional filters along three image axes, generating eight decomposed image sets: LLL, LLH, LHL, LHH, HLL, HLH, HHL and HHH filtered images. Histogram and texture features were calculated on the original images and each of the eight wavelet filtered images.
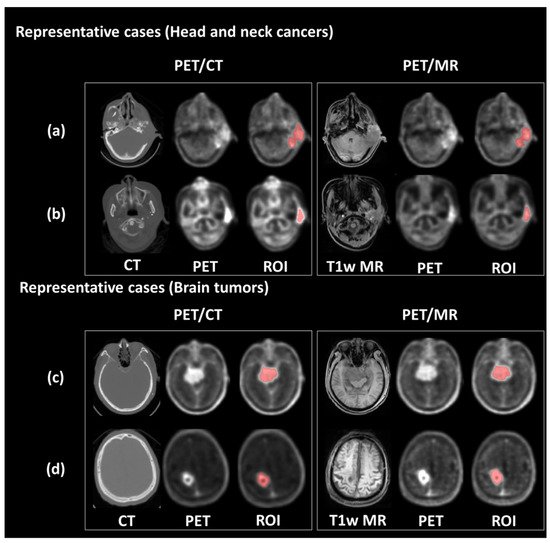
Figure 1. Representative PET/CT and PET/MR images. The upper panel shows the PET images and tumor contour of patients with ear sarcoma (a) and tongue cancer (b), respectively. The bottom panel shows the PET images and tumor contour of patients with meningioma (c) and glioblastoma (d), respectively.
3. Linear Correlation between PET/CT and PET/MR Features
As shown in Figure 2a, all four conventional features expressed r2 were > 0.90. Furthermore, most of the histogram features were well fitted by the linear models with r2 values > 0.85. More than half of the geometric features presented r2 values < 0.85. For the wavelet and GLCM features, the distribution of r2 values exhibited lower medians (0.69 and 0.73, respectively) and wider variances, resulting in only 25%, and 45.6% showed r2 > 0.85, respectively. Figure 2b shows distribution of r2 for the radiomic features with different wavelet filtering (i.e., various combinations of low-pass or high-pass filters along three imaging axes). We found that the features based on high-pass wavelet filters might enhance the inhomogeneous compositions of PET/CT and PET/MR (such as the edges and fine details) and therefore reduced the comparability between the two modalities. For example, the features based on the HHH wavelet showed a significantly lower median of r2 compared to those without wavelet features (p < 0.001); whereas the r2 of LLL-based features didn’t show a significant difference compared to those without wavelet features (Figure 2b).
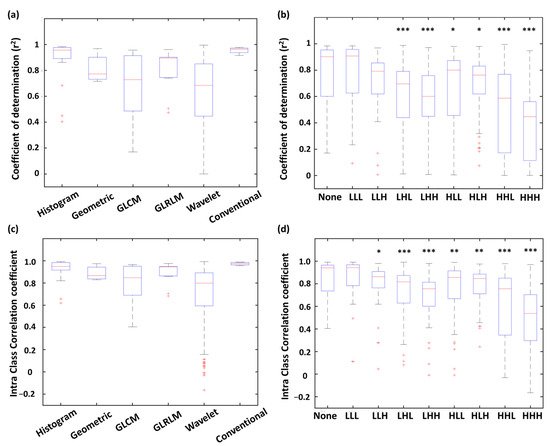
Figure 2. Distribution of r2 (a,b) and ICC (c,d) values of PET/CT and PET/MR comparison among radiomic types and wavelet types. *** p < 0.001, ** p < 0.01, * p < 0.05.
4. Intraclass Correlation between PET/CT and PET/MR Features
Distribution of ICCs of each feature type is shown in Figure 2c. All four conventional features showed ICC values > 0.95. Histogram (87.5% of features) and GLRLM (82.0% of features) were highly correlated between PET/CT and PET/MR with ICC values > 0.75. On the other hand, only 59.1% of GLCM features and 59.7% of wavelet features exhibited ICC values > 0.75, indicating these two feature types were more dissimilar between PET/CT and PET/MR. The ICC distribution of each wavelet filter type is showed in Figure 2d. Similar to the results of linear correlation analysis (r2 distribution), the features based on HHH wavelet showed a significantly lower median of ICC values compared to those without wavelet features (p < 0.001); whereas the ICC values of LLL-based features didn’t show a significant difference compared to the none-filtered features (Figure 2d).
5. Features with High Comparability for Interchange between PET/CT and PET/MR
As shown in Figure 3a, 81.2% of histogram and 63.7% of GLRLM features reached the criteria of strong comparability (r2 > 0.85 and ICC > 0.75). Only 37.5% of geometric features reached strong comparability, and the rest presented moderate comparability. 45.6% of GLCM features and 24.2% of wavelet features presented strong comparability. Finally, all conventional features showed strong comparability between PET modalities. Figure 3b reveals percentages of each comparability level in different wavelet filters. A larger portion of features with strong comparability was found in none-filtered and LLL wavelet features compared to other wavelet types comprising high-pass filters. The HHH filter type had the least portion of features with strong comparability. The inconsistency of r2 and ICC value between two PET modalities in wavelet features was possibly caused by the high intrinsic variability of the applied wavelet filters.
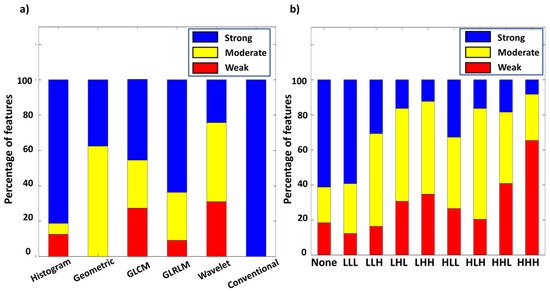
Figure 3. Percentage of different level of comparability among radiomic types (a), and wavelet types (b).
Figure 4 shows the linear regression of the representative features with high r2 and ICC values from each feature type. For instance, volume had the highest r2 and ICC value among geometric features (Figure 4c). The most upper right sample point of volume (Figure 4c), energy (Figure 4b), and run length non-uniformity (Figure 4e) appeared to be from the same patient. After removing this leverage point, the r2 values of volume, energy and run length non-uniformity slightly decreased to 0.93, 0.95, and 0.93, respectively.
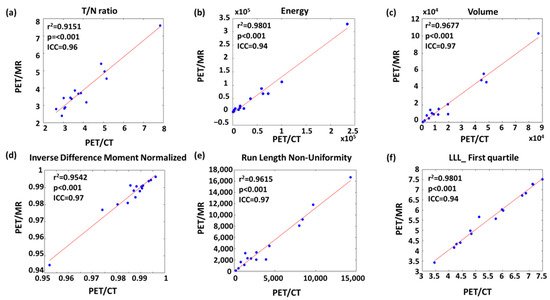
Figure 4. Linear regression of representative (a) conventional, (b) histogram, (c) geometric, (d) GLCM-texture, (e) GLRLM-texture and (f) wavelet features with strong comparability between PET/CT and PET/MR.
This entry is adapted from the peer-reviewed paper 10.3390/biom11111659
This entry is offline, you can click here to edit this entry!