MicroRNA Biomarkers in Prostate Cancer by Ultrasound-Based Identification: History
Please note this is an old version of this entry, which may differ significantly from the current revision.
Subjects: Pathology | Oncology
Contributor:

MiRNAs are ~22-nucleotide long noncoding sequences of RNA that are located across the genome, within an intron or untranslated region (UTR) of a coding gene. Pri-miRNAs are transcribed from their genes in longer primary transcripts which are processed by two RNase III proteins—Drosha and Dicer—to form a functional miRISC complex that binds to the 3′ UTR of target mRNAs and induces their degradation and translational repression . miRNAs were found to be highly stable in blood and other body fluids, where they circulate in a cell-free form, bound to other proteins, lipids, or lipoprotein or encapsulated in exosomes. The development of specific high-throughput detection methods allowing miRNA detection in extracellular fluids, besides the fact that profiles of miRNAs were shown to be either downregulated or overexpressed across several cancer types compared to normal counterparts, has paved the way for serum miRNAs to be developed as biomarkers for early detection and monitoring of tumor evolution. However, significant challenges remain, such as the low concentration of miRNAs released in the blood, especially in early-stage disease, and the difficult identification of biomarker release sites.

  • miRNAs
  • biomarkers
  • prostate cancer
  • ultrasounds

1. Ultrasound Treatment Increases the Release of Known Biomarkers in PCa Cell Lines

A panel of AD (LNCaP, 22Rv1) and AI (DU145, PC3) PCa cell lines was analyzed for the expression of the PSA biomarker by RT-qPCR. We found that LNCaP cells expressed the higher levels of PSA (fold change [FC]: 51,679.64) compared to the other three cell lines, in which PSA expression was either significantly lower (22Rv1, FC: 196.98; PC3, FC: 3.08) or absent (DU145) (Figure 1A).
Figure 1. Analysis of biomarkers expression and release in PCa cell lines. (A) RT-qPCR showing PSA relative mRNA levels in the indicated PCa cell lines. (B) Quantification of PSA release in the supernatant of untreated LNCaP (CTR) or US-treated cells. (CE) RT-qPCR showing the levels of (C) mir-16-5p, (D) mir-141, and (E) mir-200c in DU145, PC3, 22Rv1, and LNCaP supernatants from US-treated cells relative to untreated control cells. In all panels, the values denote means ± SD (n = 3); statistical significance was calculated by two-tailed Student’s t-test. ** p < 0.01; *** p < 0.001; **** p < 0.0001.
As circulating PSA detection is routinely used in the clinic for PCa screening, we tested if US treatment could improve the release of this biomarker in the supernatant of LNCaP and 22Rv1 cells, the two cell lines for which we detected measurable levels of PSA mRNA. To this end, both cell lines were treated with the automatized prototype Sonowell®®. Consistently with previous evidence, we applied a permeabilization regimen to characterize the molecular features of our PCa lines after US treatment [1]. Medium was collected before and after sonication from the same well to normalize biomarkers values on the same cell number; 10% of duty cycle was chosen to prevent membrane disruption and morphological alterations. Setting experiments identified 1 MHz frequency as the transducer that produced the most homogeneous sonication in the well, based on cellular area coverage analysis, in keeping with the work by D’Souza et al. [2]. PSA levels in the supernatants were detected by ELISA. After 30 min of US treatment, LNCaP cells released measurable levels of PSA in the supernatant, which were found to be almost three times the levels measured for untreated control cells (FC: 2.87) (Figure 1B). Instead, we observed no difference in PSA release between US-treated 22Rv1 and untreated cells. As an additional control of our system and to confirm that the selected parameters were the most efficient in inducing the permeabilization of our cell lines, we further tested our PCa cell lines for the release, before and after US treatment, of three cell-free miRNAs previously isolated by D’Souza and colleagues in LNCaP supernatants after US treatment, i.e., mir-16-5p, mir-141, mir-200c [2]. The release of these selected miRNAs in the supernatant was evaluated through RT-qPCR after total miRNAs extraction. We found increased levels of mir-16-5p and mir-141 in both LNCaP (mir-16-5p, FC: 5.3; mir-141, FC: 2.8) and DU145 (mir-16-5p, FC: 13.6; mir-141, FC: 11.17) supernatants following US treatment, while an increased US-induced release of mir-200c was detected only in LNCaP supernatant (FC: 8.5). No significant increase of miRNA release was detected in PC3 and 22Rv1 supernatants after US treatment (Figure 1C–E). The different response to US treatment observed across PCa cell lines could be due to their diverse morphology, which affects US-induced membrane permeability [3][4][5]. We concluded that US treatment is effective in increasing the extracellular release of PCa-related miRNAs, at least in some cellular settings.

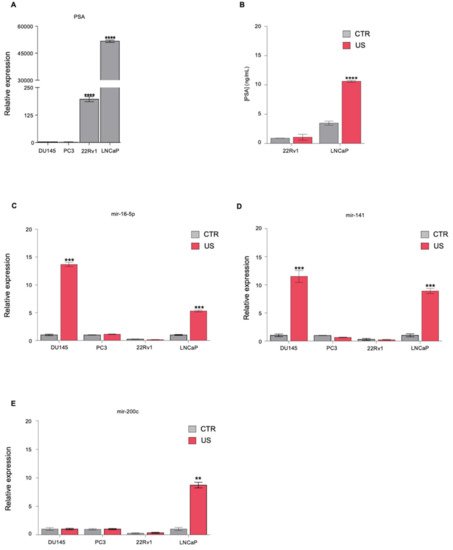
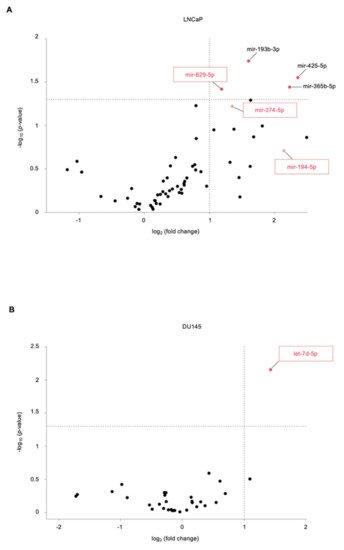
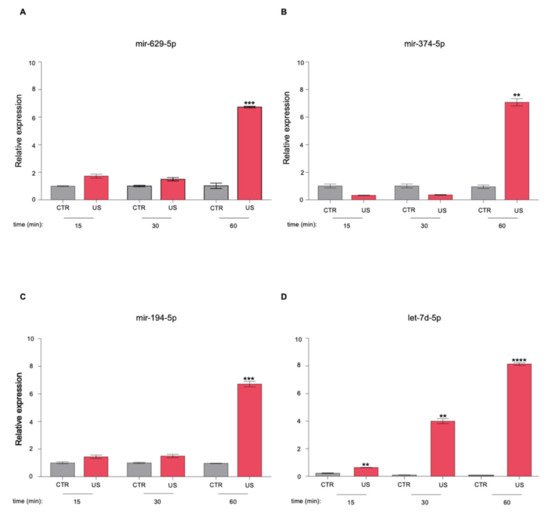
2. Identification of Novel miRNAs in the Supernatant of PCa Cells following US Treatment

Since US treatment showed to be effective in increasing the concentration of known miRNAs released in the supernatant of LNCaP and DU145 cells, we profiled the miRNAs released by these cells before and after US treatment, with the aim of identifying new potential PCa-related miRNA biomarkers. The miRNA profile analysis was performed by TaqMan™ Advanced miRNA Human Serum/Plasma RT-qPCR array cards. The volcano plots in Figure 2 show the log2FC of all miRNAs detected in LNCaP (Figure 2A) or DU145 (Figure 2B) supernatants after 1 h of US treatment compared to those released from untreated cells over the same time (see also Supplementary Table S1).
Figure 2. Extracellular miRNAs profiling of US-treated PCa cells. (A,B) Volcano plots showing the profiles miRNAs released in (A) LNCaP or (B) DU145 supernatants after US treatment relative to those of untreated control cells, performed by using TaqMan™ Advanced miRNA Human Serum/Plasma Card RT-qPCR array cards. The analyses were performed using Expression Suite software. Reported are the negative log10 p-values plotted against the log2 fold change. Dots represent individual miRNAs. Horizontal line, p = 0.05; Vertical line, FC = 2. Dark red dots, miRNAs released at significantly higher levels (p < 0.05). miRNAs of interest are depicted (framed boxes).
Among the 188 miRNAs investigated, we identified 4 miRNAs, whose levels were significantly higher in LNCaP supernatant after US treatment compared to those detected in basal conditions: miR-425-5p (FC: 5.129, p = 0.028), miR-365b-3p (FC: 4.698, p = 0.036), miR-629-5p (FC: 2.274, p = 0.038), and miR-193b-3p (FC: 3.034, p = 0.018). Three of them, miR-425-5p, miR-365a-3p, and miR-193b-3p, were already described in the literature to be involved in PCa. In fact, miR-425-5p has been described to be overexpressed in PCa cell lines, where it promotes proliferation, migration, and invasion by targeting forkhead box J3 [6]; miR-365b-3p expression resulted to be expressed at statistically different levels in PCa tissues compared to tissue from patients with prostatic hyperplasia [7]; the silencing of miR-193b-3p through promoter methylation was shown to correlate with more aggressive PCa [8]. Interestingly, we also identified miR-629-5p, which to our knowledge has never been linked to PCa disease (Figure 2A, Supplementary Table S1). Notably, two additional miRNAs, whose supernatant levels were increased more than two-fold following LNCaP US treatment—miR-374a-5p (FC: 2.550, p = 0.060) and miR-194-5p (FC: 4.416, p = 0.195)—were not described in the literature as PCa-related miRNAs. DU145 profiling showed a significant increase in the release of let-7d-5p (FC:2.694, p = 0.007) following US treatment and, although this miRNA family has been related to several cancers [9], no specific roles in PCa have been described for it (Figure 2B, Supplementary Table S1). We investigated the cellular release kinetics of the newly identified miR-629-5p, miR-374a-5p, miR-194-5p, and let-7d-5p by single RT-qPCR assay. The release of miRNAs in the supernatant of LNCaP and DU145 cells was measured after treating the cells with US for 15 min, 30 min, and 1 h. The supernatants of untreated control cells were collected before sonication, following incubation with exosomes-depleted medium for the same time. We observed a significant increase in the release of miR-629-5p, miR-374a-5p, and miR-194-5p in LNCaP supernatant after 1h of US treatment compared to untreated cells (miR-629-5p, FC: 6.5; miR-374a-5p, FC: 7.1; miR-194-5p, FC: 6.4), while no significant increase was observed at earlier time points (Figure 3A–C).
Figure 3. Cellular release kinetics of cell-free miRNAs released from US-treated PCa cells. (AC) Single RT-qPCR assay showing cellular release kinetics of (A) mir-629-5p, (B) mir-374-5p, and (C) mir-194-5p in LNCaP supernatant following US treatment for different time periods. (D) Single RT-qPCR assay showing cellular release kinetics of let-7d-5p in DU145 supernatants following US treatment for different time periods. In all panels, the expression values are relative to those of untreated control cells. Values denote means ± SD (n = 3); statistical significance was calculated by two-tailed Student’s t-test. ** p < 0.01; *** p < 0.001; **** p < 0.0001.
Instead, we observed a time-dependent increase of let-7d-5p release in the supernatant from US-treated DU145 cells compared to untreated cells. This increase in miRNA release was already significant after 15 min of US treatment (FC: 2.8) and augmented when the cells were treated for longer times (30′ treatment, FC: 40; 1h treatment, FC: 81.3) (Figure 3D).

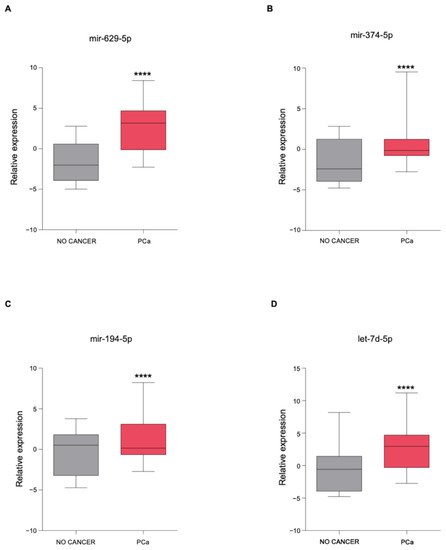
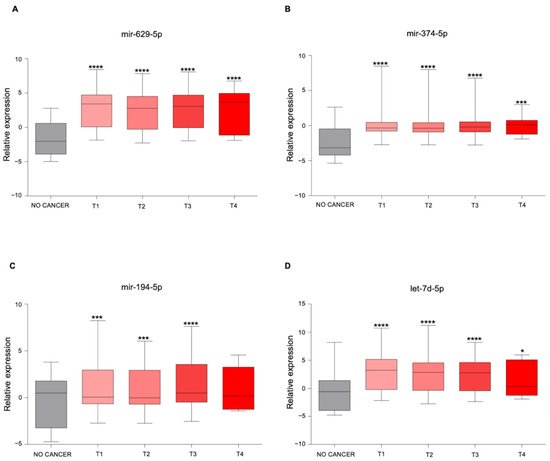
3. The Newly Identified miRNAs Are Upregulated in the Serum from PCa Patients

To understand the clinical significance of these four miRNAs identified in PCa cell supernatants following US treatment, we analyzed their expression in the serum from non-cancer controls (n = 41) and PCa patients (n = 809) using the GSE112264 publicly available dataset. This analysis showed that the serum expression of all miRNAs was significantly upregulated in PCa patients compared to controls (Figure 4A–D), suggesting that these miRNAs could be potentially valuable diagnostic biomarkers.
Figure 4. Expression levels of the newly identified miRNAs in the serum from PCa patients. (AD) Boxplot showing the expression of (A) mir-629-5p, (B) mir-374-5p, (C) mir-194-5p, and (D) let-7d-5p in the serum from control healthy volunteers (n = 41) and human PCa patients (n = 809) reported in the GSE112264 dataset. Shown in the boxplot are the medians (horizontal lines), 25th–75th percentiles (box outlines), and the highest and lowest values within 1.5× of the inter-quartile range (vertical lines). Statistical significance was calculated by using the two-tailed Mann–Whitney U-test. ** p-value < 0.01, **** p-value < 0.0001.
We also analyzed the serum expression of these miRNAs in PCa patients stratified based on tumor stage. The expression levels of mir-629-5p, mir-374-5p, and mir-194-5p were increased in the serum of PCa patients across all tumor stages compared to control sera (Figure 5A–C), while let-7d-5p mRNA levels were significantly higher only in the serum from patients with T1–T3 PCa disease (Figure 5D).
Figure 5. miRNAs expression in the serum from PCa patients stratified according to tumor staging. (AD) Boxplot showing the expression of (A) mir-629-5p, (B) mir-374-5p, (C) mir-194-5p, and (D) let-7d-5p in the serum from control healthy volunteers (n = 41) and human PCa patients from the GSE112264 dataset, stratified according to tumor staging (T1 = 256 samples, T2 = 354 samples, T3 = 183 samples, T4 stage = 16 samples). Shown in the boxplot are the medians (horizontal lines), 25th–75th percentiles (box outlines), and the highest and lowest values within 1.5× of the inter-quartile range (vertical lines). Samples from each tumor stage were compared to control healthy samples by using the two-tailed Mann–Whitney U-test. *, p-value < 0.05; ** p-value < 0.01; *** p-value < 0.001; **** p-value < 0.0001. Statistical significance for multiple comparisons was calculated by using the Kruskal–Wallis test. p-value < 0.0001 (A, B, D); p-value = 0.0146 (C).
Thus, all analyzed miRNAs appeared to be released in the serum of PCa patients in the earlier phases of disease (T1–T2 stages), and their levels remained high as the disease progressed to advanced stages (T3–T4 stages).

4. In Silico miRNA: Gene Interaction Analysis
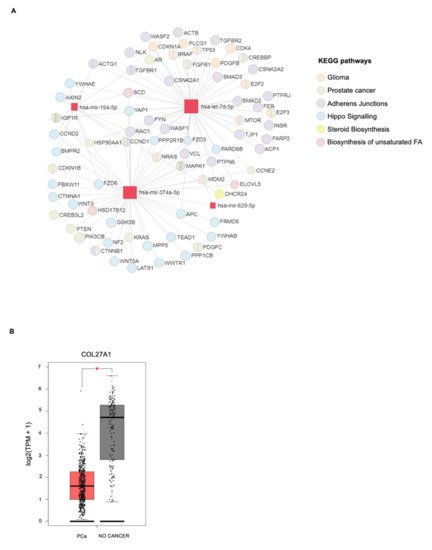
To better characterize the newly PCa-related miRNAs, we conducted an in silico analysis to identify the biological targets of mir-629-5p, mir-374-5p, mir-194-5p, and let-7d-5p, with the aim of defining their roles in PCa development and progression. To this end, DIANA-mirPath 3.0 was used to search out both experimentally validated and putative target genes, by exploiting two different bioinformatic tools: (i) TarBase v7.0, which shows gene targets validated in high-throughput, microarrays, sequencing and proteomic experiments and (ii) microT-CDS, which identifies putative target genes by using an algorithm based on the recognition of positive and negative sets of miRNA Recognition Elements (MREs) located in both the 3’-UTR and the CDS regions. Enrichment analysis of validated miRNA–gene interactions followed by targeted pathway analysis (Figure 6A, Supplementary Table S2) showed that both mir-629-5p and miR-194-5p target the DHCR24 gene, a central regulator of steroid biosynthesis, which is frequently altered in prostate cancer cells [10].
Figure 6. In silico analysis of miRNA–gene interactions. (A) Schematic representation of the miRNA–gene network resulting from the enrichment analysis of validated miRNA–gene interactions followed by targeted pathway analysis. A color code was used for grouping genes from the same KEGGS pathway. (B) Boxplots showing the mRNA expression of COL27A1 in tumor samples of PCa (n = 492) from the PRAD-TCGA dataset and in normal tissues (n = 152) from the TCGA and Genotype-Tissue Expression (GTEx) datasets. Expression analysis was performed and statistical significance was determined using the Gene Expression Profiling Interactive Analysis (GEPIA) web server. TPM, transcripts per million. A–B, * p-value < 0.05.
Among the validated gene targets of both miR-194-5p and miR-374a-5p, we also found CCND2, AXIN2, and BMPR2, regulated by the Hippo signaling pathway, involved in stemness and cancer biology. miR-374a-5p seems also to be involved in the regulation of the biosynthesis of unsaturated fatty acids by targeting genes like ELOVL5, SCD, and HSD17B12, thus reinforcing the well-known correlation between altered lipid metabolism and PCa [11][12][13]. Both miR-374a-5p and let-7d-5p target several genes previously associated with the KEGG PCa pathway. Moreover, we found that let-7d-5p, identified in the supernatant of DU145 following US treatment, regulates genes involved in the glioma-associated KEGG pathway, and this is of interest as DU145 cells were isolated from a brain metastasis of PCa. Indeed, these two KEGG pathways share many genes, such as CCND1, which plays a fundamental role in the regulation of cell cycle and proliferation in both glioma and PCa cells and whose deregulation portends worse clinical outcomes [14][15]. let-7d-5p also modulates genes implicated in cell–cell adherens junctions, suggesting a role for this miRNA in regulating epithelial–mesenchymal transition (EMT), a process promoting PCa metastasis and chemoresistance [16]. In addition to validated gene interactors, we searched for putative target genes of our miRNAs of interest. Enrichment analysis of putative miRNA–gene interactions followed by targeted pathway analysis performed by microT-CDS suggested that miR-629-5p could also target the genes for prolactin receptor (PRLR) and AKT serine/threonine kinase 3 (AKT3), involved in the prolactin signaling pathway, whose alteration may contribute to the pathogenesis of PCa (Table 1) [17][18].
Table 1. Enrichment analysis of putative miRNA–gene interactions followed by targeted pathway analysis.
miRNAs KEGG Pathways p-Value Target Genes
miR-629-5p Prolactin signaling pathway 4.27 × 10⁻³ PRLR
AKT3
miR-194-5p Valine, leucine, and
isoleucine degradation
6.99 × 10⁻⁴ BCKDHA
ACADSB
BCAT1
let-7d-5p ECM–receptor interaction 1.07 × 10⁻² COL27A1
COL3A1
COL1A1
COL1A2
The same analysis showed that miR-194-5p could be also involved in the regulation of branched-chain amino acid degradation, a metabolic process found to be deregulated in PCa progression (Table 1) [19]. Interestingly, among putative targets of let-7d-5p, we found that COL27A1, coding for fibrillar collagen α-1 (XXVII) chain protein and, to our knowledge, never associated with PCa, was the only downregulated gene in PCa patients as reported in The Cancer Genome Atlas (TCGA) compared to controls, suggesting a potential role for this let-7d-5p-target gene in PCa pathogenesis (Table 1, Figure 6B) [20].

This entry is adapted from the peer-reviewed paper 10.3390/genes12111726

References

  1. Chevillet, J.R.; Khokhlova, T.D.; Giraldez, M.D.; Schade, G.R.; Starr, F.; Wang, Y.N.; Gallichotte, E.N.; Wang, K.; Hwang, J.H.; Tewari, M. Release of Cell-free MicroRNA Tumor Biomarkers into the Blood Circulation with Pulsed Focused Ultrasound: A Noninvasive, Anatomically Localized, Molecular Liquid Biopsy. Radiology 2017, 283, 158–167.
  2. D’Souza, A.L.; Chevillet, J.R.; Ghanouni, P.; Yan, X.; Tewari, M.; Gambhir, S.S. Tumor characterization by ultrasound-release of multiple protein and microRNA biomarkers, preclinical and clinical evidence. PLoS ONE 2018, 13, e0194268.
  3. Lentacker, I.; De Cock, I.; Deckers, R.; De Smedt, S.C.; Moonen, C.T.W. Understanding ultrasound induced sonoporation: Definitions and underlying mechanisms. Adv. Drug Deliv. Rev. 2014, 72, 49–64.
  4. Zhou, Y.; Kumon, R.E.; Cui, J.; Deng, C.X. The size of sonoporation pores on the cell membrane. Ultrasound Med. Biol. 2009, 35, 1756–1760.
  5. Miller, M.W.; Battaglia, L.F. The relevance of cell size on ultrasound-induced hemolysis in mouse and human blood in vitro. Ultrasound Med. Biol. 2003, 29, 1479–1485.
  6. Zhang, J.Y.; Su, X.P.; Li, Y.N.; Guo, Y.H. MicroRNA-425-5p promotes the development of prostate cancer via targeting forkhead box J3. Eur. Rev. Med.Pharmacol Sci. 2019, 23, 547–554.
  7. Lyu, J.; Zhao, L.; Wang, F.; Ji, J.; Cao, Z.; Xu, H.; Shi, X.; Zhu, Y.; Zhang, C.; Guo, F.; et al. Discovery and Validation of Serum MicroRNAs as Early Diagnostic Biomarkers for Prostate Cancer in Chinese Population. Biomed Res. Int. 2019, 2019, 9306803.
  8. Mazzu, Y.Z.; Yoshikawa, Y.; Nandakumar, S.; Chakraborty, G.; Armenia, J.; Jehane, L.E.; Lee, G.M.; Kantoff, P.W. Methylation-associated miR-193b silencing activates master drivers of aggressive prostate cancer. Mol. Oncol. 2019, 13, 1944–1958.
  9. Wagner, S.; Ngezahayo, A.; Murua Escobar, H.; Nolte, I. Role of miRNA let-7 and its major targets in prostate cancer. Biomed Res. Int. 2014, 2014, 376326.
  10. Battista, M.C.; Guimond, M.O.; Roberge, C.; Doueik, A.A.; Fazli, L.; Gleave, M.; Sabbagh, R.; Gallo-Payet, N. Inhibition of DHCR24/seladin-1 impairs cellular homeostasis in prostate cancer. Prostate 2010, 70, 921–933.
  11. Kim, S.J.; Choi, H.; Park, S.S.; Chang, C.; Kim, E. Stearoyl CoA desaturase (SCD) facilitates proliferation of prostate cancer cells through enhancement of androgen receptor transactivation. Mol. Cells 2011, 31, 371–377.
  12. Centenera, M.M.; Scott, J.S.; Machiels, J.; Nassar, Z.D.; Miller, D.C.; Zininos, I.; Dehairs, J.; Burvenich, I.J.G.; Zadra, G.; Chetta, P.M.; et al. ELOVL5 is a critical and targetable fatty acid elongase in prostate cancer. Cancer Res. 2021, 81, 1704–1718.
  13. Sun, T.; Oh, W.K.; Jacobus, S.; Regan, M.; Pomerantz, M.; Freedman, M.L.; Lee, G.S.; Kantoff, P.W. The impact of common genetic variations in genes of the sex hormone metabolic pathways on steroid hormone levels and prostate cancer aggressiveness. Cancer Prev. Res. (Phila) 2011, 4, 2044–2050.
  14. Chung, J.H.; Dewal, N.; Sokol, E.; Mathew, P.; Whitehead, R.; Millis, S.Z.; Frampton, G.M.; Bratslavsky, G.; Pal, S.K.; Lee, R.J.; et al. Prospective Comprehensive Genomic Profiling of Primary and Metastatic Prostate Tumors. JCO Precis Oncol. 2019, 3. PO.18.00283.
  15. Ikeda, S.; Elkin, S.K.; Tomson, B.N.; Carter, J.L.; Kurzrock, R. Next-generation sequencing of prostate cancer: Genomic and pathway alterations, potential actionability patterns, and relative rate of use of clinical-grade testing. Cancer Biol. Ther. 2019, 20, 219–226.
  16. Sowalsky, A.G.; Sager, R.; Schaefer, R.J.; Bratslavsky, G.; Pandolfi, P.P.; Balk, S.P.; Kotula, L. Loss of Wave1 gene defines a subtype of lethal prostate cancer. Oncotarget 2015, 6, 12383–12391.
  17. Lin, H.P.; Lin, C.Y.; Huo, C.; Jan, Y.J.; Tseng, J.C.; Jiang, S.S.; Kuo, Y.Y.; Chen, S.C.; Wang, C.T.; Chan, T.M.; et al. AKT3 promotes prostate cancer proliferation cells through regulation of Akt, B-Raf, and TSC1/TSC2. Oncotarget 2015, 6, 27097–27112.
  18. O’Sullivan, C.C.; Bates, S.E. Targeting Prolactin Receptor (PRLR) Signaling in PRLR-Positive Breast and Prostate Cancer. Oncologist 2016, 21, 523–526.
  19. Zhu, W.; Shao, Y.; Peng, Y. MicroRNA-218 inhibits tumor growth and increases chemosensitivity to CDDP treatment by targeting BCAT1 in prostate cancer. Mol. Carcinog. 2017, 56, 1570–1577.
  20. Pace, J.M.; Corrado, M.; Missero, C.; Byers, P.H. Identification, characterization and expression analysis of a new fibrillar collagen gene, COL27A1. Matrix Biol. 2003, 22, 3–14.
More
This entry is offline, you can click here to edit this entry!