Your browser does not fully support modern features. Please upgrade for a smoother experience.
Please note this is an old version of this entry, which may differ significantly from the current revision.
Subjects:
Cell Biology
Despite comprehensive therapy and extensive research, glioblastoma (GBM) still represents the most aggressive brain tumor in adults. Glioma stem cells (GSCs) are thought to play a major role in tumor progression and resistance of GBM cells to radiochemotherapy. The PIM1 kinase has become a focus in cancer research.
- glioblastoma
- PIM1 kinase
- stem-like cells
1. Introduction
Glioblastoma (GBM) represents the most common brain tumor in adults with no curative therapy currently available. Almost all patients suffering from this highly aggressive tumor get a relapse, and the median survival time is only about 15 months, despite maximal surgical resection, radiation and chemotherapy [1][2]. A specific subpopulation of GBM cells, called glioma stem cells (GSCs), have been associated with recurrence and thus poor outcome. It is assumed that successful treatment of GBM can only be achieved by targeting these highly tumorigenic, pro-mitogenic, pro-angiogenic and therapy-resistant GSCs [3][4]. To date, the regulation of the molecular and biological properties of GSCs has not been well understood and remains elusive. Both natural and synthetic compounds have been evaluated for their potential to modify the behavior of GBM cells and GSCs, for instance, cannabinoids, resveratrol crocetin, the botanical drug PBI-05204, EGFR inhibitors, the PI3K/AKT small-molecule inhibitor A-443654, and many others [5][6][7][8]. So far, the clinical impact of their therapeutic use on patient prognosis is not clear, although many of their modes of action are known.
There is increasing evidence that PIM1, as one of three members of the PIM family, plays a role as an oncogenic kinase. Although these three PIM kinases share more than 60% homology, only PIM1 appears to have a significant impact on tumor formation [9][10]. Initially, the gene encoding PIM1 (Proviral Integration site for Moloney Murine Leukemia Virus) was discovered in murine lymphoma samples and shown to be activatable by the integration of the murine leukemia virus into the 3′untranslated region of the PIM1 gene [11]. The PIM1 gene encodes for two protein isoforms called PIM1S (short isoform, 35 kDa) and PIM1L (long isoform, 45 kDa) which are generated from a single mRNA but using different start codons, AUG and atypical CUG, respectively [12].
In contrast to other kinases, PIM1 is a constitutive active enzyme and does not need to be activated by upstream kinases. In healthy cells, PIM1 expression is rather low but inducible by cytokines, growth factors, or ischemic conditions [13][14]. Besides its role in the pathogenesis of lymphoma, PIM1 expression is also elevated in other cancers. An increased PIM1 expression in stomach, esophagus, bladder, breast and ovarian as well as head and neck cancers has been associated with a worse patient prognosis and resistance to therapy [15][16][17][18][19]. Of note, the use of PIM1 inhibitors or silencing of PIM1 expression in vitro resulted in a significant inhibition of the tumor cell growth through induction of apoptosis, cell cycle arrest and sensitization against chemotherapeutic agents [18][20][21][22].
Recently, our group showed that PIM1 is overexpressed in GBM, and pharmacological inhibition of PIM1 resulted in reduced GBM growth both in vitro and in vivo [23]. Suppression of GBM growth was also observed after U1 adaptor-mediated silencing of PIM1 in GBM cells in a subcutaneous xenograft model in mice [24]. Moreover, inhibition of PIM1 sensitizes GBM cells to apoptosis induced by ABT-737, which targets BCL2, BCL2 like 1 and BCL2 like 2 [25]. Thus, blocking PIM1 may be a new therapeutic option for GBM.
However, to date, the role of PIM1 in the development and maintenance of GSCs has not been described, although PIM1 signaling pathways are associated with cancer stem cells in prostate cancer [26]. Very recently, Jiménez-García and colleagues showed that PIM1 is overexpressed in human breast, uterine and ovarian tumors, correlating with inflammatory features as well as stem cell markers [19]. Moreover, inhibition of PIM1 attenuates the stem cell-like properties of breast cancer cells [27]. Of note, PIM1 interacts with AKT1 signaling [28][29], which has previously been shown to be involved in the behavior of GSCs [6][30][31][32].
2. Impact of PIM1 Inhibition on Stem Cell and Differentiation Markers in Human GBM Cells on mRNA Level
First, we analyzed whether inhibition of PIM1 kinase results in an altered expression of candidate stem cell markers (CD44, CD133, Nestin), as well as of the microglia (SPARC) and astrocytic marker protein (GFAP) in the human adherent GBM cell lines LN-18 and U-87 MG on the mRNA level.
Figure 1A (LN-18) and 1B (U-87 MG) show the mRNA data after treatment with either the combined PI3K/PIM1 inhibitor LY294002 (LY) [33], the PIM1 selective blocker quercetagetin (QT) [34] or the PIM1 selective antagonist TCS PIM1-1 (TCS) [35] after 48 h of incubation. We used two different concentrations of the inhibitors, 5 and 50 µM, based on our previous studies, which showed that 5 µM of all tested inhibitors caused only slight blocking of the kinase activity, whereas 50 µM is highly effective as determined by the phosphorylation status of the PIM1 downstream target BAD [23].
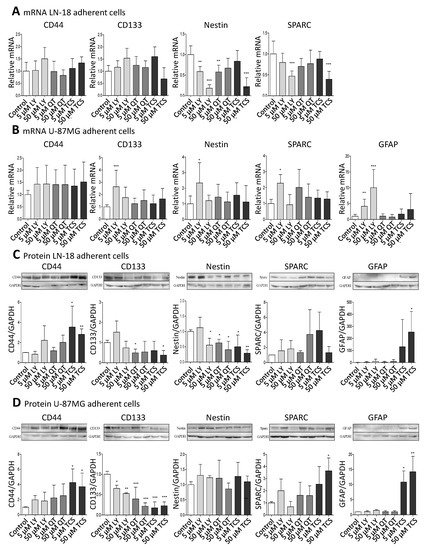
Figure 1. Pharmacological PIM1 blocking regulates expression of stemness and differentiation marker proteins in GBM cells. Human GBM cells (LN-18, U-87 MG) were treated each with 5 or 50 µM of the dual PI3K/PIM1 inhibitor LY294002 (LY), or the selective PIM1 inhibitors quercetagetin (QT) and TCS PIM1-1 (TCS). The respective solvent, dimethylsulfoxide (DMSO), was added to the control cells. (A,B), mRNA level of CD44, CD133, Nestin, SPARC and GFAP in LN-18 (A) and U-87 MG (B) cells determined by quantitative RT–PCR. mRNA content of each target gene was normalized to 18S rRNA and is expressed relative to control GBM cells. Of note, in LN-18 GBM cells, mRNA expression of GFAP was under the limit of detection (cT >36 until undetermined). Results are representative of three independent experiments. Columns represent means and SD, significant differences for * p < 0.05, ** p < 0.005 and *** p < 0.001. (C,D), Protein expression of CD44, CD133, Nestin, SPARC and GFAP in LN-18 (C) and U-87 MG (D) cell lysates by immunoblotting using specific antibodies. GAPDH served as loading control. Protein band intensities were quantified by densitometric analysis (Quantity One, Bio-Rad). The relative optical densities of the specific bands were calculated and normalized to GAPDH. Columns represent means and SD of four or five independent experiments, significant differences for * p < 0.05, ** p < 0.005 and *** p < 0.001.
On the mRNA level, CD44 and CD133 were not significantly regulated by PIM1 antagonists, with the exception of a 2.64-fold (±1.34) increased CD133 mRNA expression after treatment with 5 µM LY294002 in U-87 MG cells. Regarding Nestin, differences at the mRNA level after treatment with PIM1 inhibitors were seen between LN-18 and U-87 MG cells. In LN-18 cells, a significant down-regulation of Nestin mRNA from 1.0 ± 0.21 (control) to 0.59 ± 0.12 (5 µM LY), 0.18 ± 0.09 (50 µM LY), 0.58 ± 0.17 (5 µM QT) and 0.22 ± 0.21 (50 µM TCS) was observed after treatment with PIM1 inhibitors. Such a decrease in Nestin mRNA was not caused in U-87 MG cells; instead, there was a significant up-regulation of Nestin, as already seen for CD133 at low-concentrated LY294002 (5 µM, 2.34 ± 1.30). SPARC was also differently modulated by PIM1 inhibitors in LN-18 cells compared to U-87 MG cells. As seen for Nestin, SPARC mRNA was significantly diminished from 1.0 ± 0.31 (control) to 0.47 ± 0.12 by 50 µM LY294002 and to 0.39 ± 0.19 by 50 µM TCS. A trend for a reduced SPARC mRNA level was also seen for 5 and 50 µM QT (0.70 ± 0.19 and 0.77 ± 0.32). In contrast, the treatment of U-87 MG cells did not cause a significant decrease of SPARC mRNA; instead, an elevated expression was again seen for 5 µM LY294002 (2.28 ± 1.54). GFAP mRNA was almost always under the limit of detection in LN-18 cells (cT >36 or undetermined or invalid), which is in accordance with published data [36], whereas U-87 MG cells expressed GFAP mRNA already at basal conditions. The treatment of U-87 MG cells with 5 and 50 µM LY294002 resulted in a significant about 4-fold (±2.23) and 10-fold (±5.71) up-regulation of GFAP mRNA. QT and TCS had no significant influence on GFAP mRNA content.
3. Impact of PIM1 Inhibitors on Stem Cell and Differentiation Markers in Human GBM Cells on Protein Level
Since mRNA levels do not always correlate well with the respective protein levels, we analyzed the protein amount of the differentiation markers (Figure 1C,D). The protein expression of CD44 was strongly enhanced by TCS in both LN-18 and U-87 MG GBM cells, from a relative value of 1.0 ± 0.02 (control LN-18) and 1.0 ± 0.04 (control U-87 MG) to 3.54 ± 2.08 (LN-18) and 4.26 ± 1.79 (U-87 MG) by 5 µM TCS, and to 2.81 ± 0.54 (LN-18) and 3.71 ± 1.80 (U-87 MG) by 50 µM TCS. A trend for an increased CD44 protein expression was also seen for LY294002 and QT. Regarding the CD133 protein, some differences in the response to PIM1 inhibitors were observed between LN-18 and U-87 MG GBM cells. In LN-18 cells, only treatment with 5 µM QT and 50 µM TCS resulted in a significantly decreased CD133 protein, from a relative value of 1.0 ± 0.12 (control) to 0.49 ± 0.19 (QT) and 0.38 ± 0.23 (TCS), respectively. In contrast, all tested PIM1 inhibitors provoked a significant reduction in CD133 protein in U-87 MG cells. For a concentration of 50 µM, a decrease of CD133 protein from a relative value of 1.0 ± 0.07 (control) to 0.53 ± 0.02 by LY294002, 0.22 (±0.08) by QT and 0.23 (±0.09) by TCS were observed. Some interesting findings were also obtained for Nestin protein. Whereas in U-87 MG GBM cells, an impact of PIM1 inhibitors was absent, LN-18 cells showed a strong down-regulation of Nestin protein after treatment with either LY294002, QT or TCS, particularly at a concentration of 50 µM, from a relative value of 1.0 (±0.06, control) to 0.56 (±0.22, LY), 0.40 (±0.28, QT) and 0.29 (±0.11, TCS), respectively. Regarding SPARC expression, the treatment of LN-18 cells with PIM1 inhibitors failed to cause a significant change in protein content, but a trend to an increased SPARC protein level was seen for 50 µM QT (3.74 ± 3.29) and 5 µM TCS (4.26 ± 2.45) in comparison to control cells. In U-87 MG cells, application of 50 µM TCS resulted in a significant increase of SPARC protein from a relative value of 1.0 ± 0.11 in control cells to 3.64 ± 1.07 upon TCS. LY294002 and QT only marginally influenced the SPARC protein content in U-87 MG cells. Determination of GFAP showed very consistent results in LN-18 and U-87 MG cells. In both cell lines, the astrocytic differentiation marker GFAP was nearly undetectable under basal conditions, but treatment with the PIM1 selective inhibitor TCS (50 µM) caused a significant and strong up-regulation of GFAP protein expression, to 253 ± 170 (LN-18) and 14.3 ± 11.4 (U-87 MG).
4. Expression of PIM1 and Stem Cell Markers in Stem-like LN-18 Neurospheres
To analyze whether PIM1 expression is increased in GBM stem-like cells, we cultured LN-18 as so-called neurospheres (see Materials and Methods) which are described to be enriched in cancer stem cells [37][38]. A comparative presentation of adherent LN-18 cells and neurospheres is shown in Figure 2A. Our neurosphere experiments demonstrated that PIM1 mRNA was significantly up-regulated in LN-18 stem-like neurospheres, to about 4-fold in comparison to the adherent counterpart (Figure 2B). In contrast, PIM2 mRNA was unchanged, and PIM3 mRNA was tendencially decreased in LN-18 neurospheres but this effect was only significant for passage two. As already described before [39], mRNA expression of the well-accepted GBM stem cell markers Nestin and CD133 were also increased four to fivefold in stem-like neurospheres which served as a positive control for the stemness characteristics of LN-18 neurospheres. In addition, mRNA level of CD44, which is also discussed as potential GBM stem cell marker [39][40], was about fivefold higher in LN-18 neurospheres compared to adherent cells.
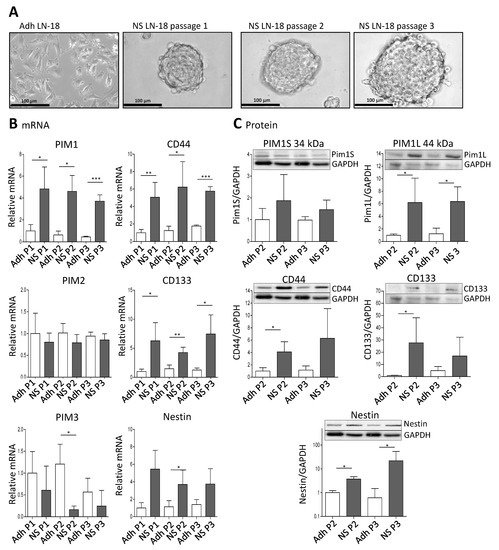
Figure 2. Expression of PIM1 and stem cell marker in LN-18 neurospheres is elevated. Human LN-18 GBM cells were cultured either as adherent monolayer cells or under specific conditions as three-dimensional neurospheres. (A) Representative morphological images of LN-18 adherent monolayer cells (Adh) and neurospheres (NS) at passages one, two and three using phase contrast microscopy. Scale bars represent 100 µm. (B) mRNA levels of PIM kinases (PIM1, PIM2 and PIM3, left panel) as well as of the stem cell markers CD44, CD133 and Nestin, determined by quantitative RT–PCR. mRNA content of each target gene was normalized to the mean of 18S rRNA, TBP, GAPDH and β-Actin gene expression, and is shown relative to adherent LN-18 cells. Results are representative of three (passages one and two) or four (passage 3) independent experiments. Columns represent means and SD, significant differences for * p < 0.05, ** p < 0.005 and *** p < 0.001. (C) Protein expression of both PIM1 kinase isoforms (PIM1S and PIM1L) as well as CD44, CD133 and Nestin in LN-18 adherent and neurosphere cell lysates (passages two and three) by immunoblot analysis using specific antibodies. GAPDH served as a control. Results are representative of three or four independent experiments. Protein band intensities were quantified by densitometric analysis (Quantity One, Bio-Rad). The relative optical densities of the specific bands were calculated and normalized to GAPDH. Columns represent means and SD; significant differences for * p < 0.05.
Regarding protein level, both the short (PIM1S, 35 kDa) and the long isoform (PIM1L, 45 kDa) of PIM1 were detectable (Figure 2C). The PIM1S protein level was not significantly different between adherent LN-18 cells and the respective stem-like neurospheres. In contrast, a significant (about sixfold) increase in PIM1L protein was found in LN-18 neurospheres in comparison to the adherent counterpart. As described in our previous work [39], we found an up-regulation of CD133 and Nestin protein in stem-like LN-18 neurospheres. For CD133, the elevated protein level was only significant for the second passage (about a 40-fold increase), since the variability between the three independent experiments for the third passage was very high. Regarding Nestin, LN-18 neurospheres showed a significantly increased protein content of the stem cell marker (3.7-fold for passage two and about 22-fold for passage three). Furthermore, CD44 protein was up-regulated in LN-18 neurospheres compared to adherent cells, but this was only significant for the second passage (about a fourfold increase).
5. Immunofluorescence Staining of PIM1 and Other Potential Stem Cell Markers in LN-18 Neurospheres
The results obtained by immunoblot analysis (Figure 2C) were verified by immunofluorescence staining. Figure 3 compares the immunofluorescence staining of PIM1 together with either CD44 (Figure 3A,B), CD133 (Figure 3C,D) or Nestin (Figure 3E,F) in adherent LN-18 cells (Figure 3A,C,E) and the respective stem-like neurospheres (Figure 3B,D,F) showing a strong PIM1 expression in LN18 neurospheres, whereas adherent cells expressed PIM1 only marginally (Figure 3B). Nearly the same enhanced protein expression in LN18 neurospheres was observed for CD44, CD133 and Nestin (Figure 3B,D,F) compared to the adherent cells (Figure 3A,C,E). Co-staining of PIM1 with the intermediate filament protein Nestin showed a partly overlapping localization of both proteins in LN-18 neurospheres, seen as yellow cellular structure (Figure 3F). In contrast, despite higher fluorescence signals for both CD133 and CD44 in LN-18 neurospheres compared to the adherent cells, an overlapping localization of these proteins with PIM1 was not clearly recognizable (Figure 3B,D).
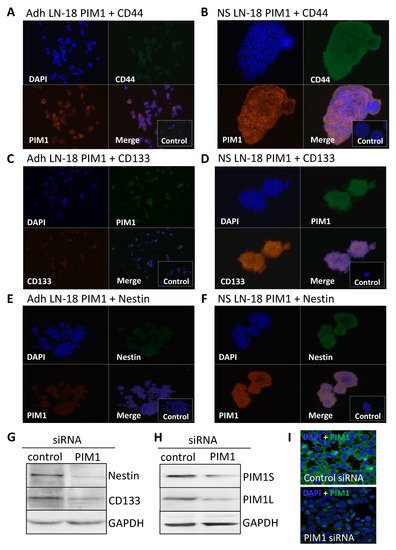
Figure 3. Co-Expression of PIM1 and stem cell markers in GBM neurospheres and after siRNA-mediated knockdown of PIM1. (A–F) Dual immunofluorescence staining of PIM1 (Alexa Fluor® 568) with either CD44 (A,B) or with Nestin (E,F) (both Alexa Fluor® 488) and PIM1 (Alexa Fluor® 488) with CD133 (C,D) (Alexa Fluor® 568) in adherent LN-18 monolayer cells (A,C,E) and the respective neurospheres (B,C,F). The cell nuclei were counterstained using DAPI (blue). Representative images assessed via immunofluorescence microscopy. Cells were also stained with the Alexa Fluor 488®/Alexa Fluor 568® secondary antibodies alone as a control. (G) Expression of Nestin and CD133 after knockdown of PIM1 by siRNA determined by immunoblotting. A representative blot is shown; a non-targeting, scrambled shRNA served as control. (H,I) Confirmation of siRNA-mediated knockdown of PIM1S and PIM1L. (H) A representative Western blot is shown; detection of GAPDH served as loading control. (I) Immunofluorescence staining of PIM1 in LN-18 cells after transfection with control siRNA or PIM1 specific siRNA confirming down-regulation of PIM1. The cell nuclei were counterstained using DAPI (blue). Representative images assessed via immunofluorescence microscopy. Objective of the Zeiss LSM 780 laser scanning confocal microscope: 40x/1.4 DIC (oil).
6. Nestin and CD133 Expression after siRNA-Mediated Knockdown of PIM1
To confirm the results from pharmacological PIM1 blocking, the protein expression of the most accepted GBM stem cell markers Nestin and CD133 were investigated after siRNA-mediated knockdown of PIM1 in adherent LN-18 cells. As demonstrated in Figure 3G, both Nestin and CD133 were strongly reduced after 72 h, to 44.6% and 64%, respectively, in cells transfected with PIM1-specific siRNA compared to control transfected LN-18 cells. The efficiency of the siRNA-mediated PIM1 knockdown was checked on protein level. The protein expression of PIM1S was reduced to 33% and 26% for PIM1L, as indicated by Western blot analysis (Figure 3H). Similar results were obtained by immunofluorescence staining of PIM1 (Figure 3I). Of note, since PIM1 siRNA transfected cells showed very limited growth, it was necessary to pool the cells from three independent experiment to have enough protein for immunoblot analyses.
Recently, we have shown that specific inhibition of PIM1 by TCS PIM1-1 (TCS) causes viability loss, cell cycle arrest and apoptosis in different GBM cell lines (LN-18, U-87 MG and GL261) [23]. To investigate whether inhibition of PIM1 also leads to cytotoxic effects in stem-like LN-18 neurospheres, we treated LN-18 neurospheres with TCS (specific PIM1 inhibitor) [35] and LY294002 (dual PI3K/PIM1 inhibitor) [33] and compared the effects with temozolomide as the standard therapeutic agent in GBM. In Figure 4F, the viability of stem-like LN-18 neurospheres after treatment for 7 days is shown. Whereas temozolomide (100 µM) showed no influence on the viability of LN-18 neurospheres, TCS strongly impaired the cell viability to 8.86 ± 11.4% (20 µM) and 2.56 ± 3.25% (50 µM). Furthermore, treatment with the dual PI3K/PIM1 inhibitor LY294002 (50 µM) also resulted in a significantly decreased viability of LN-18 neurospheres (3.87 ± 3.93%), to the same extent as TCS. For the used concentrations of TCS and LY294002 (50 µM), we recently observed inhibitory effects on PIM1 kinase function by measuring the phosphorylation status of the PIM1 substrate BAD [23].
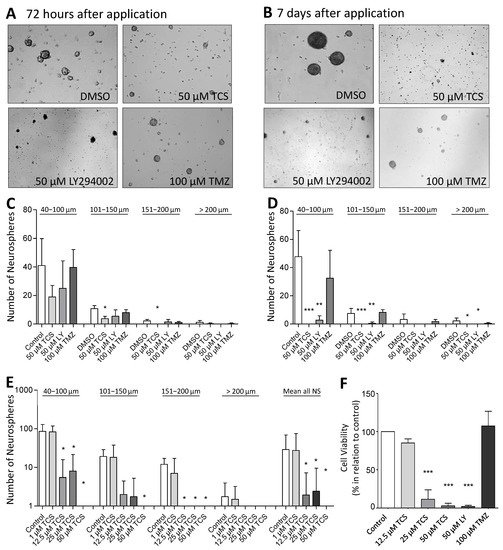
Figure 4. Pharmacological inhibition of PIM1 promotes loss of GBM cell viability and impairs formation of neurospheres. (A,B) PIM1 inhibition significantly impairs neurosphere formation. LN-18 cells were grown as neurospheres for 7 days before treatment with either the selective PIM1 inhibitor TCS PIM1-1 (TCS; 50 µM), the dual PI3K/PIM1 inhibitor LY294002 (50 µM) or temozolomide (TMZ; 100 µM), started for 72 h (A) or 7 days (B). Control cells were treated with the respective solvent DMSO. Representative images of neurospheres at the defined time points are shown. (C,D) Statistical analysis of the average sphere size after treatment with either the selective PIM1 inhibitor TCS PIM1-1 (TCS, 50 µM), the dual PI3K/PIM1 inhibitor LY294002 (LY; 50 µM) or temozolomide (TMZ; 100 µM) for 72 h (C) or 7 days (D). Neurospheres were subdivided according to their sizes in four groups (40–100 µm, 101–150 µm, 151–200 µm and >200 µm), which were separately investigated. Control cells were treated with the solvent DMSO. Columns represent means and SD of four independent experiments, significant differences for * p < 0.05, ** p < 0.005 and *** p < 0.001. (E) Growth characteristics of LN-18 neurospheres after application of increasing TSC PIM1-1 concentrations (TCS; 1, 12.5, 25 and 50 µM). Statistical analysis of the differently sized neurospheres (40–100 µm, 101–150 µm, 151–200 µm and >200 µm) and the total neurosphere number after TCS treatment are shown. Columns represent means and SD of four independent experiments, significant differences for * p < 0.05. (F) Cell viability of LN-18 neurospheres determined by the Resazurine Assay. LN-18 cells were grown as neurospheres for 7 days before treatment with either the selective PIM1 inhibitor TCS PIM1-1 (TCS; 12.5, 25 and 50 µM), the dual PI3K/PIM1 inhibitor LY294002 (LY; 50 µM), temozolomide (TMZ; 100 µM) or the solvent DMSO (control) was started for further 7 days. Columns represent means and SD of four independent experiments, significant differences for *** p < 0.001.
7. Neurosphere Formation after PIM1 Blocking
For further validation of the cytotoxic influence of PIM1 inhibition, we evaluated the neurosphere formation of LN-18 cells by microscopic determination of the number and size of neurospheres after the blocking of PIM1. Figure 4A,B shows representative microscopic images of LN-18 neurospheres, three and seven days after application of either the solvent DMSO, 50 µM TCS, 50 µM LY294002 (LY) or 100 µM temozolomide (TMZ). In particular, an almost complete loss of neurosphere formation was observed seven days after the application of TCS or LY294002. In contrast, when treated with 100 µM TMZ, we observed that although many neurospheres were formed, they were smaller in size. The statistical evaluation of the number and sizes of the LN-18 neurospheres is demonstrated in Figure 4C,D. It is clearly visible that specific blocking of PIM1 resulted in a strongly impaired neurosphere formation, both after three and seven days, which was more pronounced compared to dual PI3K/PIM1 inhibition by LY294002. On day three, the formation of small neurospheres (40–100 µm) and neurospheres of medium size (101–150 µm) were reduced to half and one third, respectively, by 50 µM TCS compared to the control values (DMSO, solvent). Large (151–200 µm) and very large (>200 µm) neurospheres were virtually unavailable after three days of TCS treatment. This cytotoxic effect of the PIM1 inhibitor TCS was even stronger on day seven, and intact LN-18 neurospheres were nearly absent (Figure 4D). The dual PI3K/PIM1 antagonist LY294002 showed inhibitory effects on LN-18 neurosphere formation as early as three days and especially seven days after application, with significantly smaller neurospheres compared to the control. Interestingly, the standard chemotherapeutic TMZ had much lower effects on neurosphere formation in comparison to TCS and LY294002.
In Figure 4E, the effect of 1, 12.5, 25 and 50 µM TCS on the LN-18 formation of neurospheres is illustrated as a graph. The application of 1 µM TCS showed no significant effects on the growth of LN-18 neurospheres, but a concentration of 12.5 µM TCS was sufficient to strongly disturb both small and large neurospheres (Figure 4F).
8. PIM1 Blocking Reduced DNA Synthesis Rate and Induced Apoptosis
The loss of LN-18 neurosphere viability and formation was accompanied by a reduced DNA synthesis rate as determined by the BrdU assay. Data shown in Figure 5A,B demonstrate that the DNA synthesis rates of both LN-18 adherent and neurosphere cells were significantly reduced after treatment with the PIM1 blocker TCS and LY294002 for 72 h. In adherent LN-18 cells, a TCS concentration of 12.5 µM was already enough to significantly reduce the DNA synthesis rate to 36% (±18.4), whereas this was not the case in LN-18 neurospheres. Nonetheless, treatment with 25 and 50 µM TCS resulted in a similarly decreased DNA synthesis rate, to below 5%. Interestingly, the effect of the dual PI3K/PIM1 inhibitor LY294002 on DNA synthesis was somewhat stronger in LN-18 neurospheres (23.8 ± 6.3%), compared to the adherent counterpart (42 ± 18.3%). The standard chemotherapeutic temozolomide showed no influence on DNA synthesis in both adherent and neurosphere cells (Figure 5A,B).
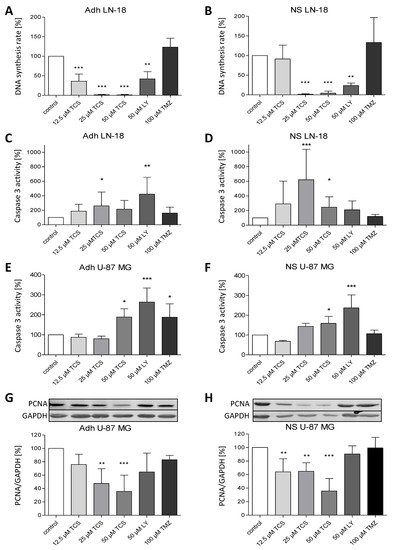
Figure 5. Pharmacological inhibition of PIM1 promotes a reduction in DNA synthesis rate and apoptosis. (A,B) BrdU cell proliferation assay was performed on LN-18 adherent cells (A) and neurospheres (B) to determine the DNA synthesis rate after PIM1 inhibition with TCS PIM1-1 (TCS; 12.5, 25 and 50 µM), LY294002 (LY; 50 µM) and Quercetagetin (QT; 50 µM) as well as treatment with 100 µM temozolomide (TMZ) for 72 h. Columns represent means and SD (n = 4), significant differences for ** p < 0.005 and *** p < 0.001. (C,D) Effects of TCS PIM1-1 (TCS; 12.5, 25 and 50 µM), LY294002 (LY; 50 µM) and Quercetagetin (QT; 50 µM) as well as 100 µM temozolomide (TMZ) on caspase 3 activity after 72 h in LN-18 adherent cells (C) and neurospheres (D) analyzed by a commercially available Caspase 3 fluorometric assay. Results are presented as the means and SD (n = 8–9). * p < 0.05, ** p < 0.005 and *** p < 0.001 in comparison to DMSO (control). (E,F) Effects of TCS PIM1-1 (TCS; 12.5, 25 and 50 µM), LY294002 (LY; 50 µM) and Quercetagetin (QT; 50 µM) as well as 100 µM temozolomide (TMZ) on caspase 3 activity after 72 h in U-87 MG adherent cells (E) and neurospheres (F) analyzed by a commercially available Caspase 3 fluorometric assay. Results are presented as the means and SD (n = 4–5), * p < 0.05, and *** p < 0.001 in comparison to DMSO (control). (G,H) Expression of PCNA as proliferation marker determined by immunoblot analyses after treatment of U-87 MG adherent cells (G) and neurospheres (H) with TCS PIM1-1 (TCS; 12.5, 25 and 50 µM), LY294002 (LY; 50 µM) and Quercetagetin (QT; 50 µM) as well as 100 µM temozolomide (TMZ) for 72 h. GAPDH was used as loading control for normalization. Results are presented as the means and SD (n = 4–5). ** p < 0.005 and *** p < 0.001 in comparison to DMSO (control).
Furthermore, caspase 3 activation was investigated to test whether apoptosis is induced by PIM1 blocking. In contrast to TMZ, which had no effect on caspase 3 activity, application of both TCS and LY294002 resulted in a partially significant increase of caspase 3 activity in LN-18 adherent cells (Figure 5C) and neurospheres (Figure 5D), depending on the concentration used. However, direct comparison showed that the induction of caspase 3 by TCS was stronger in LN-18 neurospheres, especially at a concentration of 25 µM, with an activity value of 260 ± 67.8% in adherent cells and 620 ± 417.4% in neurospheres. On the other hand, as seen for the DNA synthesis rate, LY294002 showed more elevated caspase 3 activity in adherent LN-18 cells (422.8 ± 231.9%) compared to LN-18 neurospheres (210 ± 121.8%). Caspase 3 activity was also significantly increased, by 50 µM TCS PIM1-1 and LY294002, to 189 ± 41.4% and 264 ± 69.9% in adherent U-87 MG cells, which was somewhat lower in U-87 MG neurospheres, with values of 159 ± 35.1% and 237 ± 65.3%, respectively (Figure 5E,F).
As a proliferation marker, we additionally analyzed the expression of PCNA (Proliferating Cell Nuclear Antigen) in U-87 MG cells. As seen in Figure 5G,H, PCNA protein expression was significantly reduced by TCS PIM1-1 in both adherent and stem-like U-87 MG neurospheres, to a similar extent, with values of 35.8 ± 24.2% (adherent cells) and 35.8 ± 18.3% (neurospheres), by treatment with 50 µM TCS for 72 h.
This entry is adapted from the peer-reviewed paper 10.3390/ijms222011126
References
- Stupp, R.; Mason, W.P. Radiotherapy plus concomitant and adjuvant temozolomide for glioblastoma. N. Engl. J. Med. 2005, 352, 987–996.
- Anton, K.; Baehring, J.M. Glioblastoma multiforme: Overview of current treatment and future perspectives. Hematol. Oncol. Clin. N. Am. 2012, 26, 825–853.
- Clarke, M.F.; Dick, J.E. Cancer stem cell—Perspectives on current status and future directions: AACR Workshop on cancer stem cells. Cancer Res. 2006, 66, 9339–9344.
- Park, D.M.; Rich, J.N. Biology of glioma cancer stem cells. Mol. Cells 2009, 28, 7–12.
- Alves, A.L.V.; Gomes, I.N.F. Role of glioblastoma stem cells in cancer therapeutic resistance: A perspective on antineoplastic agents from natural sources and chemical derivatives. Stem Cell Res. 2021, 12, 206–228.
- Colapietro, A.; Mancini, A. Crocetin Extracted from Saffron Shows Antitumor Effects in Models of Human Glioblastoma. Int. J. Mol. Sci. 2020, 21, 423.
- Colapietro, A.; Yang, P. The Botanical Drug PBI-05204, a Supercritical CO2 Extract of Nerium Oleander, Inhibits Growth of Human Glioblastoma, Reduces Akt/mTOR Activities, and Modulates GSC Cell-Renewal Properties. Front. Pharm. 2020, 11, 552428–552441.
- Gallia, G.L.; Tyler, B.M. Inhibition of Akt inhibits growth of glioblastoma and glioblastoma stem-like cells. Mol. Cancer 2009, 8, 386–393.
- Magnuson, N.S.; Wang, Z. Why target PIM1 for cancer diagnosis and treatment? Future Oncol. 2010, 6, 1461–1478.
- Brault, L.; Gasser, C. PIM serine/threonine kinases in the pathogenesis and therapy of hematologic malignancies and solid cancers. Haematologica 2010, 95, 1004–1015.
- Cuypers, H.T.; Selten, G. Murine leukemia virus-induced T-cell lymphomagenesis: Integration of proviruses in a distinct chromosomal region. Cell 1984, 37, 141–150.
- Saris, C.J.; Domen, J. The pim-1 oncogene encodes two related protein-serine/threonine kinases by alternative initiation at AUG and CUG. EMBO J. 1991, 10, 655–664.
- Shah, N.; Pang, B. Potential roles for the PIM1 kinase in human cancer—A molecular and therapeutic appraisal. Eur. J. Cancer 2008, 44, 2144–2151.
- Bachmann, M.; Möröy, T. The serine/threonine kinase Pim-1. Int. J. Biochem. Cell Biol. 2005, 37, 726–730.
- Warnecke-Eberz, U.; Bollschweiler, E. Prognostic impact of protein overexpression of the proto-oncogene PIM-1 in gastric cancer. Anticancer. Res. 2009, 29, 4451–4455.
- Nawijn, M.C.; Alendar, A. For better or for worse: The role of Pim oncogenes in tumorigenesis. Nat. Rev. Cancer 2011, 11, 23–34.
- Liu, H.-T.; Wang, N. Overexpression of Pim-1 is associated with poor prognosis in patients with esophageal squamous cell carcinoma. J. Surg. Oncol. 2010, 102, 683–688.
- Guo, S.; Mao, X. Overexpression of Pim-1 in bladder cancer. J. Exp. Clin. Cancer Res. 2010, 29, 161–167.
- Jiménez-García, M.-P.; Lucena-Cacace, A. Inflammation and stem markers association to PIM1/PIM2 kinase-induced tumors in breast and uterus. Oncotarget 2017, 8, 58872–58886.
- Pogacic, V.; Bullock, A.N. Structural analysis identifies imidazo1,2-bpyridazines as PIM kinase inhibitors with in vitro antileukemic activity. Cancer Res. 2007, 67, 6916–6924.
- Akué-Gédu, R.; Rossignol, E. Synthesis, kinase inhibitory potencies, and in vitro antiproliferative evaluation of new Pim kinase inhibitors. J. Med. Chem. 2009, 52, 6369–6381.
- Mumenthaler, S.M.; Ng, P.Y.B. Pharmacologic inhibition of Pim kinases alters prostate cancer cell growth and resensitizes chemoresistant cells to taxanes. Mol. Cancer 2009, 8, 2882–2893.
- Herzog, S.; Fink, M.A. Pim1 kinase is upregulated in glioblastoma multiforme and mediates tumor cell survival. Neuro-Oncology 2014, 17, 223–242.
- Weirauch, U.; Grünweller, A. U1 Adaptors for the Therapeutic Knockdown of the Oncogene Pim-1 Kinase in Glioblastoma. Nucleic. Acid. 2013, 23, 264–272.
- Remy, J.; Linder, B. Inhibition of PIM1 blocks the autophagic flux to sensitize glioblastoma cells to ABT-737-induced apoptosis. Biochim. Biophys. Acta Mol. Cell Res. 2019, 1866, 175–189.
- Xie, Y.; Bayakhmetov, S. PIM1 kinase as a promise of targeted therapy in prostate cancer stem cells. Mol. Clin. Oncol. 2015, 4, 13–17.
- Liu, H.; Chen, C. Inhibition of PIM1 attenuates the stem cell–like traits of breast cancer cells by promoting RUNX3 nuclear retention. J. Cell Mol. Med. 2020, 24, 6308–6323.
- Hu, X.F.; Li, J. PIM-1-specific mAb suppresses human and mouse tumor growth by decreasing PIM-1 levels, reducing Akt phosphorylation, and activating apoptosis. J. Clin. Investig. 2009, 119, 362–375.
- Krishnan, N.; Pan, H. Prolactin-regulated pim-1 transcription: Identification of critical promoter elements and Akt signaling. Endocrine 2003, 20, 123–130.
- Moon, S.-H.; Kim, D.-K. PI3K/Akt and Stat3 signaling regulated by PTEN control of the cancer stem cell population, proliferation and senescence in a glioblastoma cell line. Int. J. Oncol. 2013, 42, 921–928.
- Jhanwar-Uniyal, M.; Albert, L. Deciphering the signaling pathways of cancer stem cells of glioblastoma multiforme: Role of Akt/mTOR and MAPK pathways. Adv. Enzym. Regul. 2011, 51, 164–170.
- Molina, J.R.; Hayashi, Y. Invasive glioblastoma cells acquire stemness and increased Akt activation. Neoplasia 2010, 12, 453–463.
- Jacobs, M.D.; Black, J. Pim-1 ligand-bound structures reveal the mechanism of serine/threonine kinase inhibition by LY294002. J. Biol. Chem. 2005, 280, 13728–13734.
- Holder, S.; Zemskova, M. Characterization of a potent and selective small-molecule inhibitor of the PIM1 kinase. Mol. Cancer 2007, 6, 163–172.
- Cheney, I.W.; Yan, S. Identification and structure-activity relationships of substituted pyridones as inhibitors of Pim-1 kinase. Bioorg. Med. Chem. Lett. 2007, 17, 1679–1683.
- Godbout, R.; Bisgrove, D.A. Correlation of B-FABP and GFAP expression in malignant glioma. Oncogene 1998, 16, 1955–1962.
- Liu, G.; Yuan, X. Analysis of gene expression and chemoresistance of CD133+ cancer stem cells in glioblastoma. Mol. Cancer 2006, 5, 67–75.
- Iacopino, F.; Angelucci, C. Isolation of cancer stem cells from three human glioblastoma cell lines: Characterization of two selected clones. PLoS ONE 2014, 9, e114081.
- Bien-Möller, S.; Balz, E. Association of Glioblastoma Multiforme Stem Cell Characteristics, Differentiation, and Microglia Marker Genes with Patient Survival. Stem Cells Int. 2018, 9628, 289–301.
- Pietras, A.; Katz, A.M. Osteopontin-CD44 signaling in the glioma perivascular niche enhances cancer stem cell phenotypes and promotes aggressive tumor growth. Cell Stem Cell 2014, 14, 357–369.
This entry is offline, you can click here to edit this entry!