Both vegetative and reproductive growth are continuously adjusted to daily, seasonal or temporal depletion of water availability and other environmental factors
[23][24][25]. Plant growth depends on the homeostasis and hydraulic effect of water and the flow of water and nutrients in the vascular system. The regulation of transpiration by stomata is essential to regulate photosynthetic activity, as well as transport of photosynthates throughout the plant
[26][27][28][29][30]. Traditionally, plants have been classified in two groups depending on their hydraulic behaviour
[31][32][33]. Isohydric (water-saving) plants maintain water potential by reducing stomatal conductance and transpiration. Anisohydric (water-wasting) plants osmotically adjust to maintain cell turgor by increasing cellular potassium levels and by synthesising osmolytes such as sugars and amino acids
[34][35]. The riskier anisohydric approach sustains growth and development under shorter-term droughts, while the more conservative isohydric response is better for passive survival under longer term droughts
[31][36][37]. During evolution of land plants, acquisition of stomata in bryophytes and lycophytes and recruitment of the phytohormone abscisic acid (ABA) for regulation of stomatal conductance are both linked
[38][39]. Stomatal closure restricts gas exchange, ultimately leading to repression of photosynthetic activity; it also restricts the transpiration stream and transport of photosynthates
[6][40][41]. In reproductive tissues, ABA represses sugar supply and sink strength in anthers, causing abortion of pollen development and sterility under drought conditions
[42]. The negative effects of ABA on reproductive development contradict the perceived beneficial effects of the hormone on drought tolerance at the vegetative stage
[40][43][44]. The role of ABA in the response to drought remains therefore controversial and in need of further research
[45].
2. Drought Stress Does Not Induce ABA Biosynthesis Genes in Drought-tolerant Halberd Spikes
We previously studied the effect of drought stress at the YM stage of pollen development using drought-tolerant line Halberd and sensitive line Cranbrook
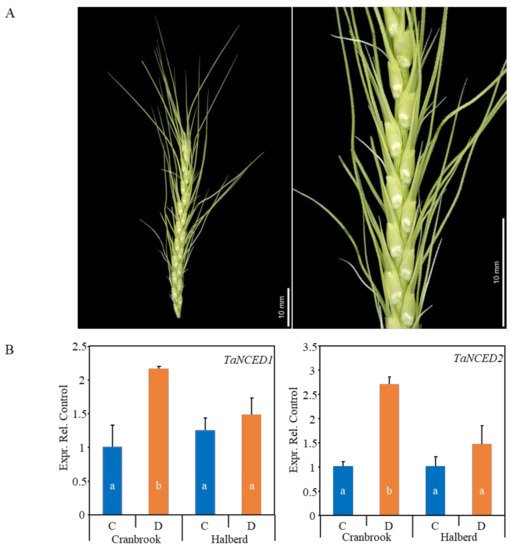
[42][46]. In this paper we extend this investigation to both reproductive (YM-stage whole spikes) and vegetative tissues (flag leaves) using the same two wheat lines. At the YM stage, the spike is actively developing while surrounded and supported by the leaf sheath of the flag leaf and penultimate leaf (
Figure 1A). We tested whether expression of the
TaNCED1 and
TaNCED2 genes encoding the ABA biosynthesis enzyme nine-cis-epocycarotenoid dioxygenase (NCED) was the same in the whole spike compared to what we previously observed in dissected anthers.
TaNCED1 and
TaNCED2 were both induced 2- to 3-fold by drought stress in the sensitive variety Cranbrook, but there was no significant effect on the expression of these genes in the tolerant variety Halberd (
Figure 1B). This expression pattern is the same of what we previously observed for dissected YM stage anthers of the same two wheat lines
[42].
Figure 1. (A) The picture shows a YM stage wheat spike dissected from the leaf sheaths. The close-up and inset shows the spikelets and florets respectively at the time of pollen meiosis. Plants were drought-stressed at this stage and dissected spike material was used for transcriptome and hormone analysis. (B) Real-time PCR expression analysis of the wheat TaNCED1 and TaNCED2 ABA biosynthetic genes in unstressed control (C) and drought-stressed (D) Cranbrook and Halberd spikes. Each sample consisted of three repeats and error bars represent standard errors. Bars in the graph labelled with different letters are significantly different compared to the Cranbrook unstressed control (C) (t-test; p < 0.05).
3. Drought-Tolerant Wheat Maintains Stomatal Conductance Longer under Drought Conditions
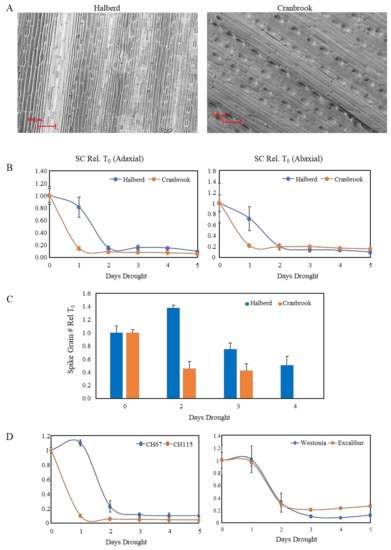
The difference in expression of NCED genes in drought-stressed Cranbrook and Halberd prompted us to look for differences in stomatal conductance in flag leaves under drought conditions. The flag leaf is the last and youngest leaf to develop on the wheat plant and is not affected by leaf senescence. SEM images of the adaxial side of Cranbrook and Halberd flag leaves (Figure 2A) were used to compare the stomatal density per square unit (SEM picture at 62× magnification) for the two wheat varieties. The average stomatal density of Cranbrook (72.6 ± 6.7) was lower than for Halberd flag leaves (96.7 ± 5.6; p < 0.05). However, the average guard cell length of Cranbrook stomata (73.6 µm ± 2.1) was higher than for Halberd (68.1 µm ± 1.4; p < 0.05).
Figure 2. (A) Scanning electron microscope pictures of Cranbrook and Halberd flag leaves. The pictures were used to measure stomatal density and length of the guard cells using Fiji software. (B) Stomatal conductance (SC) measurements of Cranbrook and Halberd flag leaves over a period of 5-days of drought treatment. Five porometer readings were taken at each time point and results were averaged (error bars are standard errors). The data are expressed relative to the T0 unstressed control plants. (C) Effect of drought stress on Cranbrook and Halberd spike grain numbers. Plants from the 5-day drought time course experiment were re-watered at different time points and allowed to develop to maturity. Spike grain numbers were determined for 5-10 spikes per time point and spike grain numbers were expressed relative to unstressed T0 numbers. Error bars represent standard errors. (D) SC measurements for a 5-day drought stress time course experiment for a drought-tolerant (CH67) and a drought-sensitive (CH115) tail line of a Cranbrook × Halberd DH population (left) and two additional wheat varieties with known reproductive stage drought tolerance (Excalibur and Westonia; right).
A time course experiment was established to measure stomatal conductance (SC) daily over five days of water withholding (start at T0). SC measurements were carried out for the top (adaxial) and bottom (abaxial) side of the flag leaf. Porometer measurements indicate that after the first day of drought treatment (T1) both adaxial and abaxial stomata were closed for the drought-sensitive line Cranbrook (Figure 2B). In contrast, for the tolerant line Halberd stomata were still open (adaxial) or partially open (abaxial) after the first day of drought stress (T1), but they were closed from the second day of drought stress onwards (T2; Figure 2B). SC was reduced slightly faster for the abaxial stomata for both wheat lines (Figure 2B).
Induction of stomatal closure correlated well with induction of spike sterility in both wheat lines. When plants were re-watered after two days of drought treatment (standard drought treatment), Cranbrook spike grain numbers were reduced to 45% of unstressed control levels; after 4 days of drought treatment, grain loss was ~100% (
Figure 2C). In Halberd, spike grain numbers were not affected after two days drought stress. After three and four days, Halberd spike grain numbers were reduced to 75% and 50% of the unstressed control levels, respectively (
Figure 2C). The high reproducibility of the drought treatment allowed us to compare the drought response of Cranbrook and Halberd with other wheat lines. The lines CH67 and CH115 were identified as the most drought-tolerant and sensitive lines respectively of the Cranbrook × Halberd DH mapping population
[47]. Porometer measurements showed that the drought-tolerant line CH67 also maintains SC up to the second day of drought treatment, while sensitive line CH115 closed stomata after the first day of drought treatment (
Figure 2D). We tested the drought response of stomata for two additional drought-tolerant wheat varieties with similar drought tolerance to Halberd (data not shown) to test whether other drought-tolerant germplasm from a different genetic background behaves in the same way as Halberd and CH67. Both Westonia and Excalibur showed the same SC behaviour as the tolerant lines Halberd and CH67, closing stomata after the second day of drought treatment (
Figure 2D).
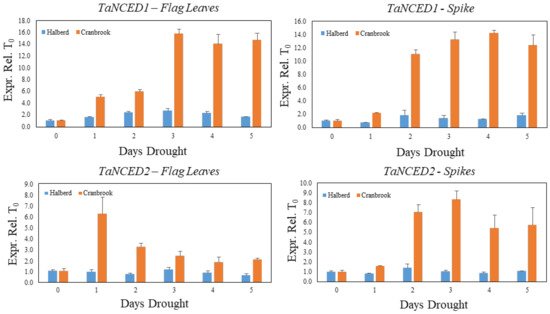
We used a similar drought stress time course experiment as described in Figure 2 to monitor the expression of the TaNCED1 and TaNCED2 genes during establishment of drought stress in Cranbrook and Halberd flag leaves and spikes. The expression of TaNCED1 is induced five-fold after the first day of drought stress in Cranbrook flag leaves and expression increases further to reach maximal expression after three days (15.7-fold increase). TaNCED1 expression then remains high after five days of drought treatment (Figure 3). In flag leaves of the tolerant line Halberd, TaNCED1 expression is much lower and remains low throughout the five-day drought treatment, showing a 2.4-fold increase in flag leaves after two days of drought treatment (Figure 3). In Cranbrook spikes that were sampled from the same plants as the flag leaves, TaNCED1 was induced two-fold after the first day of drought treatment and the gene was induced 11- to 14-fold from the second day onwards (Figure 3). Expression of TaNCED2 was also strongly induced in Cranbrook flag leaves after the first day of drought treatment, but the expression level gradually decreased afterwards (Figure 3). In Halberd flag leaves TaNCED2 expression is low, and we could not find any significant induction of the gene over the five-day treatment period (Figure 3). In Cranbrook spikes, TaNCED2 expression was induced 1.6-fold after the first day of drought treatment and the expression increased further, peaking after three days of drought treatment (8.3-fold; Figure 3). TaNCED2 expression in Halberd spikes showed a slight induction after two days but overall expression remained very low (Figure 3).
Figure 3. Evolution of TaNCED1 and TaNCED2 gene expression in Cranbrook and Halberd flag leaves and spikes during the 5-day drought time course experiment (Figure 2). Three repeat samples were tested per time point and error bars represent standard errors.
The SC results indicate that reproductive stage drought-sensitive Cranbrook behaves as an isohydric variety, closing stomata immediately from the start of drought treatment, and ABA biosynthesis genes are strongly induced in both spikes and flag leaves. In contrast, the reproductive stage drought-tolerant line Halberd behaves initially like an anisohydric variety, keeping stomata open and expression of ABA synthesis genes low. However, at T2 Halberd tends to perform like an isohydric line; stomata also close, even though TaNCED1 and TaNCED2 expression levels remain low, spike sterility increases).
4. Quantitative Differences in the Cranbrook and Halberd Drought Response
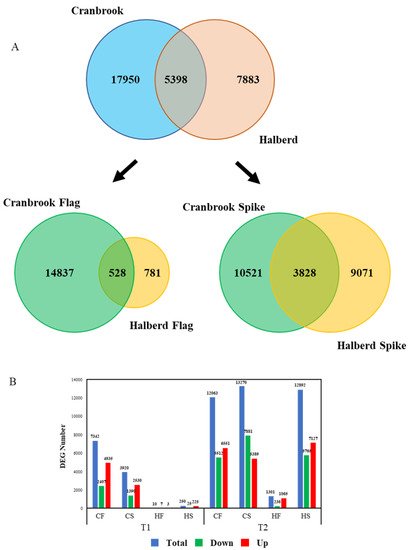
We carried out an RNAseq experiment using Cranbrook and Halberd spike and flag leaf mRNA to identify the differences in drought response between the two wheat lines. YM stage spikes and flag leaves were harvested from control unstressed plants (T0), and one (T1) and two-day (T2) drought-stressed plants. The entire experiment yielded a total of 30,626 differentially expressed genes (DEG). For Cranbrook we identified 23,348 DEGs, while significantly less DEGs were identified for Halberd (13,281). The overlap between the total DEGs of both lines is relatively low: 5398 DEGs (Figure 4A). The difference between the drought response of the two wheat lines becomes clearer when the response in spikes and flag leaves is separated. In flag leaves there is a large difference in the number of DEGs between drought-sensitive Cranbrook and tolerant Halberd. In Cranbrook flag leaves, 15,365 DEGs were identified for T1 and T2 combined, while in drought-tolerant Halberd there were 1309 DEGs for both time points. The overlap in flag leaf T1 and T2 DEGs between the two lines is only 528 DEGs (Figure 4A). In spikes the difference in the total amount of DEGs between Cranbrook and Halberd is less dramatic: 14,349 Cranbrook and 12,899 Halberd DEGs for the two time points combined and the overlap between the spike DEGs for both lines at T1 and T2 is again small: 3828 DEGs (Figure 4A).
Figure 4. (A) Quantitative analysis of the transcriptome data using Venn diagrams. The diagrams represent the comparison of the total DEG numbers for Cranbrook and Halberd flag leaves and spikes (top) and the flag leaf and spike DEG numbers for each separately (bottom graph). (B) Break-up of the DEG numbers in total, up-regulated and down-regulated gene numbers at each time point for Cranbrook (C) and Halberd (H) flag leaves (HF, CF) and spikes (HS, CS).
Separating the two time points of drought treatment showed that at T1, Halberd flag leaves and spikes had only 10 and 250 DEGs respectively. In contrast, Cranbrook showed 7342 and 3920 DEGs in flag leaves and spikes respectively (Figure 4B). At T2, the number of DEGs increased further in both tissues for Cranbrook. In Halberd, the number of DEGs also increased at T2, but the response in flag leaves remained restricted (1301 genes) compared to spikes (12,892 genes; Figure 4B). These results demonstrate a dramatic quantitative difference in drought-induced gene expression between Cranbrook and Halberd, both in flag leaves and spikes. Cranbrook is more sensitive to drought and responds from T1 onwards. In Halberd the drought response is delayed to T2; this correlates with the delay in stomatal closure we observed for this line. But the size of overlap in DEGs also indicates that there are significant qualitative differences in drought response between the two lines. Another striking difference between the two lines is the difference in spike and flag leaf response in drought tolerant Halberd at T2; this pattern was not observed for Cranbrook at T1.
5. Biological Processes Affected by Drought in Cranbrook and Halberd Spikes and Flag Leaves
GO enrichment analysis was used to identify significant functional differences in the drought response of the tolerant and sensitive wheat lines. GO enrichment analysis was first carried out using all DEGs for each line and each tissue, focusing on biological processes (BP; Table 1 and Table 2). In Halberd flag leaves, the largest enrichment of DEGs occur for the GO terms ‘regulation of cellular processes’, ‘biological processes’ and ‘transcription’ (Table 1). Many genes present in these top three GO terms overlap; they contain bZIP/G-box binding factor transcription factors (10 genes), homeodomain (12 genes) and heat stress factors (HSF; 13 genes). There are 2 differentially expressed WRKY transcription factor genes and both are repressed in Halberd flag leaves and spikes (Supplementary Data S5). The bZIP/G-box binding factors (GBF) are induced or repressed in Halberd (T2) and Cranbrook (T1 and T2) flag leaves and spikes, but their magnitude of response to drought is larger in Cranbrook (Supplementary Data S5). bZIP/GBF may play a role in ABA signalling. Five genes belong to the ‘photosynthesis, light reactions’ term; they are significantly enriched and up-regulated by drought in both Halberd flag leaves and spikes. The drought stress related GO terms ‘proline biosynthesis’ and ‘response to desiccation’ are enriched in both Halberd and Cranbrook flag leaves and spikes. Three potassium transporter genes were also significantly enriched (Table 1). They were repressed in both Halberd flag leaves and spikes and repressed in Cranbrook flag leaves only (Supplementary Data S5). The ‘lipid transport’ term contains 6 non-specific lipid-transfer protein (LTP) genes which are mostly drought-induced at T2 in Halberd flag leaves.
Table 1. GO enrichment analysis for biological processes (BP) using Halberd and Cranbrook flag leaf DEG.
| Halberd Flag Leaf BP GO Enrichment |
Cranbrook Flag Leaf BP GO Enrichment |
| GO.ID |
Term |
Annotated |
Significant |
Expected |
Classic |
GO.ID |
Term |
Annotated |
Significant |
Expected |
Classic |
| GO:0050794 |
regulation of cellular process |
383 |
46 |
24.36 |
5.70 × 10⁻⁶ |
GO:0019538 |
protein metabolic process |
514 |
316 |
248.09 |
2.00 × 10⁻¹¹ |
| GO:0050789 |
regulation of biological process |
400 |
46 |
25.44 |
1.90 × 10⁻⁵ |
GO:0010467 |
gene expression |
413 |
273 |
199.34 |
2.10 × 10⁻¹⁵ |
| GO:0006355 |
regulation of transcription, DNA-templat… |
264 |
38 |
16.79 |
5.20 × 10⁻⁷ |
GO:0006796 |
phosphate-containing compound metabolic … |
413 |
257 |
199.34 |
4.90 × 10⁻¹⁰ |
| GO:1903506 |
regulation of nucleic acid-templated tra… |
264 |
38 |
16.79 |
5.20 × 10⁻⁷ |
GO:0016070 |
RNA metabolic process |
337 |
212 |
162.66 |
6.20 × 10⁻⁹ |
| GO:2000112 |
regulation of cellular macromolecule bio… |
272 |
38 |
17.3 |
1.10 × 10⁻⁶ |
GO:0006468 |
protein phosphorylation |
298 |
182 |
143.84 |
1.80 × 10⁻⁶ |
| GO:0009790 |
embryo development |
15 |
7 |
0.95 |
1.60 × 10⁻⁵ |
GO:0006355 |
regulation of transcription, DNA-templat… |
264 |
167 |
127.43 |
1.90 × 10⁻⁷ |
| GO:0006032 |
chitin catabolic process |
22 |
7 |
1.4 |
0.00028 |
GO:0043043 |
peptide biosynthetic process |
100 |
76 |
48.27 |
7.70 × 10⁻⁹ |
| GO:0006869 |
lipid transport |
20 |
6 |
1.27 |
0.00111 |
GO:0006633 |
fatty acid biosynthetic process |
85 |
49 |
41.03 |
0.0497 |
| GO:0019684 |
photosynthesis, light reaction |
5 |
5 |
0.32 |
9.90× 10⁻⁷ |
GO:0015672 |
monovalent inorganic cation transport |
31 |
24 |
14.96 |
0.00084 |
| GO:0006086 |
acetyl-CoA biosynthetic process from pyr… |
3 |
3 |
0.19 |
0.00025 |
GO:0006559 |
L-phenylalanine catabolic process |
32 |
24 |
15.45 |
0.00182 |
| GO:0006094 |
gluconeogenesis |
3 |
3 |
0.19 |
0.00025 |
GO:0072528 |
pyrimidine-containing compound biosynthe… |
19 |
14 |
9.17 |
0.02206 |
| GO:0006099 |
tricarboxylic acid cycle |
3 |
3 |
0.19 |
0.00025 |
GO:0046856 |
phosphatidylinositol dephosphorylation |
13 |
12 |
6.27 |
0.00113 |
| GO:0006561 |
proline biosynthetic process |
3 |
3 |
0.19 |
0.00025 |
GO:0016192 |
vesicle-mediated transport |
17 |
12 |
8.21 |
0.05353 |
| GO:0006816 |
calcium ion transport |
4 |
3 |
0.25 |
0.00097 |
GO:0006563 |
L-serine metabolic process |
15 |
11 |
7.24 |
0.04451 |
| GO:0006415 |
translational termination |
5 |
3 |
0.32 |
0.0023 |
GO:0006081 |
cellular aldehyde metabolic process |
8 |
8 |
3.86 |
0.00291 |
| GO:0009269 |
response to desiccation |
6 |
3 |
0.38 |
0.00438 |
GO:0006544 |
glycine metabolic process |
8 |
7 |
3.86 |
0.02803 |
| GO:0006183 |
GTP biosynthetic process |
8 |
3 |
0.51 |
0.01116 |
GO:0006656 |
phosphatidylcholine biosynthetic process |
6 |
6 |
2.9 |
0.01257 |
| GO:0006228 |
UTP biosynthetic process |
8 |
3 |
0.51 |
0.01116 |
GO:0009107 |
lipoate biosynthetic process |
6 |
6 |
2.9 |
0.01257 |
| GO:0015696 |
ammonium transport |
8 |
3 |
0.51 |
0.01116 |
GO:0009269 |
response to desiccation |
6 |
6 |
2.9 |
0.01257 |
| GO:0006536 |
glutamate metabolic process |
11 |
3 |
0.7 |
0.02855 |
GO:0042128 |
nitrate assimilation |
6 |
6 |
2.9 |
0.01257 |
| GO:0006813 |
potassium ion transport |
13 |
3 |
0.83 |
0.04507 |
GO:0006006 |
glucose metabolic process |
5 |
5 |
2.41 |
0.0261 |
| GO:0015743 |
malate transport |
3 |
2 |
0.19 |
0.01156 |
GO:0006012 |
galactose metabolic process |
5 |
5 |
2.41 |
0.0261 |
| GO:0006730 |
one-carbon metabolic process |
6 |
2 |
0.38 |
0.05091 |
GO:0007205 |
protein kinase C-activating G protein-co… |
5 |
5 |
2.41 |
0.0261 |
| |
|
|
|
|
|
GO:0009101 |
glycoprotein biosynthetic process |
5 |
5 |
2.41 |
0.0261 |
| |
|
|
|
|
|
GO:0006353 |
DNA-templated transcription, termination |
4 |
4 |
1.93 |
0.05415 |
| |
|
|
|
|
|
GO:0006680 |
glucosylceramide catabolic process |
4 |
4 |
1.93 |
0.05415 |
| |
|
|
|
|
|
GO:0015914 |
phospholipid transport |
4 |
4 |
1.93 |
0.05415 |
| |
|
|
|
|
|
GO:0032957 |
inositol trisphosphate metabolic process |
4 |
4 |
1.93 |
0.05415 |
| |
|
|
|
|
|
GO:0042372 |
phylloquinone biosynthetic process |
4 |
4 |
1.93 |
0.05415 |
| |
|
|
|
|
|
GO:0046168 |
glycerol-3-phosphate catabolic process |
4 |
4 |
1.93 |
0.0541 |
GO terms highlighted in red were referred to in the Results section. The ‘Annotated’, ‘Significant’ and ‘Expected’ columns refer to the total number of genes covered by each GO term, the number of those genes that were significantly enriched by cold treatment, and the expected frequency of these genes under normal conditions, respectively. The ‘classic’ column lists the Fisher’s exact test results for each GO term. All Go terms with p < 0.05 were considered significant and listed in ascending order in this table.
Table 2. GO enrichment analysis for biological processes (BP) using all Halberd and Cranbrook spike DEG.
| Halberd Spike BP GO Enrichment |
Cranbrook Spike BP GO Enrichment |
| GO.ID |
Term |
Annotated |
Significant |
Expected |
Classic |
GO.ID |
Term |
Annotated |
Significant |
Expected |
Classic |
| GO:0050896 |
response to stimulus |
372 |
221 |
167.73 |
1.90 × 10⁻⁹ |
GO:0051179 |
localization |
451 |
260 |
230.41 |
0.00137 |
| GO:0005975 |
carbohydrate metabolic process |
185 |
107 |
83.41 |
0.00021 |
GO:0051234 |
establishment of localization |
449 |
258 |
229.39 |
0.00186 |
| GO:0008610 |
lipid biosynthetic process |
99 |
59 |
44.64 |
0.00222 |
GO:0006810 |
transport |
449 |
258 |
229.39 |
0.00186 |
| GO:0007017 |
microtubule-based process |
60 |
49 |
27.05 |
4.50 × 10⁻⁹ |
GO:0015979 |
photosynthesis |
55 |
52 |
28.1 |
1.50 × 10⁻¹² |
| GO:0007018 |
microtubule-based movement |
59 |
48 |
26.6 |
8.30 × 10⁻⁹ |
GO:0042592 |
homeostatic process |
39 |
31 |
19.92 |
0.00022 |
| GO:0009057 |
macromolecule catabolic process |
65 |
47 |
29.31 |
6.40 × 10⁻⁶ |
GO:0006820 |
anion transport |
40 |
28 |
20.44 |
0.01146 |
| GO:0009733 |
response to auxin |
58 |
41 |
26.15 |
6.10 × 10⁻⁵ |
GO:0045454 |
cell redox homeostasis |
34 |
26 |
17.37 |
0.00208 |
| GO:0006073 |
cellular glucan metabolic process |
51 |
35 |
22.99 |
0.00053 |
GO:0033014 |
tetrapyrrole biosynthetic process |
23 |
23 |
11.75 |
1.80 × 10⁻⁷ |
| GO:0007275 |
multicellular organism development |
45 |
33 |
20.29 |
0.0001 |
GO:0006032 |
chitin catabolic process |
22 |
19 |
11.24 |
0.00058 |
| GO:0042546 |
cell wall biogenesis |
46 |
27 |
20.74 |
0.04294 |
GO:0006418 |
tRNA aminoacylation for protein translat… |
26 |
19 |
13.28 |
0.01862 |
| GO:0034655 |
nucleobase-containing compound catabol… |
25 |
18 |
11.27 |
0.00579 |
GO:0046148 |
pigment biosynthetic process |
23 |
18 |
11.75 |
0.00692 |
| GO:0006032 |
chitin catabolic process |
22 |
17 |
9.92 |
0.00213 |
GO:0006814 |
sodium ion transport |
16 |
16 |
8.17 |
2.10 × 10⁻⁵ |
| GO:0006260 |
DNA replication |
23 |
17 |
10.37 |
0.00474 |
GO:0006364 |
rRNA processing |
15 |
14 |
7.66 |
0.00063 |
| GO:0000160 |
phosphorelay signal transduction system |
19 |
13 |
8.57 |
0.03435 |
GO:0046856 |
phosphatidylinositol dephosphorylation |
13 |
12 |
6.64 |
0.00213 |
| GO:0007049 |
cell cycle |
12 |
12 |
5.41 |
6.90 × 10⁻⁵ |
GO:0016226 |
iron-sulfur cluster assembly |
12 |
11 |
6.13 |
0.00389 |
| GO:0009690 |
cytokinin metabolic process |
15 |
12 |
6.76 |
0.00633 |
GO:0009082 |
branched-chain amino acid biosynthetic p… |
10 |
10 |
5.11 |
0.00119 |
| GO:0006308 |
DNA catabolic process |
16 |
12 |
7.21 |
0.01497 |
GO:0006096 |
glycolytic process |
7 |
7 |
3.58 |
0.00902 |
| GO:0033875 |
ribonucleoside bisphosphate metabolic pr… |
11 |
11 |
4.96 |
0.00015 |
GO:1901663 |
quinone biosynthetic process |
6 |
6 |
3.07 |
0.01769 |
| GO:0034032 |
purine nucleoside bisphosphate metabolic… |
11 |
11 |
4.96 |
0.00015 |
GO:0006006 |
glucose metabolic process |
5 |
5 |
2.55 |
0.03469 |
| GO:0009269 |
response to desiccation |
6 |
6 |
2.71 |
0.00835 |
GO:0006817 |
phosphate ion transport |
5 |
5 |
2.55 |
0.03469 |
| GO:0015969 |
guanosine tetraphosphate metabolic proce… |
6 |
6 |
2.71 |
0.00835 |
GO:0007205 |
protein kinase C-activating G protein-co… |
5 |
5 |
2.55 |
0.03469 |
| GO:0006002 |
fructose 6-phosphate metabolic process |
5 |
5 |
2.25 |
0.01855 |
GO:0046836 |
glycolipid transport |
5 |
5 |
2.55 |
0.03469 |
| GO:0006275 |
regulation of DNA replication |
5 |
5 |
2.25 |
0.01855 |
|
|
|
|
|
|
| GO:0007205 |
protein kinase C-activating G protein-co… |
5 |
5 |
2.25 |
0.01855 |
|
|
|
|
|
|
| GO:0006635 |
fatty acid beta-oxidation |
4 |
4 |
1.8 |
0.04122 |
|
|
|
|
|
|
GO terms highlighted in red were referred to in the Results section. The ‘Annotated’, ‘Significant’ and ‘Expected’ columns refer to the total number of genes covered by each GO term, the number of those genes that were significantly enriched by cold treatment, and the expected frequency of these genes under normal conditions, respectively. The ‘Classic’ column lists the Fisher’s exact test results for each GO term. All Go terms with p < 0.05 were considered significant and listed in ascending order in this table.
In Cranbrook flag leaves, the spectrum of enriched genes was larger than in Halberd (Table 1). The top two enriched GO terms are ‘protein metabolic process’ and ‘gene expression’. The ‘protein metabolic process’ term contains several genes encoding ribosomal proteins, translation initiation factors and ribosomal proteins that play a role in mRNA translation. Interestingly, these genes are all repressed in Cranbrook flag leaves only and some are repressed in spikes as well. This suggests that translational activity is interrupted by drought stress in Cranbrook. The ‘gene expression’ class in Cranbrook also contains different types of transcription factors. Some classes of transcription factors are shared with Halberd, but there are more gene copies representing these classes: 17 bZIP/G-box binding factors, 28 homeobox and 24 HSF transcription factors (Supplementary Data S5). Enrichment of WRKY-type transcription factors is also more prevalent (38 genes, vs. 2 genes in Halberd) and many WRKY genes were induced from T1 onwards. Interestingly, there were also 10 genes encoding auxin-response factors (ARF; seven induced, three repressed). Only two of these ARFs were also expressed in Halberd (Supplementary Data S5). There were 8 enriched MADS-box transcription factors in Cranbrook flag leaves; seven were induced at T2, while one was repressed at T1. MADS-box factors play a role in reproductive development and were not significantly enriched in drought-stressed Halberd flag leaves. Three wheat phytochrome A (PhyA) genes were present amongst the ‘gene expression’ GO terms. Two of these genes were induced from T1 onwards in Cranbrook and from T2 in Halberd (Supplementary Data S5). The ‘fatty acid biosynthetic process’ term is also enriched in Cranbrook flag leaves. This term includes 29 3-ketoacyl-CoA synthase and 13 fatty acid hydroxylase genes which may be involved in cuticular wax synthesis.
In Halberd spikes, the GO term ‘response to stimulus’ contained the largest amount of DEGs (Table 2). This class contains several known stress responsive genes encoding ABA-stress-ripening, Late Embryogenesis Abundant (LEA) and Universal Stress Proteins (USP). Most of these genes are predominantly induced in Halberd spikes (Supplementary Data S6). An important set of genes encoding proteins involved in protection against Reactive Oxygen Species (ROS) is also represented in this GO term: catalase (Four genes), glutathione peroxidase (2), peroxidase (76), thioredoxin (3). The presence of ‘lipid biosynthetic process’ GO term is represented by 59 genes, indicating that changes in membrane lipids are important in drought-stressed Halberd spikes. The ‘response to desiccation’ and ‘response to stimulus’ GO terms include 6 LEA genes, while the microtubule and cell cycle related GO terms contained several genes (e.g., kinesin) that were repressed at T2 in Halberd spikes (Supplementary Data S6). The ‘lipid biosynthetic process’ term consists of 59 genes involved in lipid (3-oxoacyl-synthase, acyl-desaturase) and cuticular wax synthesis (3-ketoacyl-CoA synthase, fatty acid hydroxylase).
‘Auxin response’ and ‘cytokinin metabolic process’ GO terms are enriched in the Halberd spike BP GO terms only (Table 2). The ‘auxin response’ term is represented by 37 genes of the Small Auxin Up-Regulated (SAUR) gene family, while the ‘cytokinin metabolic process’ term contains 12 cytokinin dehydrogenase (CkDH) genes (Supplementary Data S6). Most of the SAUR and cytokinin dehydrogenase genes are induced at T2 in Halberd spikes and only one is also induced at T2 in the flag leaves. The same genes were repressed in Cranbrook flag leaves at T1 and/or T2 and they were not differentially expressed in Cranbrook spikes.
In Cranbrook spikes, the three dominant GO terms relate to localisation and transport, including transporters and permeases, as well as aquaporin genes that are responsible for movement of water across membranes (Table 2). Other enriched GO terms relate to photosynthesis and chlorophyll synthesis: ‘photosynthesis’, ‘tetrapyrrole biosynthetic process’ and ‘pigment biosynthetic process’ (Supplementary Data S6). Again, the genes included in these terms are mostly repressed at T2 in Cranbrook spike and flag leaves, indicating that photosynthetic activity is arrested by drought stress in the sensitive line. The timing of this event correlates with the timing of stomatal closure in Cranbrook flag leaves from T1 onwards (Figure 2B). In terms of protection against ROS, the response of Cranbrook is less substantial than Halberd, with induction of only 12 thioredoxin genes (GO term ‘cell redox homeostasis’).
The BP GO enrichment analysis reveals five important differences in the drought response of Halberd and Cranbrook. Firstly, Halberd maintains growth by keeping stomata open and mounts a stronger stress defence response to achieve this: induction of photosynthesis genes, stronger ROS defence, induction of LEA and USP genes. But at T2, cell division processes in Halberd spikes are starting to be affected by drought as well - which agrees with the onset of stomatal closure. Secondly, Cranbrook is entering in growth stagnation mode: repression of transcriptional/translational activity and photosynthesis, weaker response to ROS compared to Halberd. Thirdly, while the response in Cranbrook spikes and flag leaves starts at T1, in Halberd most responses are activated from T2 onwards. This shows that Cranbrook is more sensitive to water stress, which agrees with the earlier stomatal closure we observed for this line compared to Halberd (Figure 2). Interestingly, the response at T2 in Halberd is very different from the response at T1 in Cranbrook. Fourthly, modifications in membrane lipid synthesis to maintain membrane fluidity, and cuticular wax deposition to seal cell walls to prevent water loss, occur in both wheat lines. However, in Cranbrook the response is confined to the flag leaves, while in Halberd the response is more substantial and occurs mainly in the spike. Fifthly, the presence of ‘auxin response’ and ‘cytokinin metabolism’ enriched GO terms at T2 in Halberd spikes only indicates that these two growth hormones may be involved in controlling the stress tolerance phenotype of this wheat line.
6. Differences in Spike and Flag Leaf Drought Stress Response between Cranbrook and Halberd
We carried out a GO enrichment analysis for Molecular Functions (MF) using the ‘total’ and ‘specific’ (= not including overlapping genes) DEGs for each wheat variety. The results of the MF GO term analyses are listed in Supplementary Data S7. The analysis revealed a large amount of molecular and physiological processes that are affected by drought stress. Obvious observations are the enrichment of a large amount of protein kinase (receptor kinase, Ser/Thr kinase) and disease resistance genes that are specifically induced by drought stress in Cranbrook flag leaves (‘anion binding’ GO term). The prevalence of disease resistance genes in the response to drought illustrates that the role of these genes extends beyond pathogen defence. In Halberd flag leaves and spikes, a large amount of P450-type oxidoreductase enzymes are enriched (‘oxidoreductase activity’, ‘heme binding’ GO terms). P450 enzymes play a role in many metabolic processes, including hormone metabolism. In Cranbrook spikes, genes encoding P450 family enzymes are also enriched, but there is a substantial difference in the genes enriched in Halberd and Cranbrook spikes (Supplementary Data S7). Another striking difference in the drought response between the two wheat lines is the enrichment of many genes encoding histone superfamily proteins (‘DNA binding’ GO term) in Halberd spikes; most of these chromatin modification genes are repressed in Halberd only.
The drought response in Halberd is also characterised by enrichment of genes encoding the peroxidase oxidative stress response enzyme in flag leaves (9 genes) and spikes (73 genes), as well as 3 genes encoding catalase in spikes (‘heme binding’ GO term). This may indicate that the tolerant line has a better ROS defence response compared to sensitive line Cranbrook. In Halberd, enrichment for genes involved in lipid metabolism and cuticular wax/cuticle deposition is also more dominant compared to Cranbrook. 11 (7 repressed and 4 induced) acyl-[acyl-carrier-protein] 6-desaturase genes are enriched at T2 in Halberd spikes only (‘oxidoreductase activity acting on the aldehyde or oxo group of donors, NAD or NADP as acceptor’ GO term; Supplementary Data S7). Enrichment for genes involved in long-chain fatty acid production for cuticular wax deposition include 7 fatty acyl-CoA reductases (‘oxidoreductase activity’ GO term) induced in Halberd spikes, 4 and 12 fatty acyl-CoA reductases in Halberd and Cranbrook spikes respectively (‘oxidoreductase activity’ GO term) and 7 fatty acid hydroxylases in Halberd flag leaves (‘oxidoreductase activity’ GO term). The fatty acyl-CoA reductase genes in Cranbrook are repressed in the spike and induced in the flag leaf. Three classes of genes involved in lipid transport, lipid homeostasis and cuticle deposition in the membrane and cell wall space are also enriched. Several GDSL esterase/lipase genes (‘hydrolase activity’, ‘catalytic activity’ GO terms) are specifically enriched in Halberd (83 genes) and Cranbrook (48 genes) spikes. While in Halberd these genes are mainly induced/repressed by drought in the spike, in Cranbrook some genes are also expressed in the flag leaf. Genes encoding HXXXD-type acyl-transferase family proteins are enriched in Halberd spikes (12) and Cranbrook flag leaves (73 genes). 19 ABC transporter genes (‘transmembrane transporter activity’) are enriched in Cranbrook flag leaves and only four of these genes are induced by drought in Halberd spikes (Supplementary Data S7). Although we observed a functional overlap in lipid responses in the two wheat varieties, the GDSL esterase/lipase and HXXXD-type acyl-transferase gene copies recruited by both varieties are different. This may indicate that these genes respond to different regulatory cues in the tolerant and sensitive wheat lines. It is possible that the use of different lipid metabolism genes in both wheat lines may lead to differences in membrane composition and fluidity, as well as differences in water permeability of the cuticle in both wheat lines.
7. Identification of Drought Responsive CBF/DREB Factors in Halberd and Cranbrook
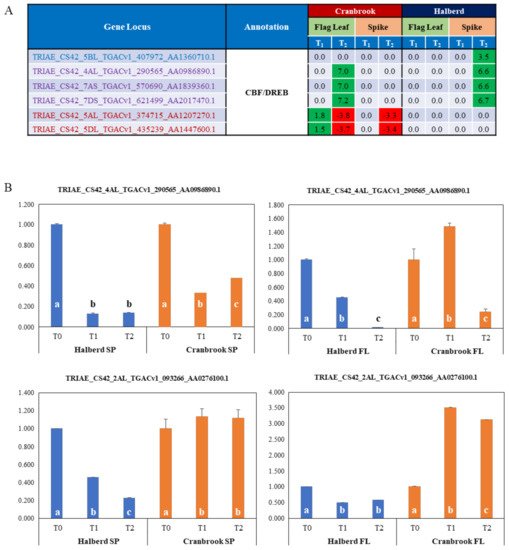
Many classes of transcription factors (ERF, Myb, Zinc finger factors, ERF, bHLH) are enriched in Halberd and Cranbrook spikes and flag leaves. Of special interest for response to drought stress are CBF/DREB transcription factors. The MF GO enrichment analysis identified a total of 6 enriched CBF/DREB genes and the expression of these genes is quite different in the two wheat lines and the two tissue types. four genes are significantly enriched in Halberd spikes and 5 in Cranbrook flag leaves (‘DNA-binding transcription factor activity’ term); the expression pattern of these genes is shown in Figure 5A. Three of these genes are shared by the two wheat lines, but in Cranbrook they are induced at T2 in flag leaves, while in Halberd they are expressed at T2 in the spike. One gene is only expressed at T2 in Halberd spikes, while another two genes are only expressed in Cranbrook flag leaves (induced at T1, repressed at T2) and spikes (induced at T2). The total DEG list contained an additional 6 CBF/DREB-like genes (total of 12 genes; Supplementary Data S8). We tested the expression of two genes (one significantly enriched and one non-enriched gene) using RNA from a new drought treatment experiment (Figure 5B). The TRIAE_CS42_4AL_TGACv1_290565_AA0986890.1 gene showed induction by drought stress in Cranbrook flag leaves, but not in spikes - where the gene is repressed. This CBF/DREB gene is also repressed in Halberd flag leaves and spikes. The TRIAE_CS42_2AL_TGACv1_093266_AA0276100.1 gene is strongly induced by drought in Cranbrook flag leaves but is repressed in spikes. In Halberd this gene is again repressed in both flag leaves and spikes (Figure 5B). Although expression levels of this gene were similar in Cranbrook and Halberd flag leaves, expression was much higher in Halberd spikes at T0 (21-fold) and remained higher than Cranbrook at T2 (6.3-fold). These results indicate that CBF/DREB genes are expressed quite differently in flag leaves and spikes of the drought-tolerant and sensitive wheat lines used in this study.
Figure 5. (A) List of potential CBF/DREB encoding genes that are significantly enriched in Cranbrook and Halberd flag leaves and spikes, and their LogFC expression values relative to unstressed plants (green = up-regulated; red = down-regulated). Gene loci in blue and red are specifically enriched in Halberd and Cranbrook respectively and loci in purple are enriched in both wheat lines. (B) Real-time PCR gene expression analysis of two CBF/DREB genes, including one enriched gene the list in A and another non-enriched CBF/DREB gene (see Supplementary Data S8). Data are the average of three repeat samples and error bars represent standard errors. Gene expression levels are relative to the unstressed control (=1) for each wheat line and bars in the graph labelled with different letters are significantly different (t-test; p < 0.05).
8. Differential Expression of ABA-Related Genes in Drought-Stressed Cranbrook and Halberd
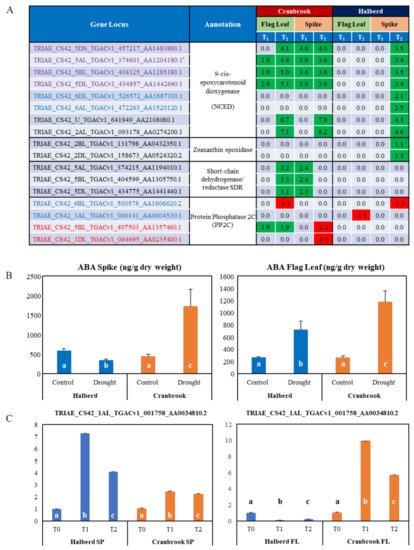
The MF analysis revealed that a total of eight TaNCED genes were enriched in spikes and flag leaves of both wheat lines. All eight genes were enriched in Halberd spikes only, while six where enriched in both spikes and flag leaves of Cranbrook (Figure 6A). While six TaNCED genes were expressed in both Halberd and Cranbrook spikes, two genes were specific for Halberd spikes (see below). TaNCED2 is one of the enriched genes (asterisk in Figure 6A), but the closest match for the TaNCED1 gene (see Materials and Methods) was not present in the DEG list. In Cranbrook flag leaves, three TaNCED genes (including TaNCED2) were induced after one day of drought stress, while six TaNCED genes were induced after the second day of drought treatment (Figure 6A). In contrast, Halberd flag leaves did not show any significant induction for any of the TaNCED genes at both time points. In Cranbrook spikes, four TaNCED genes were already induced by drought stress after one day and six genes were induced after the second day of treatment (Figure 6A). All eight TaNCED genes were induced in Halberd spikes, but only after the second day of drought stress. The two TaNCED genes that were induced by drought at T2 in Halberd spikes only may encode the closely related carotenoid cleavage dioxygenase enzyme (CCD). Overall induction levels of TaNCED genes in Halberd spikes are lower than in Cranbrook spikes and flag leaves (Figure 6A).
Figure 6. (A) List of genes involved in ABA synthesis and signaling. The NCED and PP2C genes were significantly enriched; gene loci in blue and red are specifically enriched in Halberd and Cranbrook, loci in purple are enriched in both wheat lines. Other potential ABA biosynthetic genes encoding zeaxanthin epoxidase and short-chain dehydrogenase/reductases were also amongst the DEG and were added to the list. The TaNCED2 gene used for expression analysis in Figure 1B is marked with an asterisk. The expression data are listed as Log FC values relative to unstressed plants (green = up-regulated; red = down-regulated). (B) Determination of ABA concentrations in control and drought-stressed Halberd and Cranbrook flag leaves and spikes. Average ABA levels are expressed in ng/g dry weight (Y-axis). Three repeats were used for each measurement and error bars are standard errors. ABA levels that are significantly different compared the Halberd unstressed control and compared to the other samples in the graph are labelled with different letters (t-test; p < 0.05). (C) Real-time PCR expression studies of one candidate bZIP transcription factor gene. Three repeat samples were tested and error bars show standard errors. FL = flag leaf; SP = spike. Gene expression levels are relative to the unstressed control (=1) for each wheat line and bars in the graph labelled with different letters are significantly different (t-test; p < 0.05).
We carried out ABA measurements in flag leaves and spikes after a two-day drought stress treatment (T
2;
Figure 6B). The results show that ABA levels increase significantly in drought-stressed Cranbrook flag leaves and spikes as compared to control. Despite the induction of
TaNCED genes in Halberd spikes at T
2, ABA levels in spikes were found to be reduced by drought stress. In contrast, in Halberd flag leaves the ABA level increased ~3.5-fold (
Figure 6B), even though
TaNCED genes are not significantly induced (
Figure 6A). Drought-tolerant line Halberd is somehow able to repress ABA accumulation in the spike, possibly through fast catabolism or mobilisation of the hormone. ABA accumulation in the flag leaf may be the result of transport from the roots or the spike, or recruitment from stored ABA conjugates. The lower levels of ABA in Halberd flag leaves may be sufficient to initiate stomatal closure after two days of drought treatment. It is possible that ABA levels in Halberd flag leaves reach higher levels during prolonged drought treatment (>2 days). Two other potential ABA biosynthetic genes were identified in the DEG list. In Cranbrook, three genes encoding short chain dehydrogenase/reductases (
SDR), enzymes producing carotenoid precursors for ABA biosynthesis
[48], were induced at T
2 in flag leaves and at T
1 in spikes (
Figure 6A). These genes were not differentially expressed in Halberd. In Halberd, two genes potentially encoding zeaxanthin epoxidase, the first committed step in ABA biosynthesis from carotenoid precursors, were drought-induced in spikes at T
2 (
Figure 6A).
Four genes encoding protein phosphatase 2C (PP2C; ‘catalytic activity’ term) were significantly enriched in Cranbrook flag leaves, as well as Halberd spikes and flag leaves (Supplementary Data S7). The two genes enriched in Halberd are repressed by drought stress, while one gene is induced at T
1 and T
2 in Cranbrook flag leaves. Many more potential PP2C genes are amongst the DEG and they are differentially expressed in both wheat varieties (Supplementary Data S8). Members of the PP2C gene family are important components of the ABA signalling pathway and control proline and osmolyte accumulation under drought stress
[49]. 23 bZIP transcription factors and potential G-box binding factors were also identified using the GO term enrichment analysis. Eleven of these genes were DEGs in Cranbrook only and most are induced or repressed from T
2 onwards and mainly in flag leaves; 5 genes are repressed and 5 induced in Halberd flag leaves (Supplementary Data S8). We confirmed the expression pattern for one of these bZIP transcription factors (TRIAE_CS42_1AL_ TGACv1_001758_AA0034810.2;
Figure 6C) to illustrate the difference in expression of this gene in Halberd and Cranbrook flag leaves and spikes.