2.1. Phenotypic Effect of the AHL Soil Treatments on Ginseng Seedlings
To observe the phenotypic effect of the AHL treatments, the growth parameters (shoot length, root length, shoot weight, root weight, and dry biomass) of the ginseng seedlings were recorded after two months of growth. The mortality rates of the baby ginseng plants after two months of development were also recorded. Surprisingly, no ginseng seedlings were found dead or exhibited disease in the mono-cropped ginseng soil (W), thus constituting a 0% mortality rate. Meanwhile, for the AHL treatments, 33.33% mortality rate was observed (4/12) in the C8-treated soil, while 8.33% (1/12), and 0.25% (3/12) mortality were observed in the C10- and C12-treated soils, respectively. However, the phenotypic result involving the shoot length, root length, wet, and dry biomass showed otherwise. Interestingly, the W sample showed the highest average root length (14.67 cm) but had the lowest average root weight (0.51 g). On the other hand, the treatment that involved C10 gave the highest average shoot length, shoot weight, and root weight (6.06 cm, 0.61 g, and 0.83 g, respectively). For the dry biomass, the dry weight of both the roots and shoots was measured. Our results showed that treatment with C10 yielded the highest dry biomass (0.15 g of the shoot and 0.32 g of the root), which was statistically significant in comparison to W, which showed the lowest value (0.08 g of the dry shoot and 0.18 g of the dry root; p < 0.05). Overall, soils treated with AHL showed better plant growth, with C10 showing the best phenotypic results except for the root length. The results are summarized in Table 1 and Figure 1.
Figure 1. Effect of the treatment of the acyl-homoserine lactones (C8, C10, C12) on the growth of ginseng.
Table 1. Comparison of plant growth parameters using the root, shoot length, wet, and dry biomass contributed by N-acyl homoserine lactone treatments.
2.2. Microbial Community Shifts Involving AHL Treatments on Ginseng Soil
After processing the raw sequence files, we obtained a total of 273,217 reads, constituting 5347 ASVs. At the phylum level for the treated soil samples, we observed that Proteobacteria was the most dominant of the three treatments, C8 having 35.94%, C10 33.68%, and C12, 33.76%. Meanwhile, mono-cropped W showed a slightly lower percentage, although Proteobacteria also dominated it (30.87%). Mono-cropped BS, on the other hand, was dominated by the Firmicutes phylum at 32.50%. At the class level, all samples showed a high amount of γ-proteobacteria, with C8 showing 28.58%, C10 23.58%, and C12 25.00%, while the planted mono-cropped soil P showed 24.50%, and mono-cropped BS showed 21.70%. The family level was also checked, and similar results were obtained, with Pseudomonadaceae having the highest relative abundance for all samples (15.53%, 10.12%, 13.31%, 13.66%, and 14.24% for C8, C10, C12, W, and BS samples, respectively) (Figure 2). Focusing on the top 10 taxa at the genus level, a high amount of Pseudomonas for all samples was observed. At the same time, we also see an increase of Catenibacterium and Bifidobacterium for W and BS samples. On the other hand, an increase in Pseudolabrys and Uncultured_Acidobacteriales was seen in the C10 and C12 samples.
Figure 2. Relative abundance of different samples. A represents the relative abundance of the phylum, class, and family, and genus level.
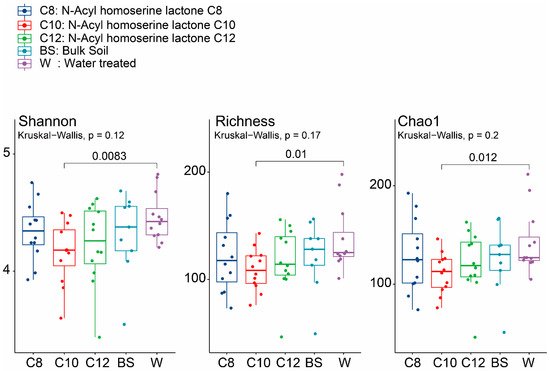
The diversity of the groups was explained through different alpha diversity indices, such as Shannon, Chao1, and richness. All three alpha diversity indices showed a similar trend in the AHL-treated soils, exhibiting a lower diversity than BS and mono-cropped W samples. Although no statistically significant differences were found among the different treatments (C8, C10, and C12), it is worth noting that the C10 sample, which gave the lowest diversity in the treated soils, was significantly different from P (
p < 0.05) (
Figure 3). We also checked the alpha diversity at other time points (2, 4, and 8 weeks). After two weeks of growth for all AHL-treated samples, we observed that the diversity was lower, while the opposite was seen in the W samples (
Supplementary Figure S1). Similar trends were observed for both C10 and C12 samples, which increased in diversity after 4 and 8 weeks of growth.
Figure 3. Total alpha diversity of soil microbial communities of the continuously mono-cropped treated with different moieties of acyl-homoserine lactones using Shannon, Richness, and Chao1 indices. The dark blue color shows the total alpha diversity for the C8 samples, while the red, green, light blue, and purple signify the C10, C12, BS, and W samples, respectively. The significance values were generated according to one-way ANOVA with Duncan’s multiple range test values (p < 0.05).
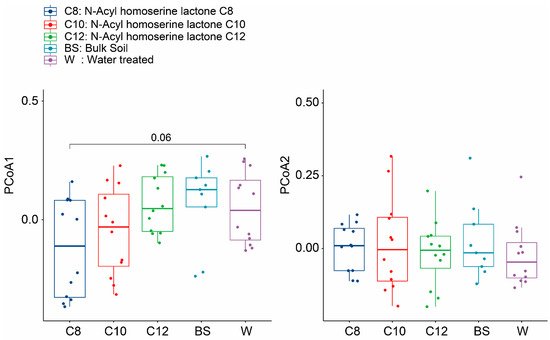
The total variation in the diversity of the treatment groups is shown by the PCoA using Bray–Curtis dissimilarity and NMDS (stress = 0.19) (
Supplementary Figure S1). There was an inconsistent pattern observed during the initial time points. However, we observed a shift in the soil microbiome between BS-, W-, and AHL-treated groups at different time points, especially after two weeks (
Figure 4). The AHL-treated groups were scattered during different time points but were seemingly clustered with W after 4 and 8 weeks of growth. Analysis using Adonis showed that the treatments were scattered and significantly different after two weeks of growth (
p < 0.05), while we found no significant difference after 4 and 8 weeks (
Table 2). Although the scattering observed was significant only after two weeks, this result still supports our theory that the addition of AHL changed the microbiome of ginseng grown in a continuously cropped manner.
Figure 4. Boxplot of the Bray–Curtis dissimilarity for different samples across different sampling time points. The first plot shows the difference along the PCoA1 plane, while the second plot shows the difference along the PCoA2 plane. The dark blue color shows the total alpha diversity for the C8 samples, while the red, green, light blue, and purple colors signify the C10, C12, BS, and W samples, respectively. The significance values were generated according to one-way ANOVA with Duncan’s multiple range test values (p < 0.05).
Table 2. PERMANOVA analysis using Adonis during the overall and different sampling points using Bray–Curtis dissimilarity distance values between N-acyl homoserine lactone treatments (C8, C10, C12) and the continuously mono-cropped ginseng soil (W).


