Your browser does not fully support modern features. Please upgrade for a smoother experience.
Please note this is an old version of this entry, which may differ significantly from the current revision.
Subjects:
Agricultural Economics & Policy
Protected areas are geographical space, recognised, dedicated and managed, through legal or other effective means, to achieve the long-term conservation of nature with associated ecosystem services and cultural values.
- ecosystem services
- environmental valuation
- biodiversity conservation
- Gargano National Park
1. Introduction
Protected areas play an important role in the conservation and/or protection of the biodiversity of particular territories and ecosystems that provide resources for living organisms, including human beings.
The International Union for Conservation of Nature and Natural Resources [1] defines a protected area as ‘a geographical space, recognised, dedicated and managed, through legal or other effective means, to achieve the long-term conservation of nature with associated ecosystem services and cultural values’.
2. ES, Biodiversity and Their Relationship
The world’s protected areas, which currently cover more than 15% of the Earth’s surface in the form of national parks and nature reserves, provide the largest single source of safe ES along with their most recognized roles in the conservation and recreation of biodiversity [21,22].
Before examining the definitions of ecosystem services and biodiversity, we firstly introduce the concept of ecosystem. According to The Economics of Ecosystems and Biodiversity [23], an ecosystem is ‘a dynamic complex of plant, animal and micro-organism communities and their non-living environment interacting as a functional unit’. These systems provide a set of benefits or services to human beings that are named ecosystem services (ES). The TEEB defines them as ‘the benefits that people obtain from ecosystems. Examples include food, freshwater, timber, climate regulation, protection from natural hazards, erosion control, pharmaceutical ingredients and recreation’. Meanwhile, the Millennial Ecosystems Assessment (MA) [24] defines ES as the multiple benefits provided, directly and indirectly, by the ecosystems to the human being.
After the pioneering work of Costanza et al. [4], which listed ES and introduced ES valuation at global level, different ES classifications have followed. The three main international classification systems are: the Millennium Ecosystem Assessment (MA, 2005) [24], the Economics of Ecosystems and Biodiversity (TEEB, 2010) [23] and the Common International Classification of Ecosystem Services (CICES) [25]. Although these works differ in terms of classification’s characteristics, they are based on previous studies. The MA was the first global study on ES. It provided an innovative scientific valuation about the ecosystems’ condition and the provided ES.
The MA considers ES under four groups:
- -
-
Provisioning services: which represent the contribution of the ecosystem to goods extracted or collected from the ecosystem (e.g., genetic resources, food, fresh water, etc.);
- -
-
Regulating services: which represent ES ability to regulate biological processes, influencing climatic and hydrological cycles and maintaining the environmental conditions benefited by the society and individuals (e.g., air quality regulation, erosion regulation, climate regulation, etc.);
- -
-
Cultural services: which include non-tangible services. They refer to the experiences that human beings could benefit from ecosystems (e.g., cultural, spiritual, recreation, etc.).
- -
-
Supporting services: which are the services necessary for the production of other ES (nutrient cycling and primary production).
The CICES is the most recent among the three international classifications described above. It supports the work of the European Environment Agency (EEA) on environmental accounting.
The TEEB represents a milestone in the ecosystem assessment studies. It highlights the economic benefits provided by biodiversity and underlines the social cost of biodiversity loss in the presence of ecosystem degradation.
The official biodiversity concept was conceived during the Rio Conference, in 1992 [26]. Prior to 1992, the international literature considered biodiversity in terms of species and plant community richness to reflect the relative abundance, and ecological or evolutionary relationships between species or community of species [27,28,29,30]. An inclusive definition of biodiversity was needed because, during the Convention on Biological Diversity (CBD) [31], the biodiversity concept was defined as ‘the variability among living organisms from all sources, including, inter alia, terrestrial, marine and other aquatic ecosystems and the ecological complexes of which they are part; this includes diversity within species, between species and of ecosystems’.
The existence of a link between biodiversity and ES was recognised by the Millenium Ecosystem Assessment in 2005 [24]. According to the MA, “biodiversity loss and the resulting deterioration of ecosystem services contribute—directly or indirectly—to worsening health, higher food insecurity, increasing vulnerability, lower material wealth, worsening social relations, and less freedom of choice and action”.
Nonetheless, it is not an easy task to demonstrate the direct relationship between biodiversity and ES. The ability of ES to provide benefits is not only affected by biological diversity per se, and vice versa; but it is mostly influenced by the functional diversity. The functional diversity is referred to as the diverse capacity to influence the ecosystem stability, productivity, nutrient balance and other ecosystem functioning aspects [32]. In the last 20 years, the international debate evolved and provided the existence of a positive relationship between biodiversity and ES. [11,33,34,35,36,37].
In their pioneering study, Naeem et al. [33] underline that ecosystems are complex systems which are based on diversity. The lack of biodiversity negatively influences the quality of the services offered by these systems, such as plant productivity, soil fertility and water quality. In addition, the work by Isbell et al. [36] offers interesting empirical evidence about the existence of linkages between biodiversity and ES. In particular, it shows that different plant species support the ecosystem functioning under different environmental scenarios. More recently, Harrison et al. [37] investigate, with the use of a systematic literature review, the existence of a positive relationship between biodiversity and ES.
To address the importance of ES, biodiversity and the link between them, Costanza et al. [38] estimate their economic value at global level. This is in the figure of USD 125–140 trillion and appears far greater (1.5 times) than that of the gross domestic product (GDP) in the same year. This means that biodiversity worldwide is significantly much more important than the production of goods and services.
3. ES Mapping Techniques
The establishment of protected areas represents one of the main pillars for the protection of biodiversity and ES [24]. Nevertheless, examples of management strategies and decision support in land use planning for ES are scarce in comparison to those tackling biodiversity or landscape conservation [39,40]. Despite the increase in the number of studies proposing indicators and methods for quantifying and assessing ES on different scales [41], few methods and tools allowing a systematic qualitative and quantitative evaluation of ES for protected areas are generally implemented [42]. Below, a brief description of these techniques is presented.
- (1)
-
WebGIS. With a WebGIS, traditional DesktopGIS applications can be implemented on a web server (also called map server) allowing the interaction between the cartography and the associated data. The data processing offered by web interfaces are nowadays still limited compared to DesktopGIS software, but it is still possible to carry out targeted queries and analyses. The strength of WebGIS is the availability of information regardless of the platform, installation and location. In addition, WebGIS can be consulted through Client-type applications, which can be generic (web browser) or specific (GIS software). Several types of WebGIS applications are available according to the degree of complexity [43], provided by the following services: viewing, associated info (attributes), processing queries/tools, data and mapping download and upload and instructions. The following WebGIS sites are used for biodiversity and ESs mapping: SoilConsWeb (Multifunctional Soil Conservation and Land Management through the Development of a Web-Based Spatial Decision Supporting System) [44], Rewetland (widespread introduction of constructed wetlands for a wastewater treatment of Agro Pontino ) [45], FaceCoast (FACE i.e. the challenge of climate change in the med COASTal zones) [46], HABEaS (Hotspot Areas for Biodiversity and Ecosystem Services) [47] and Lakes ES (Lakes Ecosystem Service) [48].
There are also several tools and software such as ARIES (ARtificial Intellegence for Ecosystem Services) [49], InVEST (INtegrated Valuation of Enviromental Services and Tradeoffs) [50] and SolVES (Social Values for Ecosystem Services) [51].
In particular, the InVEST software defines the quality of habitats and combines information on land cover and threats for biodiversity to provide habitat quality maps. Changes in the quality and quantity of habitats can be considered only partially representative of the genetic biodiversity content and the number of species. The impact of each threat on habitats is mediated according to two factors: degree and distance. The model approach only partially allows users to quantify the ecosystem service of biodiversity, as it lacks the detailed field data on populations and species. Another weakness is the relationship between threats and biodiversity, which is generally considered a linear relationship rather than a non-linear dynamic.
- (2)
-
The assessment of supply and demand of ES in protected areas, applied to potable water and protection from hydrological instability and aesthetic value [42]; crops for farmers, natural fodder for breeders, wood and fibres for processing and fuel use; and mushroom and truffle harvesting [52]. This method allows users to take into account the peculiarity of the territorial context under study.
- (3)
-
GIS techniques. It provides attractive valuations through photointerpretation in terms of used surface through digital imaging and vegetation/habitat coverage change. On the other hand, the qualitative aspect is generally retrieved by means of phytosociological surveys (e.g., tree coverage, shrub and herbaceous layer, number of species surveyed and their relative coverage) and forestry data (e.g., presence of dead wood, pathogens) which provide further information on biodiversity, the conservation of the tree components and the sources of disturbance such as overgrazing, tourism, etc. The above queries and surveys should be repeated over time as suggested by the habitat monitoring manual for each habitat. Subsequently, for each recorded data (from forestry, vegetation, fauna and soil surveys) a value (to be defined) is generally attached. This value can be referred to, for example, the plant biodiversity index (ipb) (for phytosociological data), forest biodiversity index (ifod) (for forest data), fauna biodiversity index (ifab) and soil biodiversity index (isb) (on sampling and subsequent laboratory analysis). Other indicators may also apply such as an index of climatic biodiversity (icb) (temperature, precipitation, wind) and an index of insect biodiversity (iib) (detection of insects and small organisms at litter level). Finally, a specific algorithm is specified to provide a full value of biodiversity, useful for evaluating ES. The above multidisciplinary approach generally involves nine professional figures (a botanist, forest expert, fauna expert, soil scientist, climatologist, entomologist, economist, mathematician and GIS expert) leading to reliable data used as an estimated value for ES.
4. Total Economic Value and the Valuation Methods
4.1. Total Economic Value (TEV)
Although the international scientific debate and policy guidelines recognise the relevance of ecosystems for the human and natural well-being, practical applications are still limited or, in some cases, lacking. This causes the exclusion of ecosystems health from the political debate and a consequent degradation of the natural environment, thus worsening the services provided to the society. The assessment of an economic value to ES may be a viable solution to stimulate the public debate and provide useful insights for the policy maker.
The Total Economic Value (TEV) is the result of the continuing scientific debate to integrate, into the decision process, the monetary assessment of the ecological benefits or costs, due to the application of a policy or implementation of a project.
One of the pioneering works to assess ecological benefits and costs is the use of the Total Economic Value (TEV) [53,54]. In addition, a key aspect of the natural capital or ES assessment is its marginal value. This is the estimate of a change in human welfare due to a change occurred in the supply or flow of ES [4].
The TEV is the net sum of the aggregate willingness to pay (WTP) and willingness to accept (WTA), as a result of any policy or project that causes a change in human wellbeing [55].
According to the anthropocentric view [56,57], the TEV is the result of two value components, as showed in Figure 1.
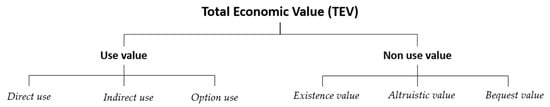
Figure 1. Total Economic Value (TEV) components.
The use value is the WTP associated with the use of the good. It could be direct use, which is the WTP for the direct use of the natural resource such as, for example, the visit to a forest or a park; indirect use, which is the WTP for the indirect use of the natural resource such as, for example, the benefit of clean air due to the proximity to a park; and option use, which is the WTP for the conservation of a natural resource to use it (optionally) in the future. The non-use value is the WTP to preserve an environmental good. It could be existence (non-use) value, which is the WTP to know that a natural resource continues to exist (e.g., WTP to preserve the Amazon Forest or the polar bears); altruistic (non-use) value, which is the WTP for someone of the present generation to benefit of the environmental good (e.g., the Amazon Forest preservation guarantees the isolation of the local indigenous tribes); bequest (non-use) value, which is similar to the altruistic value although the associated WTP refers to the benefit for the future generation (e.g., the protection of the Amazon Forest guarantees clean air for future generations).
4.2. Valuation Methods
The international literature on environmental valuation recognises two main estimation techniques such as price estimation methods, also known as market price methods, and value estimation methods, or non-market valuation methods [55,58]. The core hypothesis behind both market and non-market price models is that the benefit or the cost associated to a change in the availability of a good is the result of the preference of the individual stakeholder interested in that change [59,60].
As for the market price methods, the economic valuation is derived from market prices. It is based on the exchange value of goods in the real market. Examples of these techniques are the market analysis, which is the value of the good that is selling on the market; the restoration cost, which is the cost to compensate for the absence of the environmental good; and the damage cost avoided, which is the damage cost (avoided) in the absence of a certain environmental good.
Non-market price techniques are generally state preference methods and revealed preference methods.
State preference methods or direct techniques offer a direct way of estimating the changes in the supply of (non-market) goods. Direct methods are the contingent valuation (CV) to evaluate ‘ex ante’ and ‘ex post’ changes occurring in the environmental good [61,62,63,64,65] and the choice experiment technique (CE) to estimate the value of the environmental change in a multidimensional way [66,67,68,69,70,71].
Revelated preference methods or indirect techniques offer an indirect way to assess the value of environmental goods. Indirect methods are the hedonic price method (HPM), generally used with reference to the real estate market to estimate the preference for an environmental good [72,73,74,75,76], the travel cost method (TCM) is mostly used to estimate the value of recreational resources [77,78,79,80] and the defensive expenditure method refers to the social expenses to avoid an environmental damage [81,82,83].
Market price methods generally estimate use values, while non-use values are estimated with stated preference techniques [55].
This entry is adapted from the peer-reviewed paper 10.3390/su132111726
This entry is offline, you can click here to edit this entry!