Your browser does not fully support modern features. Please upgrade for a smoother experience.
Please note this is an old version of this entry, which may differ significantly from the current revision.
Subjects:
Remote Sensing
|
Agriculture, Dairy & Animal Science
Weeds are significant contributors to the decline in crop yield and quality. Weeds compete with crops in terms of nutrients, water, and sunlight.
- precision agriculture
- unmanned aerial vehicle
- weed
1. Introduction
Weeds are significant contributors to the decline in crop yield and quality [1]. Weeds compete with crops in terms of nutrients, water, and sunlight. Weed losses are expected to reach 11 billion USD per year in India, ranging from 13.8% in transplanted rice to 76% in soybean; in which, weeds contribute the highest potential loss, accounting for 34% of all biotic stressors, followed by insects of 18% and diseases of 16% [2]. The high morphological, physiological, and anatomical plasticity of wild species such as weeds makes them more resistant to environmental stressors than crop species [3].
The interaction of weeds with other biological components is; it can damage nearby crops [4]. Due to this reason, weed containing herbicide residuals can cause the accumulation of off-flavour products [5], or in some cases, making them harmful to humans and animal health when they enter the food chain [6]. If consumed, the detrimental health ingredients could cause hepatic failure in humans and farm animals [7]. Herbicides move away in various ways, from the target plants, triggering pollution in the environment. The sorption process binds herbicides to soil particles, resulting in severe soil pollution [8]. Then, herbicides seeping to deeper layers of the soil surface or carried directly to field drains could enhance losses of herbicides in target crops and contaminate the surface and groundwater. This potentially leads to soil and water pollution, putting the above and belowground wildlife biodiversity at risk, including flora, fauna, and microorganism [9]. On the other hand, herbicides applied in farming activities spray drift in the air, and the volatilised, dispersed, and transported of its residues over a long distance facilitates the process of environmental recycling between the atmospheric and terrestrial environments. However, this process creates air pollution in the local environment and adversely impacts the global environment [10]. Thus, alternative weed mitigation strategies must be designed and promoted to mitigate and eliminate the ecological, environmental, and potential social problems with the intensive use of herbicides.
Spraying herbicides is the most common approach to weeding worldwide [11]. Weeding is typically conducted by uniformly spraying herbicides over the field, irrespective of weed density, which results in over-spraying in weed-free areas. This approach of weeding generates herbicide waste and pollutes the agricultural ecological environment. The site-specific weed management (SSWM) approach was suggested to tackle these problems [12]. SSWM is a strategy that consists of varying management of weed within a crop field to suit the variation in density, location, and composition of the weed population [13]. Weed populations are often dispersed irregularly inside crop fields. Therefore, the basis of this control strategy is to provide a guideline of weed spatial information to apply the herbicides with a minimum consumption by adapting it according to actual needs and utilised other techniques, including any use of plant derivatives that comprises of allelopathy effect, i.e., natural herbicides to minimize agrochemical pollution [14], thereby helping to lessen soil, water, and air pollution. By realising these benefits, detailed and resource-efficient approach of herbicide spraying with SSWM in smart farming decreased herbicide consumption by 40% to 60% [15], thus providing better environmental protection, sustainable agricultural production, and increasing economic profits.
The first step in implementing a SSWM strategy is weed detection and mapping (Figure 1). This task includes creating a weed map by integrating the sensor, processing procedures, and the actuation system. On-the-ground or remote sensing technologies can be used to capture weed images or non-imaging data. Previous research has shown that ground-based approaches (also known as proximal sensing) can capture high-resolution images, allowing for the early detection of substantially lower weed densities, and the discrimination of primary plant species [16,17]. Alternatively, traditional remote sensing platforms such as piloted airborne and satellite may investigate wider areas but have lower image spatial resolution [18].
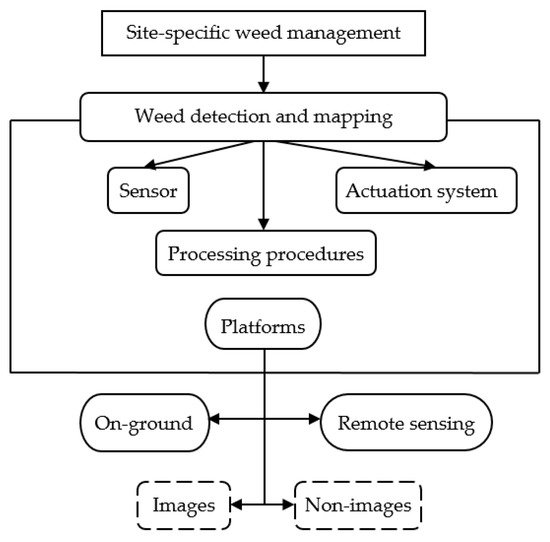
Figure 1. The first step in implementing a site-specific waste management strategy.
The emerging priority of remote sensing in the precise management of weed is to facilitate extracting information relevant for data-driven decisions [19]. A remote sensing technique must meet three requirements: (i) supply cost-effective data, (ii) ability of capturing and providing information promptly, and (iii) have user-defined spectral characteristics to enable crop indication adjustment. Satellites, manned planes, and ground-based platform can be used with remote sensing sensors. Satellite image analysis offers some solutions that could cover the entire fields and solving problems of the applications of herbicides by sampling, but it has a lower resolution and depends on high weed infestation in the absence of clouds to obtain good results [20]. Furthermore, different types of satellites offer some advantages and disadvantages of its features (Table 1). Contrarily, manned aircraft can cover broad areas but are prohibitively expensive. Handheld sensors are very accurate; yet, when compared to aerial remote sensing, their coverage area is incredibly limited [21].
Table 1. Advantages and disadvantages of different satellite features.
| Types of Satellites |
Advantages | Disadvantages | References |
|---|---|---|---|
| WorldView-3 | - High spatial and spectral resolution (panchromatic of 31 cm, multispectral of 1.24 m, short wave infrared of 3.7 m, and 30 m CAVIS) - Broad spectral range i.e., has 29 spectral bands - Precision geolocation without ground control points - Huge collection capacity i.e., more than 25 million km2 per year - High classification accuracy in terms of visual interpretation and supervised classification |
- High resolution of sensor limited to visible and NIR wavelengths | Warner et al. [22] |
| Sentinel-2 | - Make available data with a minimum spatial resolution of 10 m - Broad acquisition coverage - 13 bands based on visible to Short Wave Infrared (SWIR) - Short time revisits cycle i.e., less than five days globally |
- Need to depend on other satellite data before the commencement of Sentinel-2. - Rate of uncertainties in data fusion and downscaling methods |
Orlikova et al. [23] and Varghese et al. [24] |
| Land Satellite (Landsat) Operational Land Imager (OLI) |
- High spatial variability even though the time elapsed is one month - Has a push broom configuration generating 16-bit images with at least an eight fold increase in signal-to-noise ratio than previous Landsat missions - Data saturation in sites with high biomass and penetrable canopies in low cover areas generate large uncertainties |
- Higher spatial resolution sensor is limited by the temporal resolution when compared to medium-resolution data. | Abascal Zorrilla et al., [25] |
Clouds, Aerosols, Vapors, Ice, and Snow: CAVIS.
UAVs have shown the remarkable potential of low altitude applications in agriculture since they are more cost-effective and easier to use [26,27]. Current UAVs have higher image spatial resolutions, whereby technological breakthroughs in miniaturisation sensors are embedded. The most recent generation of multispectral (i.e., sensors offer from 3 to 7 bands), superspectral (i.e., sensors offer from 7 to 20 bands), and hyperspectral (i.e., sensors offer more than 20 bands) provides an opportunity to create very precise weed maps [28]. Advances in two-dimensional and three-dimensional sensor and camera images, as well as more powerful and efficient computers processing data streams in near real-time, could provide the tools required for real-time SSWM [29]. Nonetheless, those spectral cameras, 3D cameras, and LiDARs are costly. Generally, they are used on broad land- and time scales. Since it is smaller and lighter than other sensors, an RGB camera is a more cost-effective sensor.
2. Current Trend of UAV Applications for Detection of Weed
Research on the application of UAV for weed detection and mapping mainly highlight four issues: (i) spectral differences of weeds detection, (ii) types of aerial images from several sensors and platforms on weed detection, (iii) effect of spatial and spectral resolutions on weed detection, and (iv) algorithms and classification techniques for weed mapping. UAVs have primarily been assessed in different crops such as maize, wheat, sugarcane, cultivar, chilli, onion, vineyard, pistachio, baby-leaf red lettuce, barley, and mixed agricultural field such as pea and strawberry (Table 6). Those are among the world’s most widely cultivated crops, and they are highly vulnerable to weed competition, particularly during the seedling stage of the growing cycle. Our systematic review found that the seedling stages of crop contribute the highest, i.e., 27.42% in weed detection. One study [53] proposed that crop images could be taken precisely in the early season, so that specifically color-dependent segmentation can be applied to segment weed patches to achieve the higher accuracy of an algorithm.
Table 6. Example of UAV imaging applications in detecting weed for different crop types.
| Crop | Research Focuses | References |
|---|---|---|
| Maize | Tested a low-cost UAV for weed mapping, evaluated open-source packages for semi-automatic weed classification, and implemented a prescription map-based sustainable management scenario. | Mattivi et al. [54] |
| Wheat | Optimized a deep residual convolutional neural network (CNN) (ResNet-18) for classifying weed and crop plants in UAV imagery. | de Camargo et al. [55] |
| Sugarcane | Developed a framework to identify the defect areas in the sugarcane farms. | Tanut and Riyamongkol [56] |
| Cultivar | Investigated the viability of integrating UAV image with satellite images to improve the classification of different pistachio cultivars and separate weeds from trees. | Malamiri et al. [26] |
| Chilli | Detected weeds in a chilli field using image processing and machine learning methods. | Islam et al. [57] |
| Onion | Investigated the late-season weed mapping by surveying dry onions with a simple off-the-shelf UAV, employing several techniques across various spatial resolutions, estimating weed coverage in the fields, and assessing the spatial pattern of weeds. | Rozenberg et al. [58] |
| Vineyard | Provide UAV and precision agriculture users with a FOSS-replicable methodology that can meet the needs of agricultural operations, as well as operational and management needs. | Belcore et al. [59] |
| Baby-leaf red lettuce beds | Provided an estimation of the exact weed quantity on baby-sized red lettuce beds using a light drone. | Pallottino et al. [60] |
| Barley | Evaluated the yield loss of spring barley due to various C. arvense infestations in big plots in farmers’ fields, and proposed a novel approach to quantifying C. arvense infestation in large plots. | Rasmussen and Nielsen [18] |
| Mixed agricultural field |
Developed a deep learning system for identifying weeds and crops in croplands, such as peas and strawberries. | Khan et al. [61] |
This review has figured out few types of UAV that being used for weed detection which includes single-rotor, multi-rotor, and fixed-wing (Figure 5). Ahmad et al. [40] used single-rotor as a spraying unit in the target and off-target zones for outer field weed control application. On the other hand, there are two studies that used the multi-rotor on the cultivated rice in China, in which Huang [38] captured imagery on few patches of Cyperus iric while Huang [52] captured the Chinensis, Cyperus iric, Digitaria sanguinalis, Scop, and Barnyard grass. In another study, Khan et al. [52] used multi-rotor to obtain imagery for two different crops which is pea and strawberry and Eleusine indica on infested weeds in Pakistan. In terms of fixed-wing, Zisi et al. [62] used this type of UAV to capture the images of S. marianum and patches of other weeds such as Solanum elaeagnifolium, Avena sterilis L., Bromus sterilis L., Cav, Cardaria draba L., Conium maculatum L., and Rumex sp. L. at the field that previously cultivated with cereals in Greece. Also, for fixed-wing that detect other weed types, Barrero and Perdomo [63] has detected Gramineae at the rice field in Columbia, whereas Tamouridou et al. [64] has identified S. marianum, and other weed types that consist the mixing of Avena sterilis, Rumexsp. L., Bromus sterilis L., Conium maculatum L., Cardaria draba L., and Solanum elaeagnifolium Cav at the field that previously cultivated with cereals in Greece.
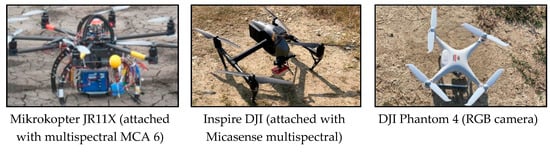
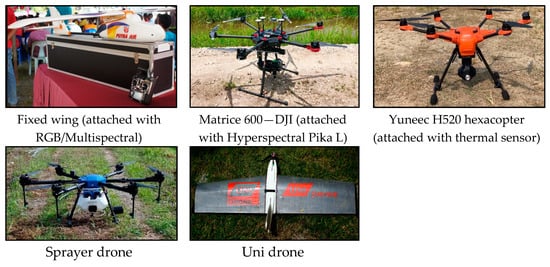
Figure 5. Example of UAV systems used in detecting weed (The pictures were captured by authors).
2.1. Spectral Differences of Weed Detection
The basic concept behind weed discrimination is to locate the spectral region or, instead, the vegetation indices that maximise the differences between weed and crop plants, based on the reflectance values acquired in aerial images [65]. At the time of image acquisition, the weed percentage was very low. Using a mosaic of images is often more difficult than using a single image because of distortions and spectral variations between the images. The ability of detecting and identifying weed species is largely influenced by environmental conditions. This is related to the weeds’ distribution pattern such as patchy patterns with high inconsistency, their textural phenotype, and spectral signature that visually similar to other vegetation types growing in the same location [66]. Spectral signature can be used in chemical content in the leaves or plants, in which each band represent the condition of the plants.
To evaluate weed identification capacity, spectral signatures were acquired from the upper surface area of the leaves, for example, from S. marianum plants and other vegetative species such as A. sterilis and Conium maculatum [67]. Accordingly, A. sterilis and S. marianum were found to have similar spectral reflectance characteristics, making weed classification difficult which mainly in the early season. However, these three species were easier to distinguish in the NIR spectrum. This indicates that the NIR zone and other properties (i.e., texture) could be used to enable class separation. Another study [68] that monitored the same species that mentioned previously also observed that S. marianum had some similarities with A. sterilis in the visible spectrum (400–700 nm) but differ in the near-infrared (700–1100 nm). This shows that the camera’s band is one of the essential feature that allows for weed discrimination in the crop field.
Because of challenges regarding indistinguishable spectral signatures between crop and weed seedlings, other characteristics such as different textures and shapes may help to differentiate the two. Also, initial parameters may have an effect on the creation of objects from pixels. Rozenberg et al. [58] applied a single set of parameters, in which the shape and size of the weed patches varied. Due to the significant spectral differences at the phenological stage at which the data was collected, the use of differential parameters was unnecessary.
Monospecific patches with higher vegetation cover has a unique spectral signature which the classifier can use it to improve its accuracy. Conversely, the spectral reflectance of a mixed community combines the spectral signatures of the plants present in a single location, hiding the target species’ signature and lowering classifier performance. In addition, the image resolution was inadequate to give description of pixels indicating pure spectral signatures of spotted knapweed, among other vegetation, and thus pixel-based methods could not be adapted without data from field-spectrometry or a spectral library to provide the spectral signatures of the crop. [69].
Danilov et al. [70] investigated how the form of the spectral signatures of reflectivity for plant items changed based on their current condition, as measured during field surveys. This is the starting of the active vegetation of weeds. The spectral signatures curves of the plants were identified, whereby the (i) distinctive characteristics of reflectivity of some cultivated or weed species is in the visible range of the spectrum between 400 and 680 nm, (i) differences in the average values of the spectral brightness between few plant species are overlapped by the sums of their standard deviations in the NIR region of 800 1100 nm, and (iii) weed is detected by a significant variation in the amplitude of spectral brightness fluctuations between cultivated and weed plants.
2.2. Types of Aerial Images on Weed Detection
Our systematic review identified four main types of cameras utilized for weed patches identification: RGB, multispectral, hyperspectral, and thermal cameras. For example, Agüera-Vega et al. [71] used the multispectral (green, near-infrared, red and red-edge) and thermal sensors to discriminate weed images from maize crops. Revanasiddappa et al. [72] stitched weed images to create a weed site map uploaded to the cloud. A study combined simultaneously remotely sensed ground data and aerial imagery to develop models that correlated ground-truth weed densities with image intensity and forecast weed densities in other fields, done by Lambert et al. [73]. The weed effect on canal hydraulic efficiency has also been assessed using ground imagery, UAV images, and high-resolution satellite data [74].
According to the secondary development, a hardware environment for real-time image processing has incorporated map visualisation, image collection, flight control, and real-time image processing on board a UAV [48]. Based on Reis et al. [44], the image generated using LiDAR data had lower canopy cover and higher cover by bare soil and grasses compared to UAV. Differences between LiDAR and UAV may be due to image classification processes, including the existence of shaded areas in UAV camera images and incorrectly categorised pixels in digital image processing that require additional exploration.
2.3. Effect of Spatial and Spectral Resolutions on Weed Detection
Weed detection necessitates high spatial resolution in remote image. It is dependent on the sensors and remote platforms used [69]. The average operational parameters of the UAV sprayer on the spray deposition pattern (2.29 L/cm2) in the target area were found to be the highest when the UAV operates at the higher speed of 2 m/s and a height of 2 m [40]. The weed distribution maps of the UAV imagery were also generated using a semantic labelling technique. An ImageNet with the residual framework was adapted in a fully convolutional version and fine-tuned before being uploaded to the dataset. The field of view of convolutional filters was then extended using atrous convolution; the performance of multi-scale processing was assessed, and a fully linked conditional random field was employed to refine the spatial features [67]. As a result, the ability to differentiate weeds was significantly influenced by the spatial resolution of the image, making the use of higher spatial resolution images more appropriate [75].
Watt et al. [76] discovered that vegetation indices obtained from multispectral UAV data and satellite data were strong predictors of weed metrics, with a spatial resolution of 1 m being optimum. To examine classification performance, the scale of the weed mapping utilizing UAV and multispectral imaging was altered by reducing image resolution, with 1 m resolution yielding the maximum classification accuracy [67]. Mesas-Carrascosa et al. [77] investigated the optimum flight settings for maintaining spatial accuracy in the bundle adjustment, which were 70% to 40% overlap and altitudes above ground level (AGL) ranging from 60 to 90 m. At various flying altitudes, the spatial resolution was relatively similar, allowing us to optimize mission planning, fly at a higher altitude, and increase the area overflow without reducing orthomosaic spatial quality.
Many weed and crop pixels had similar spectral values at higher altitudes, which might increase discrimination errors. Hence, an agreement among spectral and spatial resolution is needed to optimise the flight mission according to the size of the smaller object to discriminate (weed plants or weed patches). As Che’Ya et al. [75] reported the lower flight altitude will determine the highest spatial and spectral resolution of the imagery, they found that at 10 m flight altitude will help to detect weeds accurately at less than 1 cm spatial resolution. The imagery showed the weeds patches more clearly and accurately [78]. The weeds are mostly look alike with the plants. Thus, the high accuracy will help to detect the weeds through the spatial and spectral resolution. Spectral signature can be used to differentiate weeds and plants in the field [75,79]. Not only that, the method to detect the weeds also the main factor to get the accurate classification. Roslim et. al. [80] found that the artificial intelligent (AI) can be used to detect the weeds patches in the rice field. Thus, the used of UAV can help to gain the highest spatial and spectral resolution in the field.
With the small UAVs, such as Phantom 3 Professional (Da-Jiang Innovations, Shenzhen, China) quadrotor, it is possible to map 10 ha in 20 min at 40 m flight altitude, which corresponds to the duration of one battery [74]. The best date for a weed emergence prediction model survey was implemented using a UAV with visible range sensors, resulting in an orthophoto with a spectral resolution of 3 cm, allowing for good weed detection [81].
This entry is adapted from the peer-reviewed paper 10.3390/agriculture11101004
This entry is offline, you can click here to edit this entry!