Your browser does not fully support modern features. Please upgrade for a smoother experience.
Please note this is an old version of this entry, which may differ significantly from the current revision.
Subjects:
Pharmacology & Pharmacy
GPR21 is a constitutively active, orphan, Gq-protein-coupled receptor, with in vivo studies suggesting its involvement in the insulin resistance development.
- GPR21
- GPCRs
- hepatocytes
- insulin resistance
1. Introduction
Type 2 diabetes (T2D) mellitus is a chronic disease that is reaching epidemic proportions, and despite several therapeutic options being available, almost half of patients do not achieve their treatment goals [1]. Insulin resistance plays a crucial role in its pathogenesis and, interestingly, represents the best predictor of a future diagnosis of this pathology [2]. Generally, T2D is preceded by impaired glucose tolerance, characterised by abnormally increased postprandial blood glucose levels due to impaired insulin sensitivity. Currently, it has been estimated that 347 million people have an impaired glucose tolerance [3], which is itself associated with increased cardiovascular mortality [4]. On this basis, advancing knowledge of the molecular mechanism underlying insulin sensitivity impairment is necessary to identify novel targets for potential pharmacological strategies to counteract its establishment and progression.
G-Protein Coupled Receptors (GPCRs) are a superfamily of transmembrane receptors that perform a wide range of biological functions within the human body [5,6,7]. They represent a rich source of drug targets: approximately 30% of marketed drugs act through these receptors [8]. However, orphan receptors still comprise ~25% of the targetable GPCR space and are attracting particular interest in the drug discovery field as they may represent novel therapeutic targets for a range of conditions [9].
The Rhodopsin subfamily is the largest subset grouping of GPCRs with diverse ligands including neurotransmitters, hormones, and lipids. GPR21 is a broadly expressed, orphan, rhodopsin-like receptor that shows constitutive activity through Gαq type G proteins, in particular Gα q and Gα 15/16 [10,11]. Interestingly, this receptor has been shown to be involved in the pathogenesis of insulin resistance, thus representing a potential new target for the treatment of Type 2 diabetes [11,12].
In particular, in vivo studies on GPR21 knockout (KO) mice demonstrated that the deletion of this receptor improves glucose tolerance and systemic insulin sensitivity in animals fed with a high-fat diet [13,14]. The mechanism by which GPR21 exerts its metabolic phenotype is difficult to pinpoint, with Osborn et al. suggesting that GPR21 may be a novel control point coordinating macrophage pro-inflammatory activity in the context of obesity-induced insulin resistance, thus hypothesising an indirect role for this receptor in the induction of insulin resistance. Subsequently, we showed that GPR21 overexpression in HEK293T cells was associated with impaired insulin signalling, thus indicating a direct involvement in the establishment of insulin resistance [11]. In addition, we recently identified the acetamide GRA2, (2-(1-naphthyloxy)-N-(2-phenoxyphenyl)acetamide (Figure 1), which acts as an inverse agonist for this receptor and can counteract the influence of GPR21 on the insulin signalling pathway [11]. However, despite its intriguing potential, the effect of GPR21 in target cells for the action of insulin has not been investigated yet.
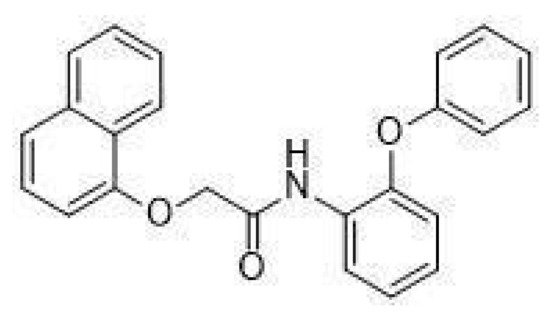
Figure 1. Structure of GRA2, (2-(1-naphthyloxy)-N-(2-phenoxyphenyl)acetamide.
2. Expression and Activity of GPR21 in HepG2 Cells
To evaluate whether HepG2 cells were suitable cellular models to study the role of GPR21 in hepatocytes, the expression of this receptor was first assessed using a Western blot analysis. As shown in Figure 2A, GPR21 was detected in HepG2 cells. As GPR21 is a constitutively active receptor [10], the effects of its inhibition were quantified. In particular, two strategies were adopted: a specific siRNA against GPR21 to decrease GPR21 expression (Figure 2B,C) and a GPR21-inverse agonist, GRA2 [11], to inhibit receptor activity. As shown in Figure 2B,C, GPR21 expression at the gene and protein levels was significantly reduced by using specific siRNA against GPR21. By contrast, cell exposure to GRA2 (3–30 µM, 24 h), did not affect GPR21 expression (Figure 2D). Moreover, GRA2 (1–30 µM, 24 h) did not affect cell viability as evaluated by the MTT assay (Figure 2E).
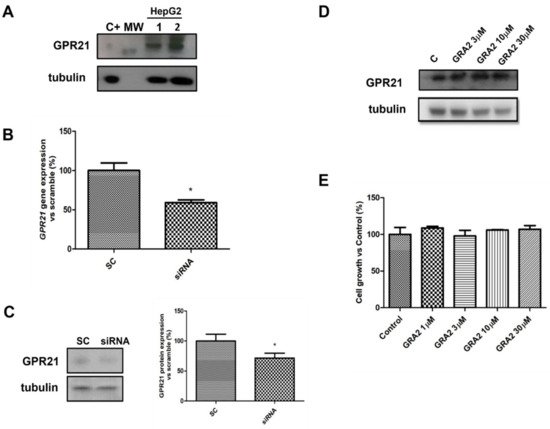
Figure 2. GPR21 receptor expression in HepG2 cells. (A). Representative Western blot analysis for the expression of GPR21 in HepG2 cells (MW: 37 kDa, C+: HT1080 whole cells lysate). Tubulin expression was assessed to confirm homogeneity of loading. (B). qPCR analysis for GPR21 mRNA in HepG2 cells transfected with non-silencing siRNA (SC) or with siRNA for GPR21 (siRNA). Data are expressed as mean ± SEM of three independent experiments run in triplicate. (C). Western blot analysis of GPR21 protein levels in HepG2 cells transfected with non-silencing siRNA (SC) or with siRNA for GPR21 (siRNA) (left panel). Equal loading was evaluated by re-probing the membrane with anti-tubulin. The relative densitometric analysis is reported in the right panel. (D). Western blot analysis of the GPR21 receptor exposed to either vehicle alone or GRA2 (3–30 µM, 24 h). Equal loading was evaluated by re-probing the membrane with anti-tubulin. (E). MTT assay on HepG2 cells exposed to either vehicle alone or increasing concentrations of GRA2 (1–30 µM) for 24 h. Cell growth was expressed as a percentage of the control cultures (100%). Data are expressed as mean ± SEM of three independent experiments run in triplicate. * p < 0.05 vs. scramble control (SC).
However, as shown in Figure 3A, the use of a specific siRNA against GPR21 significantly (p < 0.05) decreased IP1 levels, which appeared to be approximately 40% lower compared to the Scramble Control (SC)-treated samples. In addition, GRA2 decreased IP1 production levels in a concentration-dependent manner with a significant (p < 0.05) inhibition at concentrations above 10 µM (IC50 of 1.6 × 10⁻⁶ M, Figure 3B). These results suggest that GPR21 is a constitutively active receptor in HepG2 cells and that GRA2 was able to act as an inverse agonist in our experimental model. Therefore, as indicated by these results, HepG2 cells represent a suitable in vitro model to study the role of this receptor in hepatocytes.
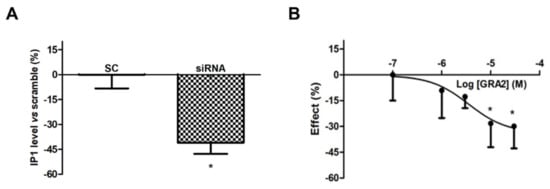
Figure 3. Effect of GPR21 gene silencing and GRA2 treatment on IP1 production. GPR21 constitutive activation was quantified by measuring the intracellular IP1 level in HepG2 cells transfected with non-silencing siRNA (SC, Scramble) or silenced with siRNA against GPR21 for 72 h (panel (A)) as well as in HepG2 cells treated with increasing concentrations of the inverse agonist (3–30 µM, for 1 h, panel (B)). Data are expressed as mean ± SEM of four independent experiments run in duplicate. Values are expressed in % vs. control or scramble. * p < 0.05 vs. control or scramble.
3. Effect of GPR21 Gene Silencing and GRA2 Treatment on Glucose Uptake and Glucose Production in HepG2 Cells
The liver plays a crucial role in glucose homeostasis, with glucose uptake by hepatocytes considered an essential element driving hepatic insulin resistance. To assess whether GPR21 contributes to the regulation of cellular glucose homeostasis, the effects of GPR21 gene silencing and of GRA2 on glucose uptake were measured. As shown in Figure 4A, GPR21 gene silencing significantly increased glucose uptake (p < 0.05) in comparison to HepG2 cells transfected with scramble control (SC) sequences. Consistently, in comparison to control cells, a concentration-dependent increase in glucose uptake was also measured in cells treated with GRA2 (Figure 4B). Additionally, we evaluated whether GPR21 affects glucose production in HepG2 cells. The inhibition of GPR21 by gene silencing (Figure 4C) or by GRA2 treatment (Figure 4D) did not affect cellular glucose production, suggesting that GPR21 could impair glucose homeostasis primarily through its effect on glucose uptake.
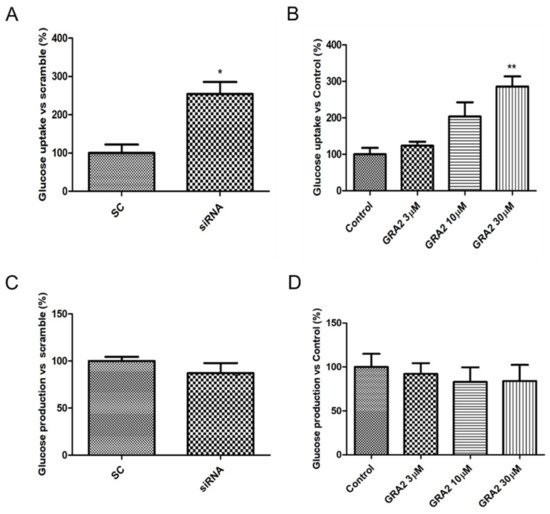
Figure 4. Effect of GPR21 gene silencing and GRA2 treatment on hepatic glucose homeostasis. Glucose uptake was assessed using a 2-NBDG fluorescent probe; HepG2 cells were transfected for 72 h with non-silencing siRNA (scramble, SC) or with specific siRNA against GPR21 (siRNA, panel (A)) or exposed to increasing concentrations of inverse agonist GRA (3–30 µM, 24 h, panel (B)). Data are expressed as mean ± SEM (n = 4) in % vs. control or scramble. * p < 0.05 vs. scramble control (SC); ** p < 0.01 vs. control. (C,D). Glucose production was evaluated on HepG2 cells transfected with non-silencing siRNA (SC) or with GPR21 siRNA (C) or exposed to increasing concentrations of inverse agonist GRA2 (3–30 µM, 24 h, panel (D)). Values are expressed in % vs. control or scramble. Data are expressed as mean ± SEM (n = 3) in % vs. control or scramble.
4. Effect of GPR21 Gene Silencing and GRA2 Treatment on GLUT-2 Expression
Since our results indicated an increased glucose uptake after the inhibition of GPR21, we investigated whether GPR21 can affect the membrane expression of the prominent glucose transporter mainly present in the liver, GLUT-2 [16]. We evaluated GLUT-2 expression in HepG2 cells by performing flow cytometry analysis (Figure 5). Our data showed that the selected silencing of GPR21 by specific siRNA (Figure 5A) as well as the inhibition of GPR21 activity by GRA2 treatment (30 µM, Figure 5B) resulted in the increased translocation of GLUT-2 to the HepG2 cell membrane, thus explaining and justifying the increase in glucose uptake.

Figure 5. GPR21 inhibition improves GLUT-2 translocation to the plasma membrane. Flow cytometry analysis of GLUT-2 expression at the cell membrane of HepG2 cells transfected with non-silencing siRNA (SC) or with specific Scheme 21. (siRNA, (A)) or exposed to GRA2 (30 µM, 24 h, panel (B)). Data are expressed as the mean of fluorescence FL-1 ± SEM; n = 4. * p < 0.05 vs. control; *** p < 0.001 vs. scramble control (SC).
5. Effect of GPR21 Inhibition on Insulin Signalling in HepG2 Cells
As AKT- GSK-3β signalling is a crucial regulator of GLUT-2 expression [17,18], which is affected by GPR21 inhibition, we evaluated the phosphorylation status of these target proteins. In particular, we evaluated the ratio of Ser473Akt/tot Akt and Ser9GSK-3β/tot GSK-3β. As shown in Figure 6, in HepG2 cells, gene silencing or the pharmacological inhibition of GPR21 induced an improvement of the insulin signalling pathway. In particular, our results demonstrated that the selected silencing of GPR21 receptors (by siRNA) resulted in a significant increase in the phosphorylation of Ser473Akt, which is essential for the full activation of this enzyme. Consistently, this effect was associated with a significant increase in the phosphorylation of Ser9 GSK-3β compared to SC (Figure 6A,C). GSK-3β is a constitutively active enzyme that could be inhibited by the phosphorylation of Ser9. Thus, an increase in the ratio of Ser9 GSK-3β/tot GSK-3β indicates an inhibition of its activity that results in an increased expression of GLUT-2. As shown in panel B, the same results were achieved in cells treated with GRA2. The effect was dose-dependent and became significant at the higher dose (p < 0.05, Figure 6B,D).
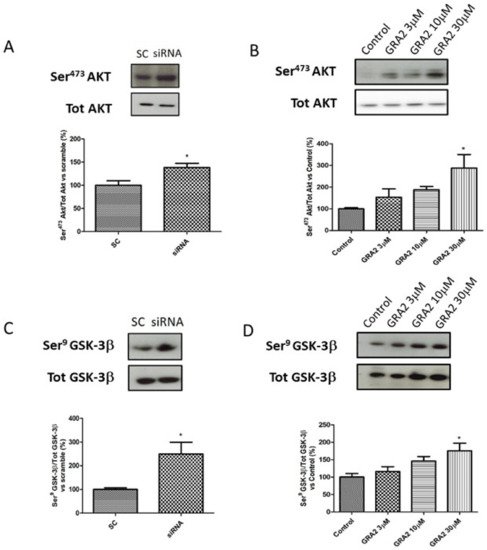
Figure 6. Effect of GPR21 inhibition on insulin signalling in HepG2 cells. Western blot analysis of phosphorylation levels of Ser473Akt and Ser9GSK-3β in HepG2 cells transfected for 72 h with non-silencing siRNA (scramble control, SC) or with specific siRNA against GPR21 (siRNA, panel (A,C)) as well as in HepG2 cells exposed to increasing concentrations of inverse agonist GRA2 (3–30 µM, 24 h, panel (B,D)). Equal loading was evaluated by a re-probing membrane with total Akt or GSK-3β. Densitometric analysis of the bands is expressed as relative optical density (O.D.) and was normalised using the related control band. Data are expressed as mean ± SEM; n = 4. * p < 0.05 vs. scramble control (SC) or control.
This entry is adapted from the peer-reviewed paper 10.3390/ijms221910784
This entry is offline, you can click here to edit this entry!