Your browser does not fully support modern features. Please upgrade for a smoother experience.
Please note this is an old version of this entry, which may differ significantly from the current revision.
Subjects:
Health Care Sciences & Services
This study aims to develop and validate a diagnostic clinical prediction algorithm for assisting physicians in distinguishing an early stage of Blount’s disease from the physiologic bowlegs to provide an early treatment that could prevent the progressive, irreversible deformity.
- genu varum
- infantile Blount’s disease
- physiologic bowlegs
- prediction
- diagnosis
1. Introduction
Pediatric genu varum deformity, also known as bowlegs, is one of the most frequent causes of parental concerns in children aged one to three years old [1]. Although the vast majority of cases are physiological conditions, which will spontaneously resolve with growth, pathological causes of genu varum deformity, such as Blount’s disease, should be distinguished [1,2]. In contrast to the physiologic bowlegs, Blount’s disease is a progressive condition causing an irreversible severe varus deformity of the knee if the treatment initiation is delayed [3]. Even though the diagnosis can be easily established upon radiographic changes of the medial proximal tibial physis described by Langenskiöld [3], an absence of substantial radiographic abnormalities in the early stage of the disease may cause problems in making an accurate early diagnosis. This is especially true for primary care physicians, who are often the first to encounter the patients and thus play a crucial role in the early identification of Blount’s disease [4,5].
To address this diagnostic challenge, several radiographic parameters have been proposed for differentiating Blount’s disease and physiologic bowlegs, such as the classic metaphyseal-diaphyseal angle (MDA) [6], the rate of MDA change [4], and the medial metaphyseal beak angle (MMB) [7]. Nevertheless, these radiographic parameters vary among different patient characteristics (e.g., age group and other risk factors), and therefore the accuracy of these diagnostic parameters has been questioned by several studies [4,8,9].
One strategy to improve the accuracy in making an early diagnosis is by creating a clinical prediction rule (CPR), a formal combination of several predictive factors using statistical modeling, which will predict the probability or likelihood of developing radiographic abnormalities in medial proximal tibial physis, specifically for each patient [10]. In clinical practice, the diagnostic prediction provided by the CPR might be beneficial in several circumstances. For example, the prediction could be used by primary care physicians or pediatricians to provide a prompt referral to pediatric orthopaedists in patients with high risk for Blount’s disease. In addition, an early treatment initiation could be justified by pediatric orthopaedists according to the patient’s individual risk. Accordingly, the aim of this study was to develop and validate a diagnostic clinical prediction model for distinguishing an early stage of Blount’s disease from the physiologic bowlegs, which could improve the diagnostic accuracy in an early stage of the disease.
2. Results
A total of 158 lower extremities from 79 children were included in the study. Of those, 28 (35.4%) had bilateral Blount’s disease, 28 (35.4%) had unilateral involvement (9 (11.4%) right side, and 19 (24.1%) left side), and 23 (29.1%) had bilateral physiologic bowlegs (Table 1). Demographic and clinical information on lower extremities categorized by the study endpoint (Blount’s disease (n = 84) and physiologic bowlegs (n = 74)) were summarized and compared. Patients diagnosed with Blount’s disease were significantly older (27 ± 5.2 vs. 24.9 ± 6.9 months, p = 0.030), and had greater FTA (13.5 ± 6.2° vs. 9.2 ± 7.3°, p < 0.001), greater MDA (14.5 ± 4.0° vs. 10.0 ± 4.4°, p < 0.001), and higher MMB (127.4 ± 6.1° vs. 118.3 ± 6.2, p < 0.001) (Table 2). The distribution of variables after categorization with a pre-specified cut-off point is presented. Of all observations, only patient BMI information was missing for 62 (39.2%) patients. Therefore, multiple imputation analysis was performed using all other predictors (age, gender, FTA, MDA, and MMB) as independent predictors by the PMM method. The interobserver reliability of radiographic parameter measurement showed a substantial agreement with an ICC greater than 0.9 for all radiographic measurements.
Table 1. Demographic and Clinical Characteristics of the 79 Included Patients.
| Patient Demographic | Mean | ±SD |
|---|---|---|
| Age (month) | 26.0 | 6.1 |
| Gender (n, %) | ||
| Male | 48 | 60.8 |
| Female | 31 | 39.2 |
| BMI 1 (kg/m2) | 24.9 | 4.5 |
| Laterality (n, %) | ||
| Blount’s disease of right leg | 9 | 11.4 |
| Blount’s disease of left leg | 19 | 24.1 |
| Bilateral Blount’s disease | 28 | 35.4 |
| Bilateral physiologic bowlegs | 23 | 29.1 |
| FTA 2 (°) | 11.6 | 5.7 |
| MDA 3 (°) | 12.4 | 3.6 |
| MMB 4 (°) | 122.9 | 6.1 |
Table 2. Demographic and clinical characteristics of the 158 lower extremities from 79 patients compared between those with Blount’s disease and those with physiologic bowlegs.
| Characteristics (n = 158 Sides) | Missing Data | Blount Disease (n = 84 Sides) | Physiologic Bow-Leg (n = 74 Sides) | p-Value | |||
|---|---|---|---|---|---|---|---|
| n | (%) | Mean | ±SD | Mean | ±SD | ||
| Clinical characteristics | |||||||
| Age (months) | 0 | 0 | 27.0 | 5.2 | 24.9 | 6.9 | 0.030 |
| Age ≥ 24 months (n, %) | 57 | 67.9 | 37 | 50.0 | 0.024 | ||
| Gender (n, %) | |||||||
| Male | 0 | 0 | 48 | 57.1 | 48 | 64.9 | |
| Female | 0 | 0 | 36 | 42.9 | 26 | 35.1 | 0.333 |
| BMI 1 | 62 | 39.24 | 24.9 | 4.3 | 25.0 | 4.9 | 0.900 |
| BMI ≥ 23 kg/m2 (n. %) | 39 | 63.93 | 21 | 60.0 | 0.827 | ||
| Laterality (n, %) | |||||||
| Right | 0 | 0 | 37 | 44.1 | 42 | 56.8 | |
| Left | 0 | 0 | 47 | 55.9 | 32 | 43.2 | 0.151 |
| Radiographic Characteristics | |||||||
| FTA 2 (°) | 0 | 0 | 13.5 | 6.2 | 9.2 | 7.3 | <0.001 |
| FTA ≥ 5° (n, %) | 75 | 89.3 | 49 | 66.2 | <0.001 | ||
| MDA 3 (°) | 0 | 0 | 14.5 | 4.0 | 10.0 | 4.4 | <0.001 |
| MDA < 11° (n, %) | 13 | 15.5 | 43 | 15.5 | |||
| MDA 11–16° (n, %) | 40 | 47.6 | 27 | 36.5 | |||
| MDA > 16° (n, %) | 31 | 36.9 | 4 | 5.4 | <0.001 | ||
| MMB 4 (°) | 0 | 0 | 127.4 | 6.1 | 118.3 | 6.2 | <0.001 |
| MMB ≥ 122° (n, %) | 64 | 76.2 | 18 | 24.3 | <0.001 | ||
Univariable logistic regression analysis revealed age, FTA, MDA, and MMB to be statistically significant predictors of Blount’s disease (Table 3). Nevertheless, all candidate predictors were included in the full model multivariable logistic regression analysis using the multiple imputed datasets. Of the six predictors, three were identified as independent predictors including age ≥ 24 months (mOR 2.75, 95% CI 1.09 to 6.95, p = 0.03), MDA > 16° (mOR 11.65, 95% CI 2.44 to 55.63, p = 0.002), and MMB ≥ 122° (mOR 4.47, 95% CI 1.59 to 11.52, p = 0.005). However, previous studies identified BMI as a strong predictor for Blount’s disease. Therefore, after discussion with all investigators, we decided to include patient BMI along with other independent predictors in the final predictive model. The discriminative ability of the final model was found to be excellent, with an AuROC of 0.85 (95% CI 0.79 to 0.91) (Figure 1). The regression coefficient for each predictor from the final model was then transformed into a weighted score (Table 4). The scoring scheme with a total score from 0 to 8 was then classified into three risk groups for clinical implementation. The groups were defined as low-risk, moderate-risk, and high-risk based on a total score > 2.5, within 2.5 to 5.5, or >5.5, respectively (Table 5). The mean total score was significantly different between the Blount’s disease group and the physiologic bowlegs group (5.2 ± 0.2 vs. 2.5 ± 0.2, p < 0.001). Model calibration is presented via calibration plots, as recommended by the TRIPOD statement in Figure 2 [12]. Internal validation using the bootstrap resampling method revealed an optimism of 0.018 (range 0.018 to 0.028).
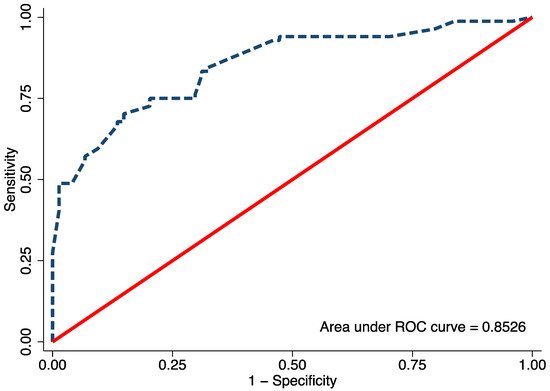
Figure 1. The area under the receiver operating characteristic (ROC) of the final proposed diagnostic model, including age, body mass index, metaphyseal-diaphyseal angle, and medial metaphyseal beak angle.
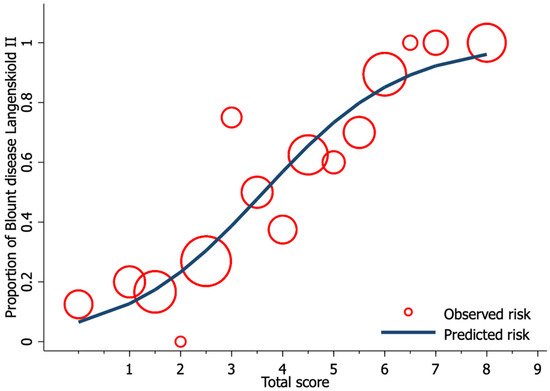
Figure 2. Calibration plot of the observed risk (red circle) and predicted risk (navy line) of Blount’s disease relative to total score from the proposed diagnostic model.
Table 3. Univariable and full model multivariable logistic regression analysis for an independent diagnostic predictor of Blount’s disease (imputed dataset n = 158).
| Characteristics | Univariable Analysis | Multivariable Analysis | ||||||
|---|---|---|---|---|---|---|---|---|
| (n = 158 sides) | uOR | 95% CI | p-value | mOR | 95% CI | p-value | ||
| Age ≥ 24 months | 2.11 | 1.11 | 4.03 | 0.023 | 2.75 | 1.09 | 6.95 | 0.033 |
| Male | 0.72 | 0.38 | 1.37 | 0.322 | 0.70 | 0.27 | 1.79 | 0.459 |
| BMI 1 ≥ 23 kg/m2 | 1.71 | 0.73 | 3.99 | 0.213 | 2.36 | 0.70 | 8.05 | 0.165 |
| Right side | 0.60 | 0.32 | 1.13 | 0.112 | 0.77 | 0.33 | 1.77 | 0.533 |
| FTA 2 ≥ 5° | 4.25 | 1.83 | 9.87 | <0.001 | 1.37 | 0.45 | 4.19 | 0.580 |
| MDA 3 | ||||||||
| MDA < 11° | Ref. | |||||||
| MDA 11–16° | 4.90 | 2.23 | 10.79 | <0.001 | 2.66 | 0.91 | 7.80 | 0.074 |
| MDA > 16° | 25.63 | 7.63 | 86.14 | <0.001 | 11.65 | 2.44 | 55.63 | 0.002 |
| MMB 4 ≥ 122° | 9,96 | 4.79 | 20.68 | <0.001 | 4.47 | 1.59 | 11.52 | 0.005 |
Table 4. Multivariable logistic regression analysis for an independent diagnostic predictor of Blount’s disease after backward elimination of preselected predictors with transformed coefficients and assigned scores (imputed dataset n = 158).
| Characteristics | Multivariable Analysis | Score | ||||
|---|---|---|---|---|---|---|
| (n = 158 sides) | β | 95% CI | p-value | Transformed β | Assigned score | |
| Age ≥ 24 months) | 1.05 | 0.15 | 1.94 | 0.022 | 1.34 | 1.5 |
| BMI 1 ≥ 23 kg/m2 | 0.78 | −0.30 | 1.87 | 0.154 | 1.00 | 1 |
| MDA 2 | ||||||
| MDA < 11° | Reference | 0 | ||||
| MDA 11–16° | 1.16 | 0.17 | 2.16 | 0.022 | 1.49 | 1.5 |
| MDA > 16° | 2.60 | 1.10 | 4.11 | 0.001 | 3.34 | 3.5 |
| MMB 3 ≥ 122° | 1.50 | 0.58 | 2.43 | 0.001 | 1.93 | 2 |
Table 5. Distribution of Blount’s disease and physiologic bow-leg into low, moderate, and high-risk categories with model scoring, positive likelihood ratio (LR+), and negative likelihood ratio (LR−) with their 95% confidence intervals (CI).
| Risk Categories | Score | Blount | Physiologic Bow-Leg | LR+ | 95% CI | LR− | 95% CI | p-Value | ||||
|---|---|---|---|---|---|---|---|---|---|---|---|---|
| n | (%) | n | (%) | |||||||||
| Low risk | <2.5 | 6 | 7.1 | 31 | 41.9 | 0.17 | 0.06 | 0.45 | 5.86 | 2.27 | 18.01 | <0.001 |
| Moderate risk | 2.5–5.5 | 38 | 45.2 | 41 | 55.4 | 0.82 | 0.46 | 1.45 | 1.22 | 0.69 | 2.18 | 0.462 |
| High risk | >5.5 | 40 | 47.6 | 2 | 2.7 | 17.62 | 4.41 | 70.41 | 0.06 | 0.01 | 0.23 | <0.001 |
| Mean ± SE | 5.2 | 0.2 | 2.5 | 0.2 | <0.001 | |||||||
3. Conclusions
The developed diagnostic prediction model for discriminating an early stage of Blount’s disease from physiologic bowlegs demonstrated high discriminative ability with minimal optimism. This model could assist primary care physicians in making an early diagnosis and treatment selection to improve the final outcome of Blount’s disease.
This entry is adapted from the peer-reviewed paper 10.3390/children8100890
This entry is offline, you can click here to edit this entry!