Your browser does not fully support modern features. Please upgrade for a smoother experience.
Please note this is an old version of this entry, which may differ significantly from the current revision.
Subjects:
Biochemistry & Molecular Biology
|
Oncology
Gemtuzumab ozogamicin (GO) is a humanized anti-CD33 monoclonal antibody conjugated to calicheamicin, a cytotoxic antitumor antibiotic. GO is indicated for the treatment of newly-diagnosed or relapsed/refractory CD33-positive acute myeloid leukemia (AML).
- acute myeloid leukemia
- gemtuzumab ozogamicin
- biomarkers
- CD33
- FLT3
- therapy
1. Introduction
Gemtuzumab ozogamicin (GO, Mylotarg®) is a humanized monoclonal antibody conjugated to cytotoxic compound called calicheamicin. The two molecules are covalently linked via a butanoic acid linker which is hydrolized in the acidic environment of the lysosome. GO is directed against the cluster of differentiation 33 (CD33) which represents a hallmark of myeloid leukemic blasts, widely expressed in AML patients. Previous studies have shown that it was expressed on leukemic blasts in about 90% of AML patients[1][2]. Several clinical studies have highlighted the clinical benefit of GO on patient outcome (Table 1). GO stands for the first antibody drug conjugate approved by the Food and Drug Administration (FDA).
Table 1. Overview of the main clinical trials evaluating GO efficacy.
| Phase | Patient Population | Median Age of Patients in Years (Range) | Evaluable Patients | GO Dosing | Treatment Plan | Outcomes | Ref. |
|---|---|---|---|---|---|---|---|
| I | Relapsed/refractory AML patients | 54 (24–73) | 40 | Escalating doses, 0.25 to 9 mg/m2 | Single arm trial, GO administered as single agent | ORR: 8/40 patients (20%) | Sievers 1999 [3] |
| II | AML patients in first relapse | 61 (22–84) | 142 | 9 mg/m2, 2 doses recommended (max. 3 doses), with at least 14 days between 2 doses | Single arm trial, GO administered as single agent | ORR: 42/142 patients (30%), CR rate: 16%, CRp rate: 13% | Sievers 2001 [4] |
| II | De novo AML in first relapse | 64 (22–80) | 57 | Fractionated doses: 3 mg/m2 on days 1, 4 and 7 of the first course | Single arm trial, GO administered as single agent in induction, followed by cytarabine-based consolidation | ORR: 19/57 (33%), CR rate: 15/57 (26%), CRp: 4/57 (7%) | Taksin 2007 [5] |
| I/II | De novo AML in first relapse | 60 (40–70) | 20 | Fractionated doses: 3 mg/m2 on days 1, 4 and 7 of the first course | Single arm trial, GO combined with DA (DA dosing finding) | ORR: 13/20 patients (65%), CR rate: 11/20 patients (55%), CRp rate: 2/20 patients (10%) | Farhat 2012 [6] |
| III | De novo/secondary AML | 50 (15–71) | 1113 | 3 mg/m2 on day 1 of course 1 +/− on day 1 of the course 3 | Randomization at induction and at consolidation. Induction regimen (DA or ADE or FLAG-Ida) +/− GO. Consolidation regimen (MACE or MidAC or high-dose cytarabine) +/− GO | GO- vs. no GO-arm: CR, 82% vs. 83%, OR: 1.04, 95% CI: 0.76–1.42, p = 0.8; 5-year OS, 43% vs. 41%, HR: 0.92, 95% CI: 0.79–1.08, p = 0.3; 5-year RFS: 39% vs. 35%, HR: 0.87, 95% CI: 0.73–1.02, p = 0.09 | Burnett 2011 [7] |
| III | De novo AML | 47 (18–60) | 595 | 6 mg/m2 on day 4; additional 3 doses of GO, 5 mg/m2 for patients in CR after consolidation | Randomized trial, GO plus modified DA (daunorubicin, 45 mg/m2/d, day 1 to day 3; cytarabine, 100 mg/m2/d, day 1 to day 7) vs. standard DA (daunorubicin, 60 mg/m2/d, day 1 to day 3; cytarabine, 100 mg/m2/d, day 1 to day 7) | DA + GO vs. DA alone: ORR: 76% vs. 74%, p = 0.36; CR rate: 69% vs. 70%, p = 0.59; 5-year RFS: 43% vs. 42%, p = 0.40; 5-year OS: 46% vs. 50%, p = 0.85 | Petersdorf 2013 [8] |
| III | De novo/secondary AML and high-risk MDS | 67 (51–84) | 1115 | 3 mg/m2 on day 1 of the first course | Randomized trial: DA or daunorubicin/clofarabine +/− GO | GO- vs. no GO-arm: ORR: 70% vs. 68%, OR: 0.88, 95% CI: 0.68–1.13, p = 0.3; 3-year OS: 25% vs. 20%; HR: 0.87, 95% CI: 0.76–1.00, p = 0.05; 3-year RFS: 21% vs. 16%, HR: 0.84, 95%CI: 0.71–0.99, p = 0.04 | Burnett 2012 [9] |
| III | De novo AML patients with intermediate cytogenetic risk | 50 (18–60) | 238 | 6 mg/m2 on day 4 of the induction and on day 4 of the first consolidation course | Randomized trial: intensive induction regimen (DA) +/− GO, consolidation (MidAC) +/− GO, +/− HSCT | GO- vs. no-GO-arm: CR rate: 91.6% vs. 86.5%, p = NS; 3-year OS: 53% vs. 46%, p = NS; 3-year EFS: 51% vs. 33%, p = NS. In non HSCT recipients, GO vs. no GO-arm: 3-year EFS: 53.7% vs. 27%, p = 0.0308 | Delaunay 2011 [10] |
| III | De novo AML | 62 (50–70) | 271 | 3 mg/m2 on days 1, 4, and 7 of induction and on day 1 of each of the subsequent two consolidation courses | Randomized trial: DA +/− GO | GO- vs. no-GO-arm: ORR: 81.5% vs. 73.5% (p = 0.15) (CR: 70.4% vs. 69.9%; CRp:11.1% vs. 3.7%); median EFS: 13.6 months vs. 8.5 months, HR: 0.66, 95% CI: 0.49–0.89, p = 0.006; median OS: 27.5 months vs. 21.8 months, HR: 0.81, 95% CI: 0.60–1.09, p = 0.16 | Castaigne 2012, Lambert 2019 [11][12] |
| III | De novo or secondary AML and high-risk MDS | 50 (0–81) | 788 | 3 mg/m2 vs. 6 mg/m2 on day 1 of induction | Randomized trial: GO 3 vs. 6 mg/m2 + combined with ADE vs. DA | GO 3 mg/m2 vs. 6 mg/m2: ORR: 89% vs. 86%, HR: 1.34, 95%CI:0.88–2.04, p = 0.17; (CR rate 82% vs. 76%, OR: 1.46, 95%CI: 1.04–2.06, p = 0.03); 4-year OS: 50% vs. 47%, HR: 1.10, 95% CI: 0.90–1.34, p = 0.3; 4-year RFS: 44% vs. 38%, HR: 1.11, 95% CI: 0.91–1.35, p = 0.3 | Burnett 2016 [13] |
| III | De novo/secondary AML | 67 (60–75) | 472 | 3 mg/m2 for 2 doses, on days 1 and 15 of induction, 3 mg/m2 on the first day of consolidation | Randomized trial: intensive chemotherapy (MICE induction) +/− GO | GO vs. no-GO-arm: ORR: 45% vs. 49%; OR: 0.86, 95% CI, 0.6–1.23, p = 0.46; OS: HR: 1.20, 95% CI: 0.99–1.45, p = 0.07; RFS: HR: 1.08, 95% CI: 0.81–1.44, p = 0.61 | Amadori 2013 [14] |
| III | De novo/secondary AML unfit for intensive chemotherapy | 77 (62–88) | 237 | 6 mg/m2 on day 1 and 3 mg/m2 on day 8, +/−2 mg/m2/month for up to 8 doses | Randomized trial: GO alone vs. BSC | GO- vs. BSC-arm: median OS: 4.9 months vs. 3.6 months, HR: 0.69, 95% CI: 0.53–0.90, p = 0.005 | Amadori 2016 [15] |
| I | Relapsed/refractory AML patients | 12 (1–16) | 29 | Escalating doses, 6 to 9 mg/m2 | Single arm trial, GO administered as single agent | ORR: 8/29 patients (28%); CR rate: 14%; CRp rate: 14%) | Arceci et al. 2005 [16] |
| II | Refractory de novo AML or newly diagnosed secondary AML | 11.5 (0.8–19.8) | 45 | 2 to 3 mg/m2 | Non randomized multi-arm trial, GO + cytarabine + mitoxantrone (arm A) vs. GO+ cytarabine+ L-asparaginase (arm B) | Arm A vs. arm B: ORR: 55% vs. 40%, p = NS; 1-year EFS: 55% vs. 21.8%, p = NS; 1-year OS: 64.6% vs. 45.0% p = NS | Aplenc 2008 [17] |
| II | Newly diagnosed de novo AML | 9.5 (0.07–21.6) | 340 | 3 mg/m2 on day 6 of course 1 and day 7 of course 4 | Single arm trial, GO combined with intensive chemotherapy | CR rate: 83.1%; 3-year OS: 66%; 3-year EFS: 53% | Cooper 2012 [18] |
| III | Newly diagnosed de novo AML | 9.7 (0–29) | 1022 | 3 mg/m2 on day 6 of induction course 1, and on day 7 of intensification course 2 | Randomized trial, GO +/− standard chemotherapy | GO- vs. no-GO arm: CR rate: 88.3% vs. 85.1, p = 0.15; 3-year EFS: 53.1% vs. 46.9%, HR: 0.83, 95% CI: 0.70–0.99, p = 0.04; 3-year OS: 69.4% vs. 65.4%; HR: 0.91, 95% CI: 0.74–1.13, p = 0.39 | Gamis 2014 [19] |
COG: Children’s Oncology Group; MDS: myelodysplastic syndrome; CR: Complete Remission; CRp: all criteria for CR without the full recovery of platelets count; ORR: overall response rate (CR+CRp); DA: daunorubicin plus cytarabine; DAE: cytarabine, daunorubicin, and etoposide; FLAG-Ida: fludarabine, cytarabine, granulocyte colony-stimulating factor, and idarubicin; MACE: amsacrine, cytarabine and etoposide; MidAC: mitoxantrone and cytarabine; MICE: mitoxantrone, cytarabine, and etoposide; BSC: best supportive care, HSCT: hematopoietic stem cell transplantation; NA: Not available; NS: not significant.
2. The Target Antigen CD33
The CD33 antigen is a 67 kD single chain transmembrane glycoprotein that belongs to the sialic-acid-binding immunoglobulin-like lectins family (Siglecs). CD33 is a differentiation antigen especially expressed among physiologic myeloid progenitors and widely expressed in myeloid leukemic blasts[20]. The CD33 gene is composed of eight exons. Exons 1 and 2 encode for the amino-terminal V-set signal peptide, an immunoglobulin-like domain mediating the sialic-acid binding, exons 3 and 4 encode the C2-set domain, and exon 5 encodes the transmembrane domain. The intracytoplasmic domain, encoded by exons 6, 7a and 7b, comprises two tyrosine-based inhibitory signaling motifs (Y340 and Y358) which, upon phosphorylation, provide docking sites for the Src homology-2 domain-containing tyrosine phosphatases (SHP) and the suppressor of cytokine signaling 3 (SOCS3)[21][22].
3. Mechanism of Action
After binding to the CD33 antigen, the GO-CD33 complex is rapidly internalized[23]. In the cytoplasm, the complex is routed in the lysosome. Under the acidic environment of the lysosome, the butanoic acid linker is hydrolyzed, releasing the toxic moiety of the GO. The calicheamicin derivative is reduced by the glutathione into a highly reactive species which induces simple- and double-stranded DNA breaks, leading to DNA-damage and cell death[24].
4.Predictive markers of efficacy
Enhanced knowledge about the GO metabolic pathway at both cellular and molecular levels has raised and improved understanding on GO response biomarkers (Figure 1) [25]. Predictive markers of efficacy include leukemic cells's characteristics such as high CD33 expression [26], as expected, but also non-adverse cytogenetic alterations [11][27], specific molecular lesions such as NPM1 mutations, FLT3-internal tandem duplications and mutations involving signaling pathways [28], and a low 17-gene leukemic stem cell score [29].Other factors have been shown to directly affect GO binding or intracellular concentration leading to a poorer response to GO. They include specific CD33 polymorphims (such as the rs12459419, resulting in CD33 exon 2 skipping, and ultimately leading to a shorter CD33 isoform lacking the epitope for GO)[30], high ABCA1 expression (which may pump calicheamicin out of the cell before exerting its cytotoxic activity) [31] or CD33-induced proteasomal degradation through SOCS3 binding [32].
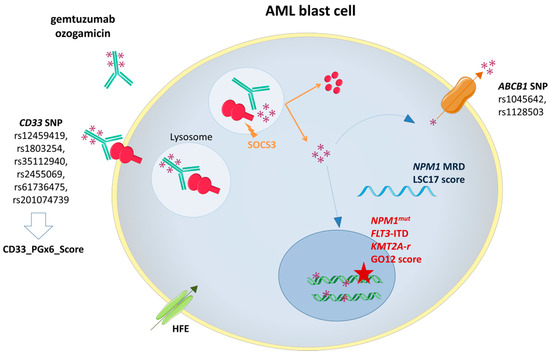
Figure 1. Gemtuzumab ozogamicin (GO) mechanism of action and biomarkers of response. SOCS3: Suppressor Of Cytokine Signaling 3; ABCB1: ATP-binding cassette subfamily B member 1 gene; NPM1mut: Nucleophosmin 1 gene mutation; FLT3-ITD: FMS-Like Tyrosine Kinase 3 Internal Tandem Duplication; KMT2A-r: Lysine Methyltransferase 2A rearrangement.
4.Conclusions
Given its high expression on AML blasts, CD33 antigen represents an attractive target in AML. Different clinical trials have confirmed the anti-leukemic activity of GO in CD33-positive AML cells and have shown improved outcome in AML patients. Over the past years, flow cytometry, cytogenetics, and molecular approaches, including sequencing technologies, MRD monitoring, and genotyping studies of CD33 and ABCB1 SNPs have offered a comprehensive analysis of promising biomarkers for GO response. Collectively, these improvements have helped to refine the subset of patients that may benefit from GO and improve patient management. Increasing knowledge of the molecular alterations in AML paves the way to new combinatory regimens that may enhance GO efficacy. Hence, ongoing trials are evaluating the feasibility and the efficacy of combining GO to FLT3-ITD inhibitors (NCT03900949, NCT04385290, NCT04293562) and Bcl-2 inhibitors (NCT04070768, NCT04070768).
This entry is adapted from the peer-reviewed paper 10.3390/ijms21165626
References
- Griffin, J.D.; Linch, D.; Sabbath, K.; Larcom, P.; Schlossman, S.F. A monoclonal antibody reactive with normal and leukemic human myeloid progenitor cells. Leuk. Res. 1984, 8, 521–534.
- Dinndorf, P.A.; Andrews, R.G.; Benjamin, D.; Ridgway, D.; Wolff, L.; Bernstein, I.D. Expression of normal myeloid-associated antigens by acute leukemia cells. Blood 1986, 67, 1048–1053.
- Sievers, E.L.; Appelbaum, F.R.; Spielberger, R.T.; Forman, S.J.; Flowers, D.; Smith, F.O.; Shannon-Dorcy, K.; Berger, M.S.; Bernstein, I.D. Selective Ablation of Acute Myeloid Leukemia Using Antibody-Targeted Chemotherapy: A Phase I Study of an Anti-CD33 Calicheamicin ImmunoconjugatePresented in part at the 1997 Annual Meeting of the American Society of Clinical Oncology, Denver, CO; the 1997 European Cancer Conference, Hamburg, Germany; and the 1997 Annual Meeting of the American Society of Hematology, San Diego, CA. Blood 1999, 93, 3678–3684.
- Sievers, E.L.; Larson, R.A.; Stadtmauer, E.A.; Estey, E.; Löwenberg, B.; Dombret, H.; Karanes, C.; Theobald, M.; Bennett, J.M.; Sherman, M.L.; et al. Efficacy and safety of gemtuzumab ozogamicin in patients with CD33-positive acute myeloid leukemia in first relapse. J. Clin. Oncol. Off. J. Am. Soc. Clin. Oncol. 2001, 19, 3244–3254.
- Taksin, A.-L.; Legrand, O.; Raffoux, E.; de Revel, T.; Thomas, X.; Contentin, N.; Bouabdallah, R.; Pautas, C.; Turlure, P.; Reman, O.; et al. High efficacy and safety profile of fractionated doses of Mylotarg as induction therapy in patients with relapsed acute myeloblastic leukemia: A prospective study of the alfa group. Leukemia 2007, 21, 66–71.
- Farhat, H.; Reman, O.; Raffoux, E.; Berthon, C.; Pautas, C.; Kammoun, L.; Chantepie, S.; Gardin, C.; Rousselot, P.; Chevret, S.; et al. Fractionated doses of gemtuzumab ozogamicin with escalated doses of daunorubicin and cytarabine as first acute myeloid leukemia salvage in patients aged 50–70-year old: A phase 1/2 study of the acute leukemia French association. Am. J. Hematol. 2012, 87, 62–65.
- Burnett, A.K.; Hills, R.K.; Milligan, D.; Kjeldsen, L.; Kell, J.; Russell, N.H.; Yin, J.A.L.; Hunter, A.; Goldstone, A.H.; Wheatley, K. Identification of patients with acute myeloblastic leukemia who benefit from the addition of gemtuzumab ozogamicin: Results of the MRC AML15 trial. J. Clin. Oncol. Off. J. Am. Soc. Clin. Oncol. 2011, 29, 369–377.
- Petersdorf, S.H.; Kopecky, K.J.; Slovak, M.; Willman, C.; Nevill, T.; Brandwein, J.; Larson, R.A.; Erba, H.P.; Stiff, P.J.; Stuart, R.K.; et al. A phase 3 study of gemtuzumab ozogamicin during induction and postconsolidation therapy in younger patients with acute myeloid leukemia. Blood 2013, 121, 4854–4860.
- Burnett, A.K.; Russell, N.H.; Hills, R.K.; Kell, J.; Freeman, S.; Kjeldsen, L.; Hunter, A.E.; Yin, J.; Craddock, C.F.; Dufva, I.H.; et al. Addition of gemtuzumab ozogamicin to induction chemotherapy improves survival in older patients with acute myeloid leukemia. J. Clin. Oncol. Off. J. Am. Soc. Clin. Oncol. 2012, 30, 3924–3931.
- Delaunay, J.; Recher, C.; Pigneux, A.; Witz, F.; Vey, N.; Blanchet, O.; Lefebvre, P.; Luquet, I.; Guillerme, I.; Volteau, C.; et al. Addition of gemtuzumab ozogamycin to chemotherapy improves event-free survival but not overall survival of AML patients with intermediate cytogenetics not eligible for allogeneic transplantation. results of the GOELAMS AML 2006 IR study. Blood 2011, 118, 79.
- Castaigne, S.; Pautas, C.; Terré, C.; Raffoux, E.; Bordessoule, D.; Bastie, J.-N.; Legrand, O.; Thomas, X.; Turlure, P.; Reman, O.; et al. Effect of gemtuzumab ozogamicin on survival of adult patients with de-novo acute myeloid leukaemia (ALFA-0701): A randomised, open-label, phase 3 study. Lancet Lond. Engl. 2012, 379, 1508–1516.
- Lambert, J.; Pautas, C.; Terré, C.; Raffoux, E.; Turlure, P.; Caillot, D.; Legrand, O.; Thomas, X.; Gardin, C.; Gogat-Marchant, K.; et al. Gemtuzumab ozogamicin for de novo acute myeloid leukemia: Final efficacy and safety updates from the open-label, phase III ALFA-0701 trial. Haematologica 2019, 104, 113–119.
- Burnett, A.; Cavenagh, J.; Russell, N.; Hills, R.; Kell, J.; Jones, G.; Nielsen, O.J.; Khwaja, A.; Thomas, I.; Clark, R.; et al. Defining the dose of gemtuzumab ozogamicin in combination with induction chemotherapy in acute myeloid leukemia: A comparison of 3 mg/m2 with 6 mg/m2 in the NCRI AML17 trial. Haematologica 2016, 101, 724–731.
- Amadori, S.; Suciu, S.; Stasi, R.; Salih, H.R.; Selleslag, D.; Muus, P.; De Fabritiis, P.; Venditti, A.; Ho, A.D.; Lübbert, M.; et al. Sequential combination of gemtuzumab ozogamicin and standard chemotherapy in older patients with newly diagnosed acute myeloid leukemia: Results of a randomized phase III trial by the EORTC and GIMEMA consortium (AML-17). J. Clin. Oncol. Off. J. Am. Soc. Clin. Oncol. 2013, 31, 4424–4430.
- Amadori, S.; Suciu, S.; Selleslag, D.; Aversa, F.; Gaidano, G.; Musso, M.; Annino, L.; Venditti, A.; Voso, M.T.; Mazzone, C.; et al. Gemtuzumab ozogamicin versus best supportive care in older patients with newly diagnosed acute myeloid leukemia unsuitable for intensive chemotherapy: Results of the randomized phase III EORTC-GIMEMA AML-19 trial. J. Clin. Oncol. 2016, 34, 972–979.
- Arceci, R.J.; Sande, J.; Lange, B.; Shannon, K.; Franklin, J.; Hutchinson, R.; Vik, T.A.; Flowers, D.; Aplenc, R.; Berger, M.S.; et al. Safety and efficacy of gemtuzumab ozogamicin in pediatric patients with advanced CD33+ acute myeloid leukemia. Blood 2005, 106, 1183–1188.
- Aplenc, R.; Alonzo, T.A.; Gerbing, R.B.; Lange, B.J.; Hurwitz, C.A.; Wells, R.J.; Bernstein, I.; Buckley, P.; Krimmel, K.; Smith, F.O.; et al. Safety and efficacy of gemtuzumab ozogamicin in combination with chemotherapy for pediatric acute myeloid leukemia: A report from the children’s oncology group. J. Clin. Oncol. Off. J. Am. Soc. Clin. Oncol. 2008, 26, 2390–3295.
- Cooper, T.M.; Franklin, J.; Gerbing, R.B.; Alonzo, T.A.; Hurwitz, C.; Raimondi, S.C.; Hirsch, B.; Smith, F.O.; Mathew, P.; Arceci, R.J.; et al. AAML03P1, a pilot study of the safety of gemtuzumab ozogamicin in combination with chemotherapy for newly diagnosed childhood acute myeloid leukemia: A report from the children’s oncology group. Cancer 2012, 118, 761–769.
- Gamis, A.S.; Alonzo, T.A.; Meshinchi, S.; Sung, L.; Gerbing, R.B.; Raimondi, S.C.; Hirsch, B.A.; Kahwash, S.B.; Heerema-McKenney, A.; Winter, L.; et al. Gemtuzumab ozogamicin in children and adolescents with de novo acute myeloid leukemia improves event-free survival by reducing relapse risk: Results from the randomized phase III children’s oncology group trial AAML0531. J. Clin. Oncol. Off. J. Am. Soc. Clin. Oncol. 2014, 32, 3021–3032.
- Andrews, R.G.; Takahashi, M.; Segal, G.M.; Powell, J.S.; Bernstein, I.D.; Singer, J.W. The L4F3 antigen is expressed by unipotent and multipotent colony-forming cells but not by their precursors. Blood 1986, 68, 1030–1035.
- Paul, S.P.; Taylor, L.S.; Stansbury, E.K.; McVicar, D.W. Myeloid specific human CD33 is an inhibitory receptor with differential ITIM function in recruiting the phosphatases SHP-1 and SHP-2. Blood 2000, 96, 483–490.
- Taylor, V.C.; Buckley, C.D.; Douglas, M.; Cody, A.J.; Simmons, D.L.; Freeman, S.D. The myeloid-specific sialic acid-binding receptor, CD33, associates with the protein-tyrosine phosphatases, SHP-1 and SHP-2. J. Biol. Chem. 1999, 274, 11505–11512.
- an Der Velden, V.H.; te Marvelde, J.G.; Hoogeveen, P.G.; Bernstein, I.D.; Houtsmuller, A.B.; Berger, M.S.; van Dongen, J.J. Targeting of the CD33-calicheamicin immunoconjugate Mylotarg (CMA-676) in acute myeloid leukemia: In vivo and in vitro saturation and internalization by leukemic and normal myeloid cells. Blood 2001, 97, 3197–3204.
- Elmroth, K.; Nygren, J.; Mårtensson, S.; Ismail, I.H.; Hammarsten, O. Cleavage of cellular DNA by calicheamicin gamma1. DNA Repair 2003, 2, 363–374.
- Fenwarth, L.; Fournier, E.; Cheok, M.; Boyer, T.; Gonzales, F.; Castaigne, S.; Boissel, N.; Lambert, J.; Dombret, H.; Preudhomme, C.; et al. Biomarkers of Gemtuzumab Ozogamicin Response for Acute Myeloid Leukemia Treatment. International Journal of Molecular Sciences 2020, 21, 5626, doi:10.3390/ijms21165626.
- Olombel, G.; Guerin, E.; Guy, J.; Perrot, J.-Y.; Dumezy, F.; de Labarthe, A.; Bastie, J.-N.; Legrand, O.; Raffoux, E.; Plesa, A.; et al. The level of blast CD33 expression positively impacts the effect of gemtuzumab ozogamicin in patients with acute myeloid leukemia. Blood 2016, 127, 2157–2160.
- Burnett, A.K.; Hills, R.K.; Milligan, D.; Kjeldsen, L.; Kell, J.; Russell, N.H.; Yin, J.A.L.; Hunter, A.; Goldstone, A.H.; Wheatley, K. Identification of patients with acute myeloblastic leukemia who benefit from the addition of gemtuzumab ozogamicin: Results of the MRC AML15 trial. J. Clin. Oncol. Off. J. Am. Soc. Clin. Oncol. 2011, 29, 369–377.
- Fournier, E.; Duployez, N.; Ducourneau, B.; Raffoux, E.; Turlure, P.; Caillot, D.; Thomas, X.; Marceau-Renaut, A.; Chantepie, S.; Malfuson, J.-V.; et al. Mutational profile and benefit of gemtuzumab ozogamicin in acute myeloid leukemia. Blood 2020, 135, 542–546.
- Ng, S.W.K.; Mitchell, A.; Kennedy, J.A.; Chen, W.C.; McLeod, J.; Ibrahimova, N.; Arruda, A.; Popescu, A.; Gupta, V.; Schimmer, A.D.; et al. A 17-gene stemness score for rapid determination of risk in acute leukaemia. Nature 2016, 540, 433–437.
- Lamba, J.K.; Pounds, S.; Cao, X.; Downing, J.R.; Campana, D.; Ribeiro, R.C.; Pui, C.-H.; Rubnitz, J.E. Coding polymorphisms in CD33 and response to gemtuzumab ozogamicin in pediatric patients with AML: A pilot study. Leukemia 2009, 23, 402–404.
- Boyer, T.; Gonzales, F.; Barthélémy, A.; Marceau-Renaut, A.; Peyrouze, P.; Guihard, S.; Lepelley, P.; Plesa, A.; Nibourel, O.; Delattre, C.; et al. Clinical significance of ABCB1 in acute myeloid leukemia: A comprehensive study. Cancers 2019, 11, 1323.
- Middeldorf, I.; Galm, O.; Osieka, R.; Jost, E.; Herman, J.G.; Wilop, S. Sequence of administration and methylation of SOCS3 may govern response to gemtuzumab ozogamicin in combination with conventional chemotherapy in patients with refractory or relapsed acute myelogenous leukemia (AML). Am. J. Hematol. 2010, 85, 477–481.
This entry is offline, you can click here to edit this entry!