Jakarta’s Destination Brand Image: History
Please note this is an old version of this entry, which may differ significantly from the current revision.
Contributor:

Destination image and city branding are accumulating a growing body of knowledge in urban studies and tourism literature. Although several visitor destination image models have been proposed, the most prevalent in Asia remains the comprehensive destination image model. This is the first research to test the applicability of this model beyond the United States and with international (rather than domestic) visitors. Jakarta is chosen as the geographical test area for this study, which incorporates structural equation modeling on a data sample of international leisure visitors in Jakarta. The findings indicate that the destination image model could be generalized beyond the US and applied to Jakarta. This study finds that tourism policymakers in Jakarta should focus on promoting the friendliness of local residents and improving the city’s cleanliness, as these are the two most positive and negative perceptions. Overall, this study showed that a unique destination image—a largely under-researched topic in place branding—is a variable that should be considered when formulating the overall place image of city destinations around the world. 

  • destination image
  • Indonesia
  • intentions
  • Jakarta
  • LISREL
  • structural equation modeling

1. Introduction

Place branding has been applied to the promotion of nations, with a growing trend toward the more specific branding of urban destinations. In essence, nation and city branding are anchored in similar processes, albeit at different levels of governance [1][2][3][4]. This research uses destination branding to encapsulate these processes at differing levels, including cities. Historically, place branding and destination branding have emerged from a variety of disciplines, including marketing, public relations, international relations, public administration, public diplomacy, tourism, communication, and geography [5][6]. Not surprisingly, the diverse definitions of place branding is on par with the variety of disciplines contributing to the development of this body of knowledge [7]. Regardless, destination branding can be reduced to the concepts invoked in people’s minds when branding principles are applied to a place [8]. These associations can be modified to develop new and more desirable destination images. Scholars have developed and tested several models, items, and scales to analyze destination branding, with much of this focusing specifically on cities [9][10]. Regardless of the diverse and often contested interpretations of place branding [11], there appears to be consensus on place image playing a crucial role in destination branding [9][12][13][14][15]. Destination images have been studied since the early 1970s when a seminal study [16] examined the role of image in the development of tourism [17]. The depth and complexity of destination image have produced hundreds of studies investigating its various dimensions linked to overall place image [9][18][19][20][21][22][23]. In addition to the determinants of destination image, it is also essential to explore where destination image leads. Several studies have shown that there is a relationship between destination image and visitor behavior [24].

2. Results and Discussion

2.1. Descriptive Statistics

2.1.1. Demographics, Origins, and Lengths of Stay

The age of the respondents varied from 16 to 71 years, rendering an average value of 29.8 with a mode of 23 years. Most were not married (228 respondents), with a majority of respondents being male (53.4%). There was also a wide range among respondents in terms of country of origin, with a total of 44 nationalities represented including countries in Europe, Asia, the Americas, Africa, the Middle East, and Oceania. The highest number of respondents originated from the Netherlands (80), representing 25% of the sample, which may be due in part to the historical links between Indonesia and the Netherlands.
The respondents were generally well educated, with 75.7% having university degrees. The lengths of stay in Jakarta were relatively short. Some 39.2% were in the city for less than three days, and 43.7% were staying for three to five days.

2.1.2. Cognitive Images

Table 1 shows the mean score for all image items. The highest mean score (4.35) was for friendly local people (Q7). Other cognitive images with higher scores included delicious local cuisine (Q8), good weather (Q12), a wide choice of accommodations (Q18), reasonable cost of hotels/restaurants (Q3), native Indonesian culture (Q26), and rich historic and cultural sites (Q27).
Table 1. Median scores for image items.
Cognitive Image Items Median Scores (n = 311)
Easy access to the area (Q1) 4
Restful and relaxing atmosphere (Q2) 3
Reasonable cost of hotels/restaurants (Q3) 4
Reasonable cost of shopping centers (Q4) 3
Beautiful scenery/natural wonders (Q5) 3
Lots of open space (Q6) 3
Friendly local people (Q7) 5
Delicious local cuisine (Q8) 4
Great state/theme parks (Q9) 3
Good place for children/family (Q10) 3
Availability of tourist welcome centers (Q11) 3
Good weather (Q12) 4
Interesting cultural events/festivals (Q13) 3
Good shopping facilities (Q14) 4
Clean/unspoiled environment (Q15) 2
Good infrastructure (Q16) 3
Availability of travel information (Q17) 3
A wide choice of accommodations (Q18) 4
Safe and secure environment (Q19) 4
A wide variety of entertainment (Q20) 3
Great nightlife (Q21) 3
Numerous water sports (Q22) 3
A wide variety of outdoor activities (Q23) 3
Lots of adventurous activities (Q24) 3
Availability of facilities for golfing/tennis (Q25) 3
Native Indonesian culture (Q26) 4
Rich historic and cultural sites (Q27) 4
Note: Strongly disagree = 1; disagree = 2; neutral = 3; agree = 4; strongly agree = 5.
Only one of the 27 cognitive image items was ranked below the scale’s mid-point of 3.0. The lowest cognitive image item median score was for a clean/unspoiled environment (Q15). The highest median of 5 was for friendly local people. Most of the items had medians of 3, which shows that respondents perceived Jakarta neither very positively nor very negatively. These scores should be of some concern to the destination management officials in Jakarta.

2.1.3. Unique Images

The highest median score for unique images was 4. Only three out of 11 had median scores of 4. The rest had medians of 3. This is similar to Jakarta’s cognitive image.

2.1.4. Affective Images

The scale for the affective image was different than for the cognitive and unique, ranging from 1 to 7, with 4 as the neutral mid-point. The medians were mostly at 5, which again was slightly above neutral. The most negative score with a median of 4 was relaxing (Q41).

2.1.5. Overall Image of Jakarta

The median score for the overall image of Jakarta (Q43) was positive at 5.

2.1.6. Future Intentions

The intention to recommend (Q45) had a median score of 4, which was slightly higher than the intention to revisit (Q44) at 3.

2.2. Confirmatory Factor Analysis

2.2.1. Validity and Reliability Tests

The image items were further analyzed using SEM and CFA. Earlier studies of a similar nature have tended to eliminate factors with loadings lower than 0.40. However, in this research, factors with a lambda (λ) coefficient lower than 0.50 were excluded so as to increase validity. On this basis, 19 factors (Table 2) were chosen for further analysis. Although reliability tends to be implicit once validity has been justified, a reliability analysis using Cronbach’s alpha (α) was carried out as a double-check on the reliability of these data. The Cronbach’s alpha (α) values for the cognitive, unique, and affective images were found to be 0.849, 0.778, and 0.766 respectively. All data were deemed reliable as a result, given that similar earlier studies, as well as methodological discussions [25], have generally deemed 0.7 to be an acceptable threshold of reliability. Similarly, a number of items had a good fit, as shown in Table 3.
Table 2. Factors chosen for further analysis.
Image Items Cognitive Unique Affective
Beautiful scenery/natural wonders (Q5) 0.64    
Great state/theme parks (Q9) 0.55    
Good place for children/family (Q10) 0.55    
Availability of tourist welcome centers (Q11) 0.54    
Interesting cultural events/festivals (Q13) 0.54    
A wide variety of entertainment (Q20) 0.53    
Numerous water sports (Q22) 0.52    
A wide variety of outdoor activities (Q23) 0.65    
Lots of adventurous activities (Q24) 0.64    
Native Indonesian culture (Q26) 0.52    
Rich historic and cultural sites (Q27) 0.69    
Native Indonesian cultures (Q28)   0.53  
Wonderful scenery and natural wonders (Q30)   0.61  
Relaxing spas (Q31)   0.51  
Lots of tourist attractions (Q35)   0.80  
Rich cultural/historical/heritage sites (Q36)   0.75  
Pleasing (Q39)     0.64
Arousing (Q40)     0.69
Exciting (Q42)     0.86
Note: Lambda coefficients from LISREL (LAMBDA-X). Cut-off at 0.50 for inclusion.
Table 3. Goodness of fit test results.
Goodness of Fit Tests Statistics
Root Mean Square Error of Approximation (RMSEA) 0.076
Normed Fit Index (NFI) 0.93
Non-Normed Fit Index (NNFI) 0.95
Comparative Fit Index (CFI) 0.95
Incremental Fit Index (IFI) 0.95
Relative Fit Index (RFI) 0.92

2.2.2. Goodness of Fit Tests

The most commonly used goodness of fit test is chi-square. In this research, a high value of 543.48 was obtained (Table 3). However, this type of test tends to be sensitive to sample size, whereby the chi-square analysis nearly always rejects the model when large samples are used [26][27]. To reduce the impact of sample size, researchers have suggested carrying out a relative/normed chi-square analysis. In this research, the value obtained was 2.7, which falls well within the generally accepted value range of more than 2 [28][29] up to less than 5 [30]. Given that earlier studies have found several limitations related to the chi-square tests, this research carried out a root mean square error of approximation (RMSEA) analysis, which resulted in a value of 0.076—well below the maximum 0.08 threshold for a good fit [31][32]. Other indices used to ascertain a good fit with the model included NFI, NNFI, CFI, IFI, and RFI rendered values above 0.90—the threshold above which a statistical good fit is deemed applicable [27][29]. As a result, it was concluded that there was a good fit between the model and the data.
This goodness of fit test was done twice since the first test indicated that the model did not have a good fit with the data, thus LISREL 8.8 suggested several modification indices. Three of these suggestions were applied, which were to establish a relationship between questions 23 and 24, questions 26 and 28, and questions 44 and 45. Question 24 was about adventurous activities and question 23 was about outdoor activities, which are similar and therefore a correlation between the two was quite high. Question 28 concerned native Indonesian cultures (unique image item) and question 26 also regarded native Indonesian cultures (cognitive image item). Since these two items were worded similarly, it was reasonable to consider them together. Question 45 was on intention to recommend and question 44 was on intention to revisit, both reflections of tourists’ intended future behavioral intentions. After these modifications were introduced, the results had the good fit indices discussed earlier.

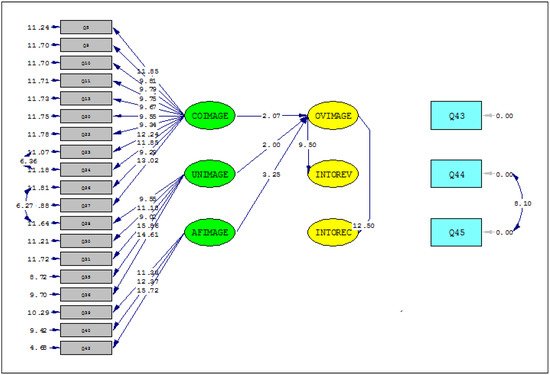
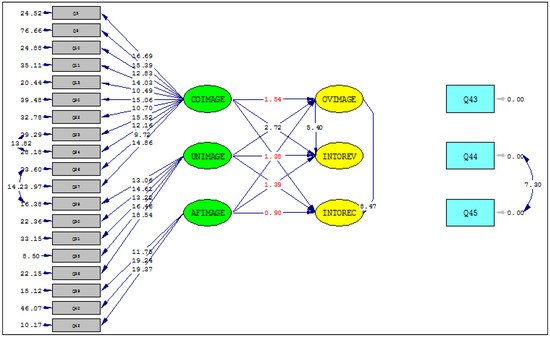
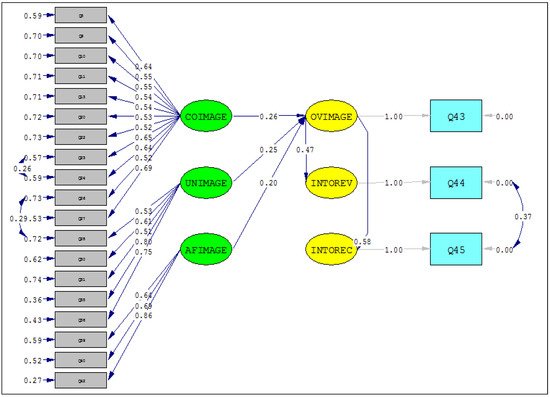
2.3. Structural Equation Modeling

Figure 1. Proposed model. Source: Adjusted from Qu, H., Kim, L. H., and Im, H. H. (2011). A model of destination branding: Integrating the concepts of the branding and destination image. Tourism Management, 32(3), p. 468. (Note: the grey arrows indicate potential direct effects tested to determine the overall image’s level of mediation).
Figure 2 shows that the overall image mediated the relationship between the three destination image categories and behavioral intentions. The relationships between cognitive, unique, affective, and overall images, as well as the relationship between overall image and behavioral intentions (intention to revisit and intention to recommend destination to others), were all significant. However, further analysis was needed to determine whether the overall image was a full or partial mediator.
Figure 2. Path diagram with corresponding t-values.
A competing model was analyzed and the results showed that the relationships between cognitive image and intention to recommend as well as the intention to revisit were significant (Figure 3). However, the relationships between the unique image and behavioral intentions, as well as the affective image and behavioral intentions, were not significant. Figure 3 shows the competing path diagram with corresponding t-values. Therefore, overall image was a partial mediator between cognitive image and behavioral intentions, while it was a full mediator between unique and affective images and behavioral intentions.
Figure 3. Competing path diagram with corresponding t-values. Chi-Square = 501.45, df = 195, p-value = 0.00000, RMSEA = 0.071.
Given that the overall image acted as a full mediator for more variables, the original model (Figure 1) was retained. The original model with corresponding estimates or total effect is shown in Figure 4. The path diagram with its corresponding standardized solution shows the total effect of one variable on another. These values suggest which destination image items have the greatest effect on the overall image. They indicate that the cognitive image has the largest effect on the overall image. The unique image has the second-largest effect and the affective image has the least effect on the overall image. Due to the COVID-19 pandemic, research has shown that international tourists are becoming more selective with their choices of destinations. As a result of this, unique images, which had received less attention from scholars in the past, should play a more critical role in post-pandemic research on destination image. The reduced amount of travel across borders requires destinations to deliver a more unique and differentiated level of offering in order to remain competitive.
Figure 4. Final path diagram with corresponding standardized solution (total effect).

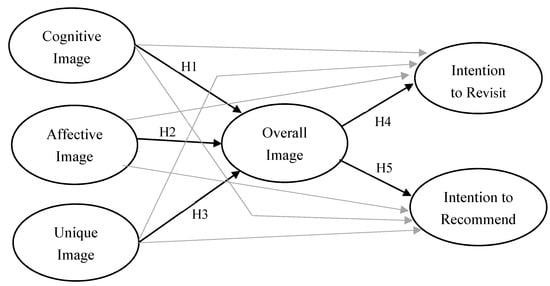
2.4. Hypotheses Tests

Once the data and model were proven to fit, be both valid and reliable, the hypotheses were tested. Each hypothesis had its null hypothesis, which was either rejected or accepted. The results for each of the five hypotheses were as follows:
Hypotheses 1 (H1):
A visitor destination’s cognitive image affects the overall image of the destination.
The hypothesis testing carried out resulted in the rejection of the null hypothesis and H1 was accepted with a significance level of 0.05 and a t-value larger than 1.96 (2.07) (Figure 3). Therefore, and in line with previous studies, cognitive image influenced the overall image of Jakarta.
Hypotheses 2 (H2):
A visitor destination’s affective image affects the overall image of the destination.
The second hypothesis was accepted, with the null hypothesis rejected with a t-value of 2.0, which was larger than 1.96 (significance level of 0.05) (Figure 2). This result was also in line with earlier studies and supports the assertion that visitors’ overall image of a destination is influenced by the effective image.
Hypotheses 3 (H3):
A visitor destination’s unique image affects the overall image of the destination.
Hypothesis 3 was accepted and the null hypothesis was rejected with a t-value larger than 1.96 at a significance level of 0.05 (3.25) (Figure 2). This is comparable with earlier studies and suggests that a destination’s unique image significantly affects the overall image of that destination.
Hypotheses 4 (H4):
Visitors’ perceptions of a destination’s overall image mediate the relationships between three destination brand images (cognitive, affective, and unique images) and people’s intentions to revisit the destination.
The null hypothesis was rejected and hypothesis 4 was accepted with a t-value of 9.50 (Figure 2), which is considerably higher than 1.96 (significance level of 0.05). This supports that the overall image significantly affects intentions to revisit a destination, which in turn also supports that the overall image is mediating the relationship between three destination brand images and intention to revisit, which is the same result as the original literature.
Hypotheses 5 (H5):
Visitors’ perceptions of a destination’s overall image mediate the relationships between three destination brand images (cognitive, affective, and unique images) and people’s intentions to recommend the destination to others.
Hypothesis 5 was accepted with a t-value larger than 1.96 at a significance level of 0.05 (12.50) (Figure 2), which suggests that a destination’s overall image influences intentions to recommend the destination to others, making the overall image a mediator between three destination images and intention to recommend.

3. Conclusions

This research tested whether the conceptual model put forward by Qu et al. [24] was applicable to the city of Jakarta. The results indicated that cognitive images positively influenced overall destination image, which replicated the results obtained by earlier studies [24][33][34]. It confirmed that cognitive images are the most influential in forming an overall destination image. The other results were consistent with earlier studies. Crucially, the issue of the unique destination image, which has received less attention, proved to have a greater effect on the overall destination image than the affective image. Finally, the affective image was found to significantly influence a destination’s overall image in line with earlier studies [24][34].
The research indicated that the destination image model first put forward by Qu et al. [24] is not only relevant for Oklahoma but also to Jakarta, demonstrating the applicability of the model to other geographical locations outside the US. Unlike the original research, where only domestic visitors were surveyed, this study used a sample of international visitors. Additionally, it was shown again that the unique destination image is a variable that should be taken into account when formulating the overall image of a destination since there has been little attention paid to the unique destination image in the tourism literature to date.
Additionally, this research sought information that could assist the Enjoy Jakarta campaign in being more successful. There were 19 factors used in the analysis. The means of the overall image and visitors’ intentions were just slightly above neutral. This shows that international visitors do not view Jakarta very positively or very negatively. The item showing a strong positive cognitive image was friendly local people (Q7) and a strong positive unique image was also found for friendly and helpful local people (Q29). The item for which international visitors had a strong negative cognitive image was a clean/unspoiled environment (Q15) and there were no strong negative unique images.

This entry is adapted from the peer-reviewed paper 10.3390/su13137434

References

  1. Lucarelli, A.; Berg, P.O. City branding: A state-of-the-art review of the research domain. J. Place Manag. Dev. 2011, 4, 9–27.
  2. Degen, M.; García, M. The transformation of the “Barcelona model”: An analysis of culture, urban regeneration and governance. Int. J. Urban Reg. Res. 2012, 36, 1022–1038.
  3. Eshuis, J.; Edwards, A. Branding the city: The democratic legitimacy of a new mode of governance. Urban Stud. 2013, 50, 1066–1082.
  4. Ginesta, X.; de San Eugenio, J. Rethinking Place Branding from a Political Perspective: Urban Governance, Public Diplomacy, and Sustainable Policy Making. Am. Behav. Sci. 2021, 65, 632–649.
  5. Sevin, H.E. Understanding cities through city brands: City branding as a social and semantic network. Cities 2014, 38, 47–56.
  6. Lu, H.; Ma, W.; Yang, Q.; Zhao, P. Exploring the impact of factors influencing case selection in the place branding literature from 2014 to 2018. J. Urban Aff. 2020.
  7. Ma, W.; Schraven, D.; de Bruijne, M.; De Jong, M.; Lu, H. Tracing the origins of place branding research: A bibliometric study of concepts in use (1980–2018). Sustainability 2019, 11, 2999.
  8. Kavaratzis, M. From city marketing to city branding: Towards a theoretical framework for developing city brands. Place Branding 2004, 1, 58–73.
  9. Gilboa, S.; Jaffe, E.D.; Vianelli, D.; Pastore, A.; Herstein, R. A summated rating scale for measuring city image. Cities 2015, 44, 50–59.
  10. Hanna, S.; Rowley, J.; Keegan, B. Place and Destination Branding: A Review and Conceptual Mapping of the Domain. Eur. Manag. Rev. 2020.
  11. Evans, G. Hard-branding the cultural city—From Prado to Prada. Int. J. Urban Reg. Res. 2003, 27, 417–440.
  12. Hollands, R.; Chatterton, P. Producing nightlife in the new urban entertainment economy: Corporatization, branding and market segmentation. Int. J. Urban Reg. Res. 2003, 27, 361–385.
  13. Richards, G.; Wilson, J. The impact of cultural events on city image: Rotterdam, cultural capital of Europe 2001. Urban Stud. 2004, 41, 1931–1951.
  14. Garcia, J.A.; Gomez, M.; Molina, A. A destination-branding model: An empirical analysis based on stakeholders. Tour. Manag. 2012, 33, 646–661.
  15. Ruiz-Real, J.L.; Uribe-Toril, J.; Gázquez-Abad, J.C. Destination branding: Opportunities and new challenges. J. Destin. Mark. Manag. 2020, 17, 100453.
  16. Hunt, J.D. Image as a factor in tourism development. J. Travel Res. 1975, 13, 1–7.
  17. Hosany, S.; Ekinci, Y.; Uysal, M. Destination image and destination personality: An application of branding theories to tourism places. J. Bus. Res. 2006, 59, 638–642.
  18. Ashworth, G.J.; Voogd, H. Selling the City: Marketing Approaches in Public Sector Urban Planning; Wiley: New York, NY, USA, 1991.
  19. Echtner, C.M.; Ritchie, J.R.B. The meaning and measurement of destination image. J. Tour. Stud. 1991, 14, 37–48.
  20. Siemiatycki, M. Message in a metro: Building urban rail infrastructure and image in Delhi, India. Int. J. Urban Reg. Res. 2006, 30, 277–292.
  21. Byon, K.; Zhang, J. Development of a scale measuring destination image. Mark. Intell. Plan. 2009, 28, 508–532.
  22. Zhang, L.; Zhao, S.X. City branding and the Olympic effect: A case study of Beijing. Cities 2009, 26, 245–254.
  23. Kislali, H.; Kavaratzis, M.; Saren, M. Destination image formation: Towards a holistic approach. Int. J. Tour. Res. 2020, 22, 266–276.
  24. Qu, H.; Kim, L.H.; Im, H.H. A model of destination branding: Integrating the concepts of the branding and destination image. Tour. Manag. 2011, 32, 465–476.
  25. Alcaniz, E.B.; Garcia, I.S.; Blas, S.S. Relationships among residents’ image, evaluation of the stay and post-purchase behavior. J. Vacat. Mark. 2005, 11, 291–302.
  26. Nunnaly, J. Psychometric Theory; McGraw-Hill: New York, NY, USA, 1978.
  27. Jöreskog, K.; Sörbom, D. LISREL 8.0: Structural Equation Modeling with SIMPLIS Command Language; Scientific Software International: Lincolnwood, IL, USA, 1993.
  28. Hooper, D.; Coughlan, J.; Mullen, M. Structural equation modelling: Guidelines for determining model fit. Electron. J. Bus. Res. Methods 2008, 6, 53–60.
  29. Ullman, J.B. Structural equation modeling. In Using Multivariate Statistics; Tabachnick, B.G., Fidell, L.S., Eds.; Allyn and Bacon: Boston, MA, USA, 2001; pp. 653–771.
  30. Tabachnick, B.G.; Fidell, L.S. Using Multivariate Statistics, 5th ed.; Allyn & Bacon: Needham Height, MA, USA, 2007.
  31. Wheaton, B.; Muthén, B.; Alwin, D.F.; Summers, G.F. Assessing reliability and stability in panel models. Sociol. Methodol. 1977, 8, 84–136.
  32. MacCallum, R.C.; Browne, M.W.; Sugawara, H.M. Power analysis and determination of sample size for covariance structure modeling. Psychol. Methods 1996, 1, 130–149.
  33. Stern, E.; Krakover, S. The formation of a composite urban image. Geogr. Anal. 1993, 25, 130–146.
  34. Sarjono, H.; Julianita, W. Structural Equation Modeling (SEM); Salemba Empat: Jakarta, Indonesia, 2015; pp. 222–224.
More
This entry is offline, you can click here to edit this entry!