Skid Resistance in Road Transport: History
Please note this is an old version of this entry, which may differ significantly from the current revision.
Contributor:

Skid resistance is a significant feature that provides consistent traffic safety management for road pavements. An appropriate level of Skid resistance describes the contribution that the pavement surface makes to tire/road friction, and the surface of the road pavement can reduce vehicle operation cost, traffic accidents, and fatalities, particularly in wet conditions. Wet conditions decrease the level of the skid resistance (pavement friction), and this may lead to serious struggles related to driving on the road pavement (e.g., skidding or hydroplaning), which contributes to higher crash rates. The knowledge of skid resistance is essential to ensure reliable traffic management in transportation systems. Thus, a suitable methodology of skid resistance measurement and the understanding of the characterization of the road pavement are key to allow safe driving conditions.

  • skid resistance
  • infrastructure assessment
  • road friction
  • data analysis
  • interoperability
  • NDT
  • road sensors

1. Introduction of Skid Resistance

1.1. Background

Safe roads are essential to ensure the reliable movement of goods and people within the transport system. Multiple factors influence road collisions, which are usually grouped into three different categories, namely features related to drivers (e.g., stopping distance, driver skills and behavior of drivers, and vehicle speed), features related to the vehicle (e.g., tire and loading characteristics, vehicle design, and brake performance) and aspects corresponding to the roadway conditions (e.g., roadway geometry, traffic control measurement systems, and pavement conditions) [1]. Nevertheless, a remarkable relationship between accident rates and such aspects of pavement surfaces as friction and pavement texture has been investigated in previous studies [2][3][4]. The number of crashes was linked to the friction values of the road surface; a higher friction value was concluded, primarily based on empirical data, to decrease the number of accidents, particularly in dry conditions, [5]. Poor surfaces of pavements with low skid resistance, inadequate visibility due to the spray used in wet conditions, and insufficient friction between vehicle tires and the surface of the pavement may lead to uncontrolled skidding and cause severe traffic crashes within the transportation system [6]. Moreover, over 1.35 million people die and between 20 and 50 million are injured each year from different causes of road traffic crashes around the world according to the World Health Organization (WHO) and the authors of [7][8][9]. On the other hand, in Europe, around 23,400 persons die each year in road accidents: 45% of the fatalities are passenger car drivers or passengers, and 21% are pedestrians, according to the statistics provided in [2]. Traffic management studies indicate that 20% of traffic crashes are due to wet-weather conditions, which decrease the frictional resistance of the pavement surface [10][11]. The frictional resistance of the pavement surface is considered to be a fundamental feature of the driving task, which ensures the safe maneuvering of vehicles in both the longitudinal and transversal directions [12]. Another definition of skid resistance is the force generated when a tire is prevented from sliding in a circular manner on the pavement surface [13][14]. It is a crucial parameter among the characteristics of the pavement surface, and significantly influences the efficiency of the roadway traffic system. Pavement assessment is essential to provide valuable information related to friction value and can be considered as a supporting tool to deliver appropriate maintenance and repair procedures to ensure a safe roadway system in all weather conditions. Consequently, comprehensive knowledge of skid resistance prediction and pavement surface characteristics can lead, as a function of different roadway parameters, to a reliable traffic management system.

2. Factors Influencing Skid Resistance

Pavement friction is commonly defined as the force that resists the relative movements between a vehicle tire and the surface of the road pavement. Thus, skid resistance is generated due to the rolling or sliding of vehicle tires on the pavement surface [5][15]. Various factors can, directly and indirectly, influence the changes occurring in the skid resistance of the surface pavement. Table 1 shows a critical summary list of the main factors that affect the skid resistance of surface pavements.
Table 1. Factors affecting the pavement surface skid resistance (modified from [12][15]), grouped into 6 categories.
Road Surface Characteristics Traffic Conditions Vehicle Operations Road Users Tire Properties Environmental Conditions
1. Microtexture 1. Traffic load 1. Slip speed (SP) as a function of: 1. Lack of knowledge about skid resistance reduction Tread design and conditions 1. Temperature (°C)
2. Macrotexture 2. Traffic density 1.a. Vehicle speed, V 2. Inattention Inflation pressure 2. Water content;
3. Material characteristics 3. Congestion 1.b. Slip ratio % (G) 3. Applied conditions of road pavement due to extreme weather conditions Rubber configuration and rigidity 2.a. Rainfall
4. Megatexture   1.c. Braking System 4. Stopping distance Footprint 2.b. Condensation
5. Roughness/
unevenness
  1.d. Vehicle age 5. Driving manoeuvre Tire load 3. Snow and ice/freezing conditions
6. Geometric of pavements   1.e. Capacity of engine 5.a. Turning Tire temperature 4. Contamination
6.a. Curves   1.f. Suspension stability 5.b. Overtaking   4.a. Sand/dust
6.b. Slopes   1.g. Vehicle load     4.b. Salt
7. Temperature (°C)   1.h. Electronic stability control     4.c. Dirt
          d. Mud
          4.e. Organic materials
          4.f. Organic debris
          4.g. Rubber particles
          4.h. Wind
Note that critical factors in each category are presented in bold.
A summary of classified factors affecting skid resistance is presented in Table 1; these factors are classified into six categories that are related to the road pavement and vehicle operation, including traffic conditions, driver behavior, environment, and tire properties. Each is described in the following sections.

2.1. Category A: Pavement Surface Characteristics
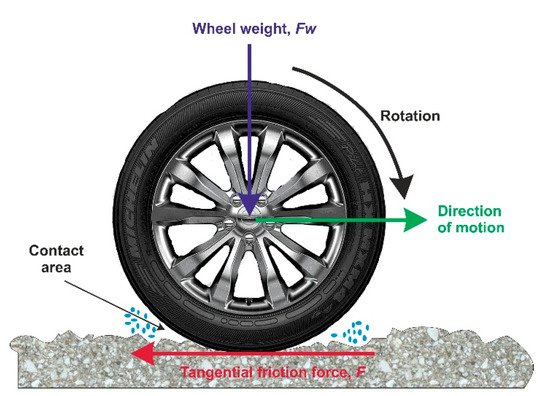
Skid resistance is a crucial parameter of the surface pavement, which can offer an efficient means of better understanding the road surface for traffic operation purposes. It is a measurement of friction obtained under specified, standardized conditions, and is intended to fix the values of potential variable factors so that the contribution that the pavement provides to tire/road friction can be isolated [16]. A non-dimensional friction coefficient can be calculated based on the pavement surface forces acting on the rotating wheels. The pavement surface friction coefficient requires the transmission of all of the forces related to a given maneuver under a given set of conditions, and is obtained as follows (see Figure 3 and Figure 4 for details of adhesion and hysteresis forces [5][15], and mathematical expression 1 below):
where µ is the non-dimensional friction coefficient, F is the tangential friction force between the tire tread rubber and the horizontal traveled surface and Fw is the perpendicular force or vertical load.
Figure 3. Typical sketch of forces acting on a rotating wheel (concept taken from [5][15]).
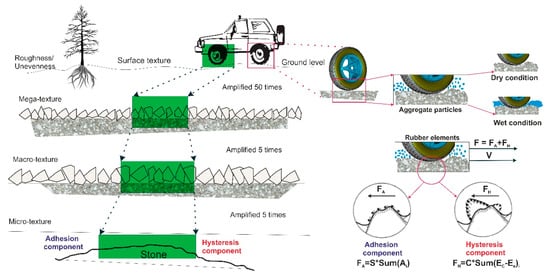
Figure 4. A typical schematic of the rubber-tire and pavement surface interaction components.
Theoretically, a complex interaction between tires and road pavements consists of two phenomena, such as molecular adhesion and hysteresis losses, and thus, the overall friction between the tire and the road surface is the sum of these two components [17][18]. Molecular adhesion is generated as a consequence of the shearing of molecular bonds (S) formed when the tire rubber is hard-pressed into a close contact area (Ai) with pavement surface particles (see Figure 4). Hysteresis losses are produced due to the energy dissipation of the deformed tire rubber when passing across the asperities of a rough pavement surface. The hysteresis losses relate to the energy that is stored (Ec) and dissipated (Ee) during tire–surface interaction for an acknowledged velocity (V) in that section. Thus, energy losses (C) happen during tire–surface interaction as the rubber is consecutively compressed and expanded. Generally, pavement surface adhesion friction decreases when the hysteresis losses increase [7][19][20]. These two components of skid resistance are related to the two key properties of road pavement surfaces: micro-texture and macro-texture (see Figure 4).
Friction phenomena are generated through the interaction of the tire and the road surface, even though there are several components in a roadway system that influence the friction mechanism. The pavement surface texture is a crucial characteristic, and it is based on the characterization of pavement asperities, specifically the grain roughness of the pavement mixture. The surface texture is a key parameter of the road surface, and it can include phenomena ranging from micro-level roughness to a span of unevenness stretching across the road surface [5][8][9][21]. Adequate use of the asphalt mix can increase friction, reduce water spraying and splashing, and abate noise. The scales of surface texture were defined in the XVII World Road Congress in Brussels in 1987 by the World Road Association (PIARC). Thus, the surface texture is divided into four categories as a function of the wavelength (λ) [20][21], and the amplitude (A) of the deviations (more details are given in Table 2), and each texture is explained separately. The two main levels of surface texture that predominantly affect the skid resistance are the micro-texture and the macro-texture [5][10]:
Table 2. Pavement texture classification according to the wavelength and amplitude (modified from [21]).
No. Level of Texture Wavelength, λ (mm) Amplitude, A (mm) Texture View
1 Micro-texture 0 < λ < 0.5 0.001 < A < 0.5 Remotesensing 13 03729 i001
2 Macro-texture 0.5 < λ < 50 0.1 < A <20 Remotesensing 13 03729 i002
3 Mega-texture 50 < λ < 500 1 < A <50 Remotesensing 13 03729 i003
4 Roughness or unevenness λ > 500 1 < A < 200 Remotesensing 13 03729 i004
  • Microtexture is a fine-scale texture characteristic that is based on the surface properties of the asphalt mix, which include its size and shape, as well as the gradient of the aggregate, and on the asphalt/bitumen materials used to generate molecular adhesion (see Figure 4). The microtexture depends on the roughness of the aggregate surface [22][23]. It is considered to be one of the main features that can affect the skid resistance on the pavement surface. The level of texture of the microtexture is assumed according to its wavelength (0 < λ < 0.5) (measured in mm) and its amplitude (0.001 < A < 0.5) [6].
  • Macrotexture is a larger (coarse) scale texture characteristic, which is based on the existence of voids between aggregate particles and takes into account the larger size, shape, and gradient of the coarse aggregate in the asphalt mix. The macrotexture is the main characteristic that produces a loss of hysteresis (see Figure 4). Water can escape from channels at the macrotexture level of the surface pavement, thus decreasing hydroplaning. This texture level is assessed according to its wavelength (0.5 < λ < 50) (measured in mm) and its amplitude (0.1 < A <20) [12][21].
Despite the significant influence of the microtexture and macrotexture on the generation of skid resistance, additional pavement surface textures are also very important pavement characteristics (i.e., megatexture and roughness (unevenness)), including the following:
  • Megatexture is a texture that corresponds to the irregularities (e.g., distress, defects, or waviness) associated with rutting, potholes, patching, surface stone loss, and major joints and cracks in the road surface [22][23][24]. The megatexture influences the noise level and the rolling resistance more than the skid resistance of the road pavements. The texture level considered in this category is (50 < λ < 500) and (1 < A <50) in terms of wavelength and amplitude, respectively [12][24].
  • Roughness (unevenness) is a larger texture than the megatexture, and it can also influence the rolling resistance as well as the driving quality and the operation costs of the vehicles. Computing the overall measure of the surface pavement condition is usually based on the International Roughness Index (IRI). This texture level is (λ > 500) for wavelength and (1 < A < 200) for amplitude [22][23]
Pavement texture properties are an essential feature in terms of understanding the tire-road interaction while taking into account various parameters (e.g., wet conditions, the age of the pavement, binder, noise, tire wear, rolling resistance, and splash or spray, and the geological properties of the aggregate). The aggregates represent approximately 90% (or more) of the bitumen mixture in weight and 95% of the total mix of pavement materials. For this reason, the level of influence of the aggregate characteristics (e.g., shape, angularity, abrasion, and hardness) on skid resistance is high. The role of the aggregate macrostructure is to induce the hysteresis force of the tire and to release water drainage in between the tire and the road pavement surface area. Furthermore, it is used to provide a microtexture that facilitates and maintains safe friction levels on the road surface [19][20]. Geometric elements of the roadway, such as grade and curvatures, can also influence the skid resistance [25]. Several research studies have been conducted to understand the polishing of aggregates, which is principally defined as an abrasion of the small particles of aggregate asperities (microtexture) that results from rubbing action that occurs after grinding and shearing caused by repeated traffic loadings. The polishing of aggregates is one of the most significant pavement texture properties that affect the functionality of the road surface, and it also affects the standard level of the road surface’s skid resistance. This can be measured by means of Polish Stone Value (PSV) to provide information on the resistance to the polishing action of the vehicle tires; this information is related to the conditions of the road surface [8][9][20][22].

2.2. Category B: Traffic Conditions

Traffic conditions are also considered to have the potential to slightly impact the skid resistance, particularly during various conditions of heavy traffic load and density, which can influence the behavior and comfort of road users during traffic congestion [12][26].

2.3. Category C: Vehicle Operation Conditions

Vehicle operation factors have a significant influence on skid resistance in traffic management systems. It is well-known that skid resistance decreases at higher vehicle speeds in wet pavement conditions. Generally, the relative contribution of the pavement surface (e.g., microtexture and macrotexture) changes due to the continuous variations in the vehicle speed. Water trapped between the tires and road pavement may escape, and the escape time is reduced due to an increase in the vehicle speed; for this reason, adequate skid resistance is mandatory to ensure a safe maneuver [12][13].
The slip speed is the relative speed based on the vehicle tire circumferences and the surface road pavement in the condition of free-rolling or constant-braked mode. A locked-wheel state corresponds to a 100% slip ratio, while a free-rolling state corresponds to a 0% slip ratio. The friction coefficient increases significantly, to a high value, in cases in which critical slippage reaches the range of 10% to 20%. The friction decreases to a value known as the sliding friction coefficient when the slippage reaches 100% [12][13][14][27][28][29][30][31][15] (see Table 2).
The braking system of the vehicle is an efficient factor in terms of mitigation when the skid resistance is decreased to an unfavorable value. In particular, new vehicles commonly use high-tech brake systems, namely Antilock brake systems (ABS). ABS can maintain the slip ratio at 15%, which increases the surface force of the road pavement to allow the vehicle to stop in a safe and reliable manner. Several other factors can influence the skid resistance of the surface pavement (e.g., the vehicle age, the capacity of the engine, the suspension stability, and the vehicle load are also important factors that can impact the stability of vehicles, particularly when moving along curves at high speeds).

2.4. Category D: Road Users Behaviour

Driver behavior is considered to be one of the key factors for traffic safety when skid resistance reaches a low level. Road user behavior could contribute to increasing accident rates due to a lack of knowledge about the reduction of skid resistance, inattention, vehicle conditions, overload, and the impact of weather changes on the conditions of road pavement surfaces [12][26].
Driver behavior during driving tasks is interrelated with other factors such as vehicle operation, road surface, and vehicle design. A basic knowledge of skid resistance is recommended for drivers (Table 3). Road user behavior changes during adverse weather conditions depending on experience and risk tolerance; some drivers may slow down when they come across wet weather conditions, but others may preserve or even increase vehicle speeds [14]. On the other hand, the stopping distance between vehicles is also correlated with the friction coefficient of the road pavement surface, and this is directly controlled by drivers based on the driving task conditions. The average stopping distance is considered to be 67 to 121 m for ribbed tires and 68 to 155 m for vehicles without ribbed tires [27].
Table 3. Possible actions to be taken into consideration for various road pavement conditions.
No. Pavement Condition Skid Resistance Vehicle Speed Additional Causes or Extreme Conditions Actions that Need to Be Taken by Road Users
1 Dry High Low Normal dry condition
  • Considered as a normal situation
2 Wet Low High Normal wet condition
  • Decrease the vehicle speed
  • Increase the stopping distance
3 Low High Tire age, or damaged tires (both wet and dry conditions)
  • Control the vehicle speed due to the high possibility of accidents
  • Decrease the vehicle speed
4 Low High Curves, steep hills, edges, and junctions (both wet and dry conditions)
  • The maneuver should be performed cautiously due to the increasing of the slip speed
  • Decrease the vehicle speed
  • Increase the stopping distance
5 Low High Snow or Ice
  • Perform driving tasks with caution and decrease the vehicle speed
  • Decrease the vehicle speed
  • Increase the stopping distance
7 Low High Contamination
  • Considered as unfavorable situation; park if needed
  • Increase the stopping distance
  • Decrease the vehicle speed
Considering that the exact limitations of vehicle speed can be used to determine the maximum design speed for traffic management, stopping distances, in various weather conditions (the most critical is in wet conditions), could be recommended through traffic management authorities as temporary or permanent recommendations to be considered by road users. These required actions will support advancements in road users’ and operators’ knowledge of the skid resistance of road pavements.

This entry is adapted from the peer-reviewed paper 10.3390/rs13183729

References

  1. AASHTO. Pavement Management Guide, 2nd ed.; AASHTO: Washington, DC, USA, 2012.
  2. Li, Q.J.; Zhan, Y.; Yang, G.; Wang, K.C.P. Pavement skid resistance as a function of pavement surface and aggregate texture properties. Int. J. Pavement Eng. 2020, 21, 1159–1169.
  3. Najafi, S.; Flintsch, G.W.; Khaleghian, S. Pavement friction management–artificial neural network approach. Int. J. Pavement Eng. 2019, 20, 125–135.
  4. Zhenning, L.; Yusheng, C.; Cong, C.; Guohui, Z.; Qiong, W.; Qian, Z.S.; Prevedouros, P.D.; Ma, D.T. Investigation of driver injury severities in rural single-vehicle crashes under rain conditions using mixed logit and latent class models. Accid. Anal. Prev. 2019, 124, 219–229.
  5. Åström, H.; Wallman, C.-G. Friction Measurement Methods and the Correlation between Road Friction and Traffic Safety. A Literature Review; Swedish National Rode and Transport Research Institute: Linköping, Sweden, 2001; p. 47.
  6. Ahammed, M.A.; Tighe, S.L. Asphalt pavements surface texture and skid resistance-Exploring the reality. Can. J. Civ. Eng. 2012, 39, 1–9.
  7. Snyder, M.B. Pavement Surface Characteristics a Synthesis and Guide; Skokie, A., Ed.; American Concrete Pavement Association: Skokie, IL, USA, 2006.
  8. Araujo, V.M.C.; Bessa, I.S.; Castelo Branco, V.T.F. Measuring skid resistance of hot mix asphalt using the aggregate image measurement system (AIMS). Constr. Build. Mater. 2015, 98, 476–481.
  9. Eurostat, 2018. Available online: https://ec.europa.eu/eurostat/statistics-explained/index.php?title=Road_accident_fatalities_-_statistics_by_type_of_vehicle (accessed on 9 September 2021).
  10. Ivan, J.N.; Ravishanker, N.; Jackson, E.; Aronov, B.; Guo, S. A Statistical Analysis of the Effect of Wet-Pavement Friction on Highway Traffic Safety. J. Transp. Saf. Secur. 2012, 4, 116–136.
  11. McGovern, C.; Rusch, P.; Noyce, D.A. State Practices to Reduce Wet Weather Skidding Crashes. U.S. Department of Transportation. 2011. Available online: https://rosap.ntl.bts.gov/view/dot/49268 (accessed on 9 September 2021).
  12. Pérez-Acebo, H.; Gonzalo-Orden, H.; Findley, D.J.; Rojí, E. A skid resistance prediction model for an entire road network. Constr. Build. Mater. 2020, 262, 120041.
  13. Highway Research Board. Skid Resistance. National Cooperative Highway Research Program. Synthesis of Highway Practice 14; Highway Research Board, National Academy of Sciences: Washington, DC, USA, 1972.
  14. Peng, Y.; Li, J.Q.; Zhan, Y.; Wang, K.C.; Yang, G. Finite Element Method-Based Skid Resistance Simulation Using In-Situ 3D Pavement Surface Texture and Friction Data. Materials 2019, 12, 3821.
  15. Hall, J.W. Guide for Pavement Friction; The National Academies Press: Washington, DC, USA, 2009.
  16. Kane, M.; Edmondson, V. Long-term skid resistance of asphalt surfacings and aggregates’ mineralogical composition: Generalisation to pavements made of different aggregate types. Wear 2020, 454, 203339.
  17. Cairney, P.T. ARRB Transport Research. In Skid Resistance and Crashes: A Review of the Literature; ARRB Transport Research, Limited.: Melbourne, Australia, 1997.
  18. Rith, M.; Kim, Y.K.; Lee, S.W. Characterization of long-term skid resistance in exposed aggregate concrete pavement. Constr. Build. Mater. 2020, 256, 119423.
  19. Pérez-Acebo, H.; Gonzalo-Orden, H.; Rojí, E. Skid resistance prediction for new two-lane roads. Proc. Inst. Civ. Eng. Transp. 2019, 172, 264–273.
  20. Khasawneh, M.A. Laboratory Study on the Frictional Properties of HMA Specimens Using a Newly Developed Asphalt Polisher. Int. J. Civ. Eng. 2017, 15, 1007–1017.
  21. Permanent International Association of Road Congresses (PIARC). Report of the Committee on Surface Characteristics. In Proceedings of the XVII World Road Congress, Brussels, Belgium, 13–19 September 1987.
  22. Jayawickrama, P.W.; Prasanna, R.; Senadheera, S.P. Survey of State Practices to Control Skid Resistance on Hot-Mix Asphalt Concrete Pavements. Transp. Res. Rec. 1996, 1536, 52–58.
  23. Widyatmoko, D.; Kingdom, U. The importance of Road Surface Texture in Active Safety Design and The Importance of Road Surface Texture in Active Road Safety Design and Assessment. In Proceedings of the International Conference Road Safety and Simulation (RSS2013), Rome, Italy, 22–25 October 2013.
  24. Meegoda, J.N.; Gao, S. Evaluation of pavement skid resistance using high speed texture measurement. J. Traffic Transp. Eng. 2015, 2, 382–390.
  25. Bazlamit, S.M.; Reza, F. Changes in asphalt pavement friction components and adjustment of skid number for temperature. J. Transp. Eng. 2005, 131, 470–476.
  26. Shafii, M.A. Skid Resistance and the Effect of Temperature; Universiti Teknologi Malaysia: Skudai, Malaysia, 2009.
  27. Rasol, M.A.; Pérez-Gracia, V.; Fernandes, F.M.; Pais, J.C.; Santos-Assunçao, S.; Santos, C.; Sossa, V. GPR laboratory tests and numerical models to characterize cracks in cement concrete specimens, exemplifying damage in rigid pavement. Measurement 2020, 158, 107662.
  28. Marecos, V.; Solla, M.; Fontul, S.; Antunes, V. Assessing the pavement subgrade by combining different non-destructive methods. Constr. Build. Mater. 2017, 135, 76–85.
  29. Rasol, M.A.; Pérez-Gracia, V.; Solla, M.; Pais, J.C.; Fernandes, F.M.; Santos, C. An experimental and numerical approach to combine Ground Penetrating Radar and computational modelling for the identification of early cracking in cement concrete pavements. NDT E Int. 2020, 115, 102293.
  30. Rasol, M. Development of New GPR Methodologies for Soil and Cement Concrete Pavement Assessment Mezgeen Abdulrahman Rasol Rasol; Polytechnic University of Catalonia (UPC): Barcelona, Spain, 2021.
  31. Rasol, M.A.; Pérez-Gracia, V.; Fernandes, F.M.; Pais, J.C.; Solla, M.; Santos, C. NDT assessment of rigid pavement damages with ground penetrating radar: Laboratory and field tests. Int. J. Pavement Eng. 2020, 1–16.
More
This entry is offline, you can click here to edit this entry!
Video Production Service