Your browser does not fully support modern features. Please upgrade for a smoother experience.
Please note this is an old version of this entry, which may differ significantly from the current revision.
Subjects:
Surgery
Helices are the most common secondary structural elements in many functional proteins and have attracted much interest when examining the formation kinetics from a coil structure. Measurements describing the timescale to a helix from a coiled structure have been substantially improved with the availability of spectrophotometers with a dramatically improved time resolution. Early studies showed that helix–coil transitions occur in the 100-nanosecond range with a model helix near room temperature.
- laser temperature jump
- molecular dynamics
- dimensionality reduction
- kinetics
1. Introduction
Formation of the functional form of a protein from initiation of a primary sequence and propagation through secondary structural elements is one of the most fundamental biochemical processes in biological systems. Understanding the mechanism of protein structure formation from its amino acid sequence [1,2,3,4,5,6,7,8,9,10,11,12,13,14,15] and predicting the three-dimensional structure from a given sequence [16,17,18,19,20,21,22,23,24,25,26,27,28,29,30,31,32,33,34,35,36] were two critical questions that attracted scientists from a variety of scientific fields. The quest for a solution to these intellectually challenging questions encouraged an interdisciplinary approach. Significant advances with new experimental approaches and the development of sophisticated theory have provided a much more detailed picture involving the complex pathway of structure formation through folding and the ability to predict three-dimensional structure [37,38]. Experimental studies to characterize the kinetics and thermodynamics of folding in the simplest systems have been very important in establishing a baseline for investigating more complex systems [38,39,40,41]. Experiments with dramatically improved time resolution have facilitated the use of fast kinetic measurements to study the relaxation dynamics of secondary structural elements and single-domain proteins in the sub-nanosecond to millisecond timescale [17,42,43,44,45,46]. These fast kinetic measurements have also been critical in providing a benchmark for a reality check of simulation studies. Analysis of all-atom molecular dynamics simulation results to study relaxation dynamics validated at an experimentally measured very short timescale can potentially provide an atomically detailed description of actual measured kinetic data [47,48,49,50]. Atomic-level descriptions strongly influence the microscopic picture of folding dynamics from molecular dynamics simulation results. It is essential to have measured timescales that can be readily compared with simulations. The advancement of theoretical studies with the energy landscape approach to protein folding was another driving force behind the development of fast-folding kinetic measurements [51,52,53,54,55,56]. Results from free energy surface calculations suggested that the barriers to protein folding should be quite small, and for the fastest folding proteins, the barrier may disappear altogether. This barrierless process may produce non-exponential kinetics, suggesting a non-two-state process during folding events. The relaxation dynamics of secondary structural elements, such as helix, hairpin, turn, and the associated timescale, can essentially capture the global structure formation pathway of a protein [44,57,58].
Helices are the most common secondary structural elements in many functional proteins and have attracted much interest when examining the formation kinetics from a coil structure. Measurements describing the timescale to a helix from a coiled structure have been substantially improved with the availability of spectrophotometers with a dramatically improved time resolution. Early studies showed that helix–coil transitions occur in the 100-nanosecond range with a model helix near room temperature. Ultrafast laser temperature jump spectroscopy has been used to measure the relaxation dynamics of helix formation in 5- to 21-residue and longer helical peptides with picosecond to microsecond resolution [42,43,44,45,46]. These newly measured kinetics with much faster time resolution have been able to identify new details in the helix formation pathway, such as non-exponential kinetic processes [50]. One of the more interesting experimental findings has been the detection of a stable helix formation in alanine-based homopolymers in solution at physiological pH [59]. An additional intriguing finding was obtained through measurement of the relaxation dynamics, previously unavailable, of a five-residue helix forming a heteropeptide with ultrafast laser t-jump, providing an important benchmark that can be easily compared with simulation times [45,46].
An extensive explanation of the approaches to modeling the helix–coil transition was described earlier [47]. A description of this biomolecular phenomenon involving statistical models [60] and the transition path was investigated earlier [61]. A true long-term molecular dynamics simulation can provide an atomically detailed description of kinetics events by extracting the rate of transitions and the nature of microscopic pathways and intermediates and can provide additional input to our theoretical understanding. Recent advancements in theory, more sophisticated algorithms, and a long-term trajectory made possible an atomistic description of kinetics and pathways and validation of experimental results, as well as describing new findings for a wide range of molecular processes [62,63,64,65,66,67,68,69,70,71,72,73].
2. Helix–Coil Kinetics
Helix–coil transitions have been studied experimentally and theoretically for nearly 60 years. In the late 1980s, many peptides comprising similar lengths and sequences found in proteins seemed to form stable helices in an aqueous environment. Since then, a large volume of equilibrium experiments and theoretical studies have been devoted to investigating the formation mechanism of a-helices in the steady state. Alanine-based peptides formed the backbone of these studies as they have a higher propensity to form helices. Kinetic studies, primarily with a 21-residue alanine-based peptide with an attached fluorescent probe at the N-terminus (X-(A)5 (A3RA)3-A-NH2), were performed with a nanosecond laser temperature jump apparatus [43]. The result was inclusive with the presence of an unexplained observed kinetic component. This observation prompted further experiments to understand helix–coil transition kinetics with an improved a-helical heteropeptide Ac-WA3H(A3RA)3-A-NH2, where the first turn of helix formation was monitored via quenching of tryptophan (W) fluorescence by a protonated histidine (H) residue four residues away [44]. Laser t-jump in the nanosecond to microsecond timescale was employed to measure structure formation rates and extract insights into the helix–coil transition pathway after initiation of the temperature jump. At the final temperatures after the jump, measured kinetic traces showed distinct non-exponential kinetics with a fast component clearly above the instrument time resolution of six nanoseconds (Figure 1A–C). Comparison of a single and a bi-exponential fit to the measured data showed that the bi-exponential fit (orange) could completely describe the kinetics instead of the single exponential fit (green). Analysis of the log of rates vs. 1/T showed a nonlinear process (Figure 1D), indicating a deviation from a two-state kinetic process. These experimental observations established the groundwork for the possible presence of intermediates along the transition pathway with the presence of faster kinetic components in this α-helical system. They also prompted an important question of whether these species, when transitioning from coil to helix through the formation of intermediates, lie in a homogeneous or heterogeneous state, pointing to the possible existence of multiple pathways along the transition pathways.
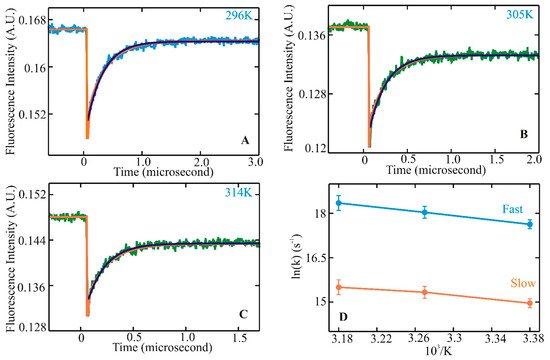
Figure 1. Helix–coil kinetics measured for WH210 following laser t-jumps. Kinetic traces following relaxation dynamics at final temperatures of 296 (A), 305 (B), and 314 K (C). Tryptophan fluorescence intensity change is plotted against the change in time. The single exponential fit to the data is shown in green. The bi-exponential fit to the measured kinetic trace is represented in orange for WH21 at 296, 305, and 314 K. The WH21 concentration in the measured sample is ~100 μM. Kinetic rates in Arrhenius form, ln(k) vs. 1/T, are shown in (D), where the solid blue line represents the fast component, and the slower component is in orange [78].
This entry is adapted from the peer-reviewed paper 10.3390/biom11091351
This entry is offline, you can click here to edit this entry!