Antibiotic resistance is becoming one of the main problems of modern medicine since it substantially reduces the effectiveness of antibacterial treatments and is linked to increased patient mortality. As a result, known antibacterial preparations cease to be safe and effective against infections caused by resistant bacteria, leading to increasingly serious cases, including hospital-acquired complications. This requires the discovery of new classes of antibiotics or optimization and a combination of known compounds. However, microorganisms will likely evolve resistance in time and further research and development may be hard to sustain by the pharmaceutical companies. For this reason, studies are being conducted to identify effective remedies against multidrug-resistant strains. Preference is given to natural products among which are the essential oils [
]. Still, information about the antimicrobial activity of residual water and ethanolic extracts is very scanty and is mainly related to Lavander hydrosol, which is produced synthetically [
].
2.1. Chemical Composition of Lavender Essential Oils
The essential oil manufactured by producer P1, destined for export, had the following physico-chemical properties: Density (20 °C)—0.8920 g/mL; refractive index (n20D)—1.4660, and optical rotation (α20D)— −7.0°.
The most multitudinous group of terpenic compounds are monoterpenes, which include C
10-hidrocarbones (8.72–15.32%) and their oxygenated derivatives (69.0–83.83%). The main constituents of this group which determine the quality and genuineness of lavender essential oil, according to the International Standard [
48], are (%): 1,8-cineol (eucalyptol) (<1.0), (
E)-ocimene (4.0–10.0), (
Z)-ocimene (1.5–6.0), linalool (25.0–38.0), camphor (<0.5), terpin-1-en-4-ol (2.0–6.0),
α-terpineol (<1.0), linalyl acetate (25.0–45.0), and lavandulyl acetate (>2.0) (
Table 1 and
Table 2).
Table 1. Phytochemical (terpenic and aliphatic compounds) composition of lavender essential oil of Moldovan origin.
| No. |
RT*
(min) |
Component |
Producer, Content (%) |
| P1 |
P2 |
P3 |
P4 |
P5 |
P6 |
P7 |
| 1 |
4.416 |
α-Pinene |
0.36 |
0.57 |
0.36 |
0.18 |
0.09 |
0.26 |
0.57 |
| 2 |
4.710 |
Camphene |
0.34 |
0.47 |
0.30 |
0.09 |
0.09 |
0.26 |
0.63 |
| 3 |
5.179 |
Sabinene |
0.14 |
- |
- |
- |
- |
- |
- |
| 4 |
5.240 |
1-Octen-3-ol |
|
0.83 |
- |
- |
- |
0.15 |
0.27 |
| 5 |
5.263 |
β-Pinene |
0.51 |
- |
0.34 |
0.39 |
0.38 |
0.22 |
0.57 |
| 6 |
5.398 |
Octan-3-one |
0.28 |
0.51 |
0.31 |
0.25 |
0.39 |
0.12 |
0.21 |
| 7 |
5.489 |
β-Myrcene |
1.06 |
1.50 |
0.96 |
0.80 |
0.89 |
0.62 |
0.89 |
| 8 |
5.577 |
Octan-3-ol |
0.13 |
0.18 |
0.20 |
0.17 |
0.20 |
- |
- |
| 9 |
5.962 |
n-Hexyl acetate |
0.59 |
1.27 |
0.31 |
0.42 |
0.55 |
0.52 |
1.17 |
| 10 |
6.284 |
p-Cymene |
0.22 |
0.46 |
0.22 |
0.14 |
0.10 |
0.24 |
0.39 |
| 11 |
6.400 |
Limonene |
0.52 |
1.79 |
0.79 |
0.45 |
0.55 |
1.17 |
1.93 |
| 12 |
6.455 |
1,8-Cineol (eucalyptol) |
5.00 |
3.81 |
2.22 |
3.73 |
4.44 |
3.83 |
9.29 |
| 13 |
6.574 |
(E)-Ocimene |
8.06 |
5.87 |
6.85 |
7.86 |
4.37 |
5.25 |
7.15 |
| 14 |
6.807 |
(Z)-Ocimene |
3.74 |
3.45 |
2.59 |
2.55 |
1.86 |
1.76 |
2.16 |
| 15 |
7.087 |
γ-Terpinene |
0.10 |
0.29 |
0.29 |
0.06 |
0.07 |
0.07 |
0.15 |
| 16 |
7.443 |
Linalool oxide |
- |
0.17 |
0.07 |
0.11 |
0.12 |
- |
- |
| 17 |
7.824 |
δ-Terpinene |
0.27 |
- |
- |
- |
- |
- |
- |
| 18 |
7.825 |
α-Terpinolene |
- |
0.58 |
0.25 |
0.21 |
0.32 |
0.16 |
0.23 |
| 19 |
8.238 |
Linalool |
23.54 |
27.98 |
29.06 |
25.57 |
40.68 |
33.29 |
26.19 |
| 20 |
8.392 |
Oct-1-en-3-yl acetate |
0.56 |
0.82 |
0.60 |
0.71 |
0.63 |
0.39 |
0.58 |
| 21 |
9.308 |
Camphor |
0.47 |
0.47 |
0.37 |
0.36 |
0.30 |
0.32 |
0.61 |
| 22 |
9.847 |
Borneol |
1.92 |
2.15 |
1.68 |
1.28 |
1.65 |
1.41 |
2.40 |
| 23 |
10.00 |
(3E,5Z)-Undeca-1,3,5-triene |
0.17 |
- |
- |
- |
- |
- |
- |
| 24 |
10.15 |
Terpin-1-en-4-ol |
1.30 |
4.65 |
5.98 |
0.94 |
1.67 |
1.41 |
1.03 |
| 25 |
10.41 |
Cryptone |
0.29 |
0.29 |
- |
- |
- |
0.30 |
0.33 |
| 26 |
10.50 |
α-Terpineol |
2.42 |
3.31 |
2.02 |
1.42 |
7.95 |
1.49 |
1.61 |
| 27 |
11.49 |
Nerol |
0.38 |
0.46 |
0.23 |
0.14 |
1.14 |
- |
- |
| 28 |
11.84 |
p-Cumic aldehyde |
0.13 |
0.15 |
- |
- |
- |
0.18 |
- |
| 29 |
12.32 |
Linalyl acetate |
26.55 |
20.26 |
28.65 |
32.25 |
16.68 |
33.30 |
28.10 |
| 30 |
13.01 |
Bornyl acetate |
0.32 |
0.25 |
0.24 |
0.27 |
0.19 |
0.17 |
0.24 |
| 31 |
13.11 |
Lavandulyl acetate |
4.88 |
2.84 |
2.36 |
4.83 |
4.78 |
2.56 |
3.07 |
| 32 |
14.98 |
Neryl acetate |
0.78 |
0.91 |
0.39 |
0.33 |
1.53 |
0.31 |
0.37 |
| 33 |
15.47 |
Geranyl acetate |
1.31 |
1.69 |
0.79 |
0.73 |
2.70 |
0.59 |
0.67 |
| 34 |
15.66 |
α-Zingiberene |
0.15 |
- |
- |
- |
- |
- |
- |
| 35 |
16.47 |
β-Caryophyllene |
6.25 |
5.33 |
4.62 |
5.44 |
1.64 |
4.93 |
4.32 |
| 36 |
16.80 |
α-Bergamotene |
0.27 |
0.28 |
0.19 |
0.20 |
0.05 |
0.16 |
- |
| 37 |
17.31 |
(E)-β-Farnesene |
4.86 |
2.59 |
3.65 |
3.94 |
1.23 |
2.46 |
2.45 |
| 38 |
17.97 |
β-Cubebene |
1.12 |
0.82 |
1.03 |
0.69 |
0.17 |
- |
- |
| 39 |
18.75 |
γ-Cadinene |
0.18 |
0.53 |
- |
- |
- |
0.68 |
0.65 |
| 40 |
20.39 |
Caryophyllene oxide |
0.45 |
0.69 |
0.19 |
0.29 |
0.21 |
0.35 |
0.28 |
| 41 |
21.69 |
Cadinol |
0.17 |
0.57 |
- |
- |
- |
0.18 |
- |
| Total content, (%) |
99.80 |
98.79 |
98.17 |
96.80 |
97.62 |
99.11 |
98.51 |
The content of sesquiterpene hydrocarbons and their oxygenated derivatives is reported to be within the limits of 3.09–12.83% and 0.19–1.26%, respectively. According to the same source [
48], the most important sesquiterpenes are:
β-caryophyllene (4.78%), (
E)-
β-farnesene (1.52%), and caryophyllene oxide (0.36%) (
Table 1 and
Table 2).
Aliphatic compounds are of lesser concentration (1.42–3.90%) and in [
48] are mentioned: 1-octen-3-ol (0.33%) and octan-3-one (<2.0%) (
Table 1 and
Table 2).
2.3. Chemical Composition of Lavender by-Products
The GC-MS analysis of etheric extracts of residual water (RW) proved that they contain hydrophilic monoterpenic compounds such as 1,8-cineol (eucalyptol, 6.31%), linalool oxide (3.08%), linalool (78.05%), terpin-1-en-4-ol (1.92%), and α-terpineol (10.64%).
HPLC quantification of UA and OA indicated that RWs did not contain OA and UA triterpene acids.
In the case of solid waste residues (SR), the average extraction yield was about 3.91%, with the OA content between 27.48–39.37 mg/g and UA content between 80.82–135.56 mg/g (
Table 4). The isomeric OA and UA in DW SR ranged between 113.47–144.98 and 313.95–499.15 mg/100 g, respectively (
Table 4), with their amount accounting to about 1% of DW, in a 1:3.1 ratio, indicating that lavender by-products are a promising source of OA and UA triterpene acids.
Table 4. The OA and UA content of lavender by-product (solid waste residue), (DW).
| Lavender by-Product (Solid Residue, SR) |
Extract Yield (%) |
Concentration
(mg/g Extract) |
Concentration
(mg/100 g Dry Solid Residue) |
| OA |
UA |
OA |
UA |
| SR 1 |
3.88 |
29.21 |
80.82 |
113.47 |
313.95 |
| SR 2 |
3.68 |
39.37 |
135.56 |
144.98 |
499.15 |
| SR 3 |
4.15 |
27.48 |
87.90 |
114.07 |
364.89 |
Our results are consistent with other literature data reporting DW of lavender SR values between 136.0–259.7 and 346.3–648.4 mg/100 g [
49].
2.4. Antimicrobial Assessments
Phytopathogenic bacteria can cause various diseases of agricultural plants, especially the genera Erwinia and Xanthomonas. For example,
Erwinia amylovora, the Gram-negative bacterium of the Enterobacteriaceae family, is the causative agent of fire blight, a devastating plant disease that affects a wide range of species of the family Rosaceae and is a major global threat to commercial apple and pear production. [
50]. Another species,
E. carotovora, causes bacterial soft rot in economically important crops, such as potatoes, tomatoes, and cucumbers. In the case of potatoes, the soft rot of the stem and tubers occurs even after harvest, thus considerably reducing the yield [
51].
Xanthomonas campestris pv.
vesicatoria is a biotrophic Gram-negative bacterium and is the agent that causes bacterial leaf scorch on tomatoes (
Solanum lycopersicum L.) and peppers (
Capsicum annuum), a disease that is present worldwide. Symptoms of bacterial infection include defoliation and chlorotic necrotic lesions on leaves, stems, fruits, and flowers, which subsequently lead to reduced fruit yield [
52].
The species Bacillus subtilis and Pseudomonas fluorescens do not cause any disease to plants but were selected as reference bacteria from the Gram-positive and Gram-negative groups. They are also very suitable as test objects for evaluating the antibacterial activity of the lavender extract. Candida utilis and Saccharomyces cerevisiae are also non-pathogenic but were used as representatives of the yeast-fungus group for evaluating the antifungal activity of the extract.
It should be mentioned that there is a lack of information about any antimicrobial effects of lavender essential oil on E. carotovora, E. amylovora, and C. utilis.
The in vitro assessment of lavender essential oil of Moldovan origin showed good antibacterial activity against both non-pathogenic Gram-positive/Gram-negative bacteria (
B. subtilis and
P. fluorescens) at MBC of 300 μg/mL and good to high antifungal activity against phytopathogenic bacteria (
X. campestris,
E. amylovora,
E. carotovora) and
C. utilis fungi at MFC of 150–300 μg/mL (
Table 5).
Table 5. The antimicrobial activity of lavender essential oil.
| MBC and MFC, μg/mL |
| Sample |
Bacillus
subtilis |
Pseudomonas
fluorescens |
Xantdomonas
campestris |
Erwinia
amylovora |
Erwinia
carotovora |
Candida
utilis |
| LEO |
300 |
300 |
300 |
150 |
300 |
150 |
The highest antifungal and antibacterial activities were observed for residual water (RW) at 0.08 and 0.125 μg/mL, respectively. Good antifungal and antibacterial activities were ascertained for the SR extract as well (0.50 and 4 μg/mL). The LPM extract showed moderate antifungal and antibacterial activity (0.75 and 6 μg/mL).
The two techniques employed for testing both the disc diffusion and the dilution methods have been developed to yield accurate measurements of antibacterial and antifungal activities and are routinely used in antimicrobial susceptibility testing.
According to the obtained results, the antibacterial activity was similar but the antifungal activity was slightly different, thus suggesting that the activity against different microorganisms could be caused by different components of the oil.
2.5. Statistical Data Analysis
Univariate as well as multivariate statistical data analysis (SDA) represent one of the most reliable methods that permit extracting useful information and inferring different hypotheses concerning the considered set of data. Given the great diversity of organic compounds which can be found in lavender essential oil, multivariate statistical data analysis was an appropriate method allowing to group samples, in this case, according to the lavender oil producer and based on the concentrations of organic compounds (R mode), or, to classify an experimentally determined organic compound based on the concentration in samples (Q mode) [
53,
54].
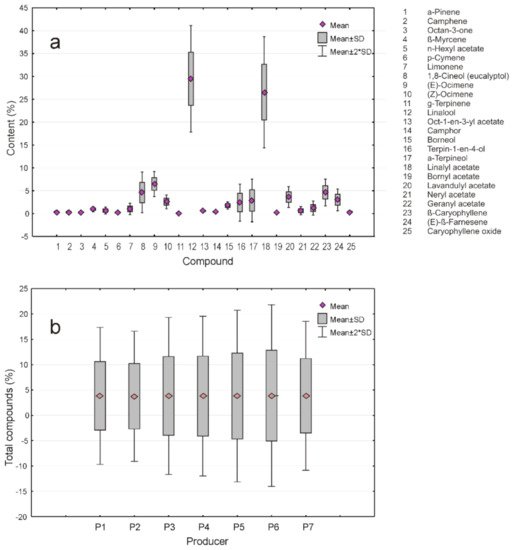
It is worth mentioning that, to avoid any errors induced by missing data, SDA was applied only in the cases of compounds with a non-negligible variation present in all the samples (Table 1), i.e., the compounds which permitted generating the box plots in Figure 1a,b.
Figure 1. Box plots representing the distribution of (a) 25 components of lavender oil and (b) total content of compounds present in all the samples (producers).
Univariate SDA was useful in establishing the extent to which the samples of lavender oil by the seven producers were similar. This information was obtained by analyzing the box plot shown in Figure 1a. It was observed that all the samples were quite similar. To confirm this, we used more univariate tests, such as one-way ANOVA, Tukey’s pairwise test, Kruskal-Wallis test of equal medians, as well as Mann-Whitney U tests. All of them confirmed that between the lavender oil samples there are no statistically significant differences. For this reason, we have proceeded with multivariate SDA.
Within multivariate SDA, each sample (case) is characterized by independent parameters (variables), so that the final analysis can be performed in R mode (to study relations between samples based on variables) or Q mode (to study the interrelations between variables based on samples). As both methods were based on the same set of samples and variables, R and Q modes could be considered complementary, which significantly enhanced the analysis.
Depending on the situation, cases/variables can be grouped by a multitude of procedures among which covariance and correlation are frequently utilized.
In the case of lavender samples, the best results were obtained by the principal component analysis (PCA) applied in both R and Q modes. With respect to the other two SDA methods, cluster analysis and K mean clustering, PCA permitted evidencing the association of samples, i.e., seven producers of lavender oil in R mode, as well as 25 lavender oil compounds in Q mode. Moreover, in R mode, a tree diagram corresponding to the cluster analysis (Euclidean distances) is, concerning the number and structure of clusters, similar to PCA based on correlation. For this reason, we restrained our SDA to both R and Q mode PCA.
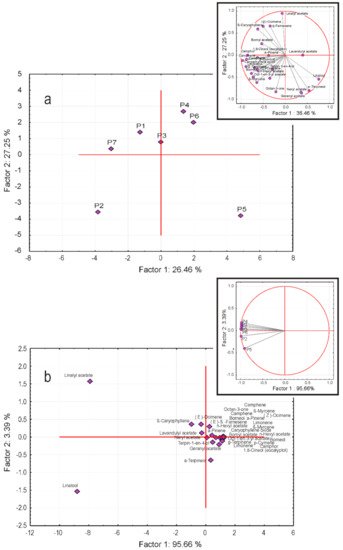
The results, represented by the principal component (PC) 2 vs. PC 1 bi-plots, are illustrated in Figure 2a,b, respectively. In both cases, the PCA was based on correlations between variables (organic compounds, R mode) or samples (lavender oil producer, Q mode). Moreover, the loadings of each variable or sample were represented by Factor 2 vs. Factor 1 bi-plots in the corresponding insets: Variables in Figure 2a and samples in Figure 2b.
Figure 2. The results of R (a) and Q (b) mode PCA. The insets illustrate the contribution of the corresponding principal component (PC) analysis.
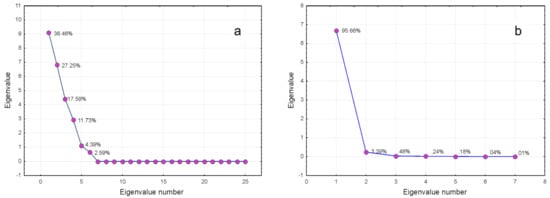
Accordingly, the result of PCA in R mode is illustrated by the bi-plot in Figure 1a. The existence of at least three clusters can be remarked, two of which consist of only one member, i.e., producers P2 and P5, and a third one, grouping the rest of the producers. The bi-plot illustrating the contribution of each compound to the PC1 and PC2 showed a relatively balanced situation, as both Factors 1 and 2 had similar contributions to PC, consisting of 36.46 and 27.25%, respectively. It is worth mentioning that a similar result was obtained by considering the PC3 vs. PC2, which most probably could be explained by their contribution to the total variance, 25.25 and 17.57%, respectively. The corresponding screen plot in Figure 3a illustrated this finding.
Figure 3. The screen plots corresponding to R-mode (a) and Q-mode (b) PCA.
Complementary to the R-mode, a Q mode PC2 vs. PC1 bi-plot, shown in Figure 2b, consisted of three clusters, two of which contained a single organic compound, i.e., linalyl acetate and linalool, while the third one included all other 23 compounds. This result was in good agreement with the composition of the investigated samples, according to which, both linalyl acetate and linalool were characterized by the highest concentrations and variances.
On the contrary, Factor 2 vs. Factor 1 (Figure 2b, inset), except for Producers 2 (P2) and 5 (P5), were nearly coincident and negatively oriented along the first axis, which suggested an almost equivalent contribution to the total variance. This finding may explain the fact that PC1 contributed about 96% to the total variance, as shown in the corresponding screen plot (Figure 3b). In this regard, it is of interest to remark, as mentioned before, that P2 and P5 formed two different uni-component clusters (Figure 2b).