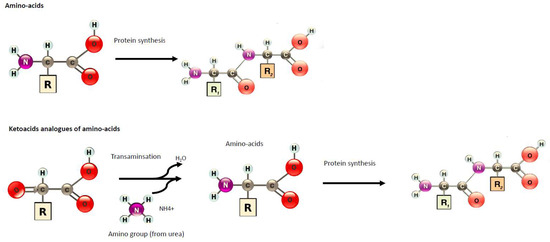
Diet is a key component of care during chronic kidney disease (CKD). In order to reduce the risk of nutritional disorders in very-low protein diets (VLDP), supplementation by nitrogen-free ketoacid analogues (KAs) have been proposed.
- chronic kidney disease
- low protein diet
- ketoacid analogues
- intestinal microbiota
- dialysis
1. Introduction
|
Component Name |
mg/pill |
|---|---|
|
Ca-Keto-dl-isoleucine |
67 |
|
Ca-Ketoeucine |
101 |
|
Ca-Ketophénylalanine |
68 |
|
Ca-Ketovaline |
86 |
|
Ca-Hydroxy-dl-methionine |
59 |
|
l-Lysine monoacetate |
105 |
|
l-Threonine |
53 |
|
l-Tryptophan |
23 |
|
l-Histidine |
38 |
|
l-Tyrosine |
30 |
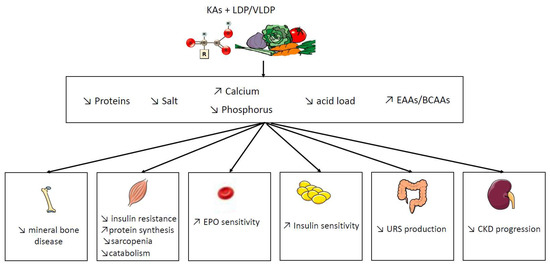
2. Potential Benefit of Ketoacid Analogues
|
Study |
Models |
Diet Intervention |
Follow-Up |
Results (LPD vs. VLDP/LPD + KAs) |
|---|---|---|---|---|
|
Wang et al., 2018 [7] |
5/6 nephrectomy rats |
NPD: 22% protein vs. LPD: 6% protein vs. LPD + KAs: 5% protein plus 1% KA |
24 weeks |
↓ muscle atrophy ↑ activities of mitochondrial electron transport chain complexes and mitochondrial respiration, ↓ muscle oxidative damage ↑body weight |
|
Liu et al., 2018 [8] |
KKAy mice, an early type 2 DN model |
NPD: 22% protein vs. LPD: 6% protein vs. LPD + KAs: 5% protein plus 1% KA |
12 weeks |
↓ proteinuria ↓ mesangial proliferation and oxidative stress ↑ serum albumin and body weight No difference in creatinine and GFR |
|
Zhang et al., 2016 [9] |
3/4 nephrectomy rats |
NPD: 18% protein vs. LPD: 6% protein vs. LPD + KAs: 5% protein plus 1% KA |
12 weeks |
↓ proteinuria ↓ intrarenal RAS activation. ↓ transforming growth factor-β1 in the mesangial cells |
|
Zhang et al., 2015 [10] |
5/6 nephrectomy rats |
NPD: 11 g/kg/day protein vs. LPD: 3 g/kg/day protein vs. LPD + KAs: 3 g/kg/day protein which including 5% protein plus 1% KA |
24 weeks |
↑ body weight, gastrocnemius muscle mass ↓ autophagy marker in muscle No difference of inflammation markers |
|
Wang et al., 2014 [11] |
5/6 nephrectomy rats |
NPD: 22% protein vs. LPD: 6% protein vs. LPD + KAs: 5% protein plus 1% KA |
24 weeks |
↑improved protein synthesis and increased related mediators such as phosphorylated Akt in the muscle ↓ protein degradation and proteasome activity in the muscle |
|
Gao et al., 2010 [12] |
5/6 Nephrectomy rats |
NPD: 22% protein vs. LPD: 6% protein vs. LPD + KAs: 5% protein plus 1% KA |
24 weeks |
↓ proteinuria, glomerular sclerosis, and tubulointerstitial fibrosis ↑renal function ↑ body weight and albumin ↓ lipid and protein oxidative products |
|
Gao et al., 2011 [13] |
5/6 Nephrectomy rats |
NPD: 22% protein vs. LPD: 6% protein vs. LPD + KAs: 5% protein plus 1% KA |
6 months |
↑ body weight and albumin ↑ Kruppel-like factor-15, a transcription factor shown to reduce fibrosis |
|
Maniar et al., 1992 [14] |
5/6 Nephrectomy rats |
NPD: 16% casein vs. LPD + EAA: 6% casein + EAA vs. LPD + KAs: 6% casein + KA |
3 months |
No difference on body weight No difference on proteinuria vs. LDP + EAA but reduction vs. NPD ↓ creatinemia, proteinuria, glomerular sclerosis, and tubulointerstitial fibrosis vs. NPD but no difference vs. LPD + EAA ↑survival vs. NPD but no difference vs. LPD + EAA |
|
Laouari et al., 1991 [15] |
5/6 Nephrectomy rats |
NPD: 12% casein vs. LPD + EAAs: 5% casein + EAA vs. LPD + KAs: 5% casein + KA |
↓Appetite and growth No increase in BCAAs |
|
|
Benjelloun et al., 1993 [16] |
Rats with after a single 5 mg/kg intravenous injection of Adriamycin: a model of induces glomerular damage in glomerulonephritis. |
NPD: 21% protein vs. LPD + KAs: 6% protein plus KA |
15 days |
↓ proteinuria ↓ glycosaminoglycan excretion and glomerular glycosaminoglycan contents |
|
Barsotti et al; 1988 [17] |
5/6 Nephrectomy rats |
NPD: 20.5% protein vs. LPD + KAs: 3.3% protein plus 7.5% KA |
3 months |
↑survival ↑ GFR ↓ proteinuria and histological damage of kidney No difference in body weight and albuminuria |
|
Meisinger et al., 1987 [18] |
5/6 Nephrectomy rats |
LPD: 8% protein vs. LPD + KAs: 8% protein plus KA |
3 months |
↓ proteinuria |
|
Study |
Design of Study |
Diet |
Follow-Up |
Results |
Comments |
|---|---|---|---|---|---|
|
Milovanova et al., 2018 [2] |
RCT n = 42 in LPD + KA vs. LPD n = 37 Non-diabetic CKD 3B–4 |
LPD (0.6 g/kg of body weight/day, comprising 0.3 g of vegetable protein and 0.3 g of animal protein, phosphorus content ≤ 800 mg/day and calories: 34–35 kcal/kg/day) vs. LPD + KA: 0.6 g/kg of body weight/day |
14 months |
↑ eGFR (29.1 L/min/1.73 m2 vs. 26.6) ↓SBP ↑BMI and muscle body mass NO change in albumin levels No change in lipids parameters ↓ phosphate, FGF23, and PTH levels ↑Klotho levels and phosphate binder uses ↑bicarbonates levels |
Similar protein intake in both group Long follow up |
|
Di Iorio et al., 2018 [19] |
RCT, crossover trial CKD stages 3B–4 Group A1: 3 months of FD, 6 months of VLPD + KA, 3 months of FD and 6 months of MD Group B: 3 months of FD, 6 months of MD, 3 months of FD and 6 months of VLPD + KA. n = 30 in each group |
FD: proteins 1 g/kg body weight (bw)/day (animal proteins 50–70 g/day, vegetal proteins 15–20 g/day), energy 30–35 kcal/bw/day, calcium (Ca) 1.1–1.3 g/day, phosphorus (P) 1.2–1.5 g/day, sodium (Na) 6 g/day and potassium (K) 2–4 g/day. MD: proteins 0.7–0.8 g/kg bw/day (animal proteins 30–40 g/day, vegetal proteins 40–50 g/day), energy 30–35 kcal/bw/day, Ca 1.1–1.3 g/day, P 1.2–1.5 g/day, Na 2.5–3 g/day and K 2–4 g/day. VLPD + KA: proteins 0.3–0.5 g/kg bw/day (animal proteins 0 g/day, vegetal proteins 30–40 g/day), energy 30–35 kcal/bw/day, Ca 1.1–1.3 g/day, P 0.6–0.8 g/day, Na 6 g/day, K 2–4 g/day plus a mixture of KA |
6 months |
↓ SBP No change in creatinuria ↓proteinuria ↓ phosphate, FGF23, and PTH levels ↑bicarbonates levels ↑Hg levels ↓protein carbamylation |
Sodium intake and phosphore intake was reduce in VLDP + KA group |
|
Garneata et al., 2016 [20] |
RCT CKD stage 4–5, proteinuria < 1 g/24 h n = 207 |
LPD = 0.6 g protein/kg per day vs. VLPD + KA = vegetarian diet, 0.3 g protein/kg per day + KA |
15 months |
↓ RRT initiation or a >50% reduction in the initial GFR (13% in KA+LDP vs. 42% in LPD reached the primary composite efficacy point i.e., RRT initiation or a >50% reduction in the initial GFR) ↓CRP ↑bicarbonates levels ↓uric acid ↓ phosphate, FGF23 and PTH levels and phosphate binder uses No difference in proteinuria No difference of death and CV events No difference of albumin, BMI No change in lipids parameters |
Long follow up Large effective Only 14% of patients screened was included |
|
Di Iorio et al., 2012 [21] |
RCT, crossover trial eGFR < 55 and > 20 mL/min/1.73 m2 Group A: VLDP + KA during the first week and LPD during the second week Group B: LPD during the first week and a VLPD + KA during the second week. n = 16 in each group |
LPD = 0.6 g protein/kg per day vs. VLPD + KA = 0.3 g protein/kg per day + KA |
1 week |
↓ phosphate (−12%), FGF23 (−33.5) No change on calcium a post hoc of this study, ↓ indoxyl sulfate [22] ↑bicarbonates levels |
Short exposition |
|
Di Iorio et al., 2009 [23] |
RCT, crossover trial eGFR < 55 and > 20 mL/min Group A: VLDP + KA during 6 month and a LPD during 6 month Group B: LPD during 6 month and a VLDP + KA during 6 month. n = 16 in each group 32 patients |
LPD = 0.6 g protein/kg per day vs. VLPD + KA = 0.3 g protein/kg per day + KA |
6 months |
↓proteinuria and AGE |
Open label Phosphor intake was different and lower in VLDP+ KA |
|
Menon et al., 2009 [24] |
Post hoc study of MDRD study B CKD stage 4 nondiabetic n = 255 |
LPD = 0.6 g protein/kg per day vs. VLPD + KA = 0.3 g protein/kg per day + KA |
10.2 years |
No delay progression to kidney failure ↑the risk of death. |
Long follow up without intervention -Observance and protein intake was not monitored during the follow up |
|
Teplan et al., 2008 [3] |
RCT, double-blind placebo CKD stage 4 n = 111 |
LDP: 0.6 g protein/kg per day vs. LPD + KA: 0.6 g protein/kg per day + KA |
36 months |
↓ADMA ↓ BMI and visceral body fat in obese patients ↓proteinuria ↓ glycated hemoglobin ↓LDL-cholesterol |
Mean BMI was > 30 kg/m2 at the inclusion Long follow up No difference of protein intake Using a placebo |
|
Mircescu et al., 2007 [25] |
RCT eGFR <30 mL/min/1.73 m2, nondiabetic n = 53 |
VLPD + KA =0.3 g/kg vegetable proteins + KA vs. LPD =0.6 g/kg/d) |
48 weeks |
↑bicarbonates levels ↑calcium levels and ↓ phosphate lower percentages of patients in group I required renal replacement therapy initiation (4% vs. 27%). No change of rate of eGFR and proteinuria No change in SBP |
Open label |
|
Gennari et al., 2006 [26] |
Post hoc study of MDRD study RCT CKD stage 4–5 n = 255 |
LPD = 0.6 g protein/kg per day vs. VLPD + KA = 0.3 g protein/kg per day + KA |
2,2 years |
No significant effect of diet on serum total CO2 was seen |
|
|
Menon et al., 2005 [27] |
Post oc study of MDRD study RCT CKD stage 4–5 n = 255 |
LPD = 0.6 g protein/kg per day vs. VLPD + KA = 0.3 g protein/kg per day + KA |
2.2 years |
↓ homocysteinemia by 24% at 1 year |
|
|
Feiten et al., 2005 [28] |
RCT n = 24 eGFR <25 mL/min |
VLPD + KA = 0.3 g/kg vegetable proteins + KA vs. LPD = 0.6 g/kg/d |
4 months |
↑bicarbonates levels No change on calcium levels ↓ phosphate and PTH Decrease the progression of renal decline function of rate of eGFR No change in lipid parameters No change in nutritional status (BMI, albumin) |
Open label Short time of follow up Significant reduction in dietary phosphorus (529 ± 109 to 373 ± 125 mg/day, p < 0.05) |
|
Prakash et al., 2004 [29] |
RCT, double-blind placebo eGFR:28 mL/min/1.73 m2 n = 34 |
LPD = 0.6 g protein/kg per day + placebo vs. VLPD = 0.3 g protein/kg per day + KA |
9 months |
preserve mGFR (−2% in LDP + KA vs. −21% in LPD) No effect on proteinuria No effect of BMI and albumin |
Measure of GFR with 99mTc-DTPA The placebo is problematic because protein intake was different between both groups. |
|
Teplan et al., 2003 [4] |
RCT eGFR: 22–36 mL/min/1.73 m2 n = 186 |
LPD 0.6 g protein/kg per day + rhuEPO + KA vs. LPD: 0.6 g protein/kg per day + rhuEPO vs. LPD: 0.6 g protein/kg per day |
3 years |
Slower progression of CKD ↓proteinuria ↓LDL-cholesterol No change in SBP ↑albumin ↑ plasmatic leucine levels |
Role of rhuEPO unclear Insulin clearance |
|
Di Iorio et al., 2003 [30] |
RCT eGFR: < or =25 mL/min/1.73 m2 n = 10 in each group |
LPD = 0.6 g protein/kg per day vs. VLPD = 0.3 g protein/kg per day + KA |
2 years |
No difference on hemoglobin ↓ EPO dose ↓ phosphate and PTH No change in BMI and albumin No difference in the rate of RRT initiation (8 vs. 7) Slower rate of GFR decline (creatinine clearance) ↓SBP and 24 h NA excretion ↓LDL-cholesterol |
Very few populations |
|
Bernhard et al., 2001 [5] |
RCT CKD stage 4–5 n = 6 in each group |
LPD = 0.6 g protein/kg per day vs. LPD + KA = 0.6 g protein/kg per day + KA |
3 months |
No difference could be attributed to the ketoanalogs total body flux and leucine oxidation No difference on phosphorus, calcium levels No difference on BMI and albumin No difference in renal function and proteinuria No difference on bicarbonatemia |
KA is metabolically safe Short follow-up Small effective |
|
Malvy et al., 1999 [31] |
RCT eGFR<20 mL/min/1.73 m2 n = 50 |
LPD:LPD = 0.65 g protein/kg per day + Ca+ vs. VLPD + KA = 0.3 g protein/kg per day + KA |
3 months or time to eGFR < 5 mL/min/1.73 m2 or RRT |
No difference on GFR progression ↑calcium levels ↓ phosphate and PTH No difference on lipid parameters |
|
|
Kopple et al., 1997 [32] |
Post hoc study of MDRD study RCT CKD stage 4–5 n = 255 |
LPD = 0.6 g protein/kg per day vs. VLPD + KA = 0.3 g protein/kg per day + KA |
2,2 years |
No difference of death and first hospitalization ↑ albumin ↓ transferrin, body wt, percent body fat, arm muscle area, and urine creatinine excretion No correlation between nutritional parameters and death or hospitalization ↓ energy intake |
|
|
Levey et al., 1996 [33] |
Post hoc study of MDRD study RCT CKD stage 4–5 n = 255 |
LPD = 0.6 g protein/kg per day vs. VLPD + KA = 0.3 g protein/kg per day + KA |
2.2 years |
A 0.2 g/kg/d lower achieved total protein intake was associated with a 1.15 mL/min/yr slower mean decline in GFR (p = 0.011), which is equivalent to 29% of the mean GFR decline |
Reanalyze of MDRD study by using correlations of protein intake with a rate of decline in GFR and time to renal failure |
|
Klahr et al., 1994 Study 2 [34] |
RCT CKD stage 4–5 n = 255 |
LPD = 0.6 g protein/kg per day vs. VLPD + KA = 0.3 g protein/kg per day + KA |
27 months |
Marginally slower eGFR decline (−19% in LPD vs. 12% in VLDP + KA, p 0.067) No significant interactions between blood-pressure interventions and the rate of decline in eGFR No difference on albumin No difference in proteinuria |
-Large RCT study -Good adherence of diet -Measured GFR with iothalamate |
|
Coggins et al. 1994 [35] |
Feasibility phase of the MDRD Study eGFR: 8 to 56 mL/min/1.73 m2 n = 96 25 participants were excluded |
LPD = 0.6 g protein/kg per day vs. VLPD + KA = 0.3 g protein/kg per day + KA |
6 months |
No difference on lipid parameters |
Pilot study |
|
Lindenau et al. 1990 [36] |
RCT eGFR<15 mL/min/1.73 m2 n = 40 |
LPD = 0.6 g protein/kg per day + Ca+ vs. VLPD + KA = 0.4 g protein/kg per day + KA |
12 months |
Improvement in osteo-fibrotic as well as in osteo-malacic changes |
A calcium supplementation was given in LPD diet as a control for KA |
|
Jungers et al. 1987 [37] |
RCT CKD stage 5 n = 19 |
LPD = 0.6 g protein/kg per day + Ca+ vs. VLPD + KA = 0.4 g protein/kg per day + KA |
12 months |
No difference on biochemical or morphometric sign of de-nutrition ↑mean renal survival duration until dialysis |
Small and effective |
|
Hecking et al., 1982 [6] |
RCT Mean eGFR: 10.8 mL/min/1.73 m2 n = 15 |
LPD = 0.6 g protein/kg per day + Ca+ vs. LPD + KA = 0.6 g protein/kg per day + KA or EAA or placebo |
3 weeks per periods |
↓ phosphate No difference on GFR and proteinuria No difference on lipids parameters No difference on albumin |
Small and effective versus the placebo |
FD: Free diet. P: phosphorus. MDRD: Modification of Diet in the Renal Disease Study. eGFR: estimated Glomerular Filtration Rate. RRT: renal replacement therapy. FGF23: Fibroblast Growth Factor 23. LPD: Low protein diet. VLDP: Very low protein diet. KA: Keto-analogues. RCT: randomized controlled trial. EAA: essential amino acids; PTH: parathyroid hormone.
This entry is adapted from the peer-reviewed paper 10.3390/nu11092071
References
- Brenner, B.M.; Meyer, T.W.; Hostetter, T.H. Dietary protein intake and the progressive nature of kidney disease: The role of hemodynamically mediated glomerular injury in the pathogenesis of progressive glomerular sclerosis in aging, renal ablation, and intrinsic renal disease. N. Engl. J. Med. 1982, 307, 652–659.
- Milovanova, L.; Fomin, V.; Moiseev, S.; Taranova, M.; Milovanov, Y.; Lysenko Kozlovskaya, L.; Kozlov, V.; Kozevnikova, E.; Milovanova, S.; Lebedeva, M.; et al. Effect of essential amino acid кetoanalogues and protein restriction diet on morphogenetic proteins (FGF-23 and Klotho) in 3b-4 stages chronic кidney disease patients: A randomized pilot study. Clin. Exp. Nephrol. 2018, 22, 1351–1359.
- Teplan, V.; Schück, O.; Racek, J.; Mareckova, O.; Stollova, M.; Hanzal, V.; Malý, J. Reduction of plasma asymmetric dimethylarginine in obese patients with chronic kidney disease after three years of a low-protein diet supplemented with keto-amino acids: A randomized controlled trial. Wien. Klin. Wochenschr. 2008, 120, 478–485.
- Teplan, V.; Schück, O.; Knotek, A.; Hajný, J.; Horácková, M.; Kvapil, M. Czech multicenter study Enhanced metabolic effect of erythropoietin and keto acids in CRF patients on low-protein diet: Czech multicenter study. Am. J. Kidney Dis. 2003, 41, S26–S30.
- Bernhard, J.; Beaufrère, B.; Laville, M.; Fouque, D. Adaptive response to a low-protein diet in predialysis chronic renal failure patients. J. Am. Soc. Nephrol. 2001, 12, 1249–1254.
- Hecking, E.; Andrzejewski, L.; Prellwitz, W.; Opferkuch, W.; Müller, D.; Port, F.K. A controlled study of supplementation with essential amino acids and alpha-keto acids in the conservative management of patients with chronic renal failure. Z. Ernahrungswiss. 1982, 21, 299–311.
- Wang, D.; Wei, L.; Yang, Y.; Liu, H. Dietary supplementation with ketoacids protects against CKD-induced oxidative damage and mitochondrial dysfunction in skeletal muscle of 5/6 nephrectomised rats. Skelet Muscle 2018, 8, 18.
- Liu, D.; Wu, M.; Li, L.; Gao, X.; Yang, B.; Mei, S.; Fu, L.; Mei, C. Low-protein diet supplemented with ketoacids delays the progression of diabetic nephropathy by inhibiting oxidative stress in the KKAy mice model. Br. J. Nutr. 2018, 119, 22–29.
- Zhang, J.-Y.; Yin, Y.; Ni, L.; Long, Q.; You, L.; Zhang, Q.; Lin, S.-Y.; Chen, J. Low-protein diet supplemented with ketoacids ameliorates proteinuria in 3/4 nephrectomised rats by directly inhibiting the intrarenal renin-angiotensin system. Br. J. Nutr. 2016, 116, 1491–1501.
- Zhang, Y.; Huang, J.; Yang, M.; Gu, L.; Ji, J.; Wang, L.; Yuan, W. Effect of a low-protein diet supplemented with keto-acids on autophagy and inflammation in 5/6 nephrectomized rats. Biosci. Rep. 2015, 35, e00263.
- Wang, D.-T.; Lu, L.; Shi, Y.; Geng, Z.-B.; Yin, Y.; Wang, M.; Wei, L.-B. Supplementation of ketoacids contributes to the up-regulation of the Wnt7a/Akt/p70S6K pathway and the down-regulation of apoptotic and ubiquitin-proteasome systems in the muscle of 5/6 nephrectomised rats. Br. J. Nutr. 2014, 111, 1536–1548.
- Gao, X.; Wu, J.; Dong, Z.; Hua, C.; Hu, H.; Mei, C. A low-protein diet supplemented with ketoacids plays a more protective role against oxidative stress of rat kidney tissue with 5/6 nephrectomy than a low-protein diet alone. Br. J. Nutr. 2010, 103, 608–616.
- Gao, X.; Huang, L.; Grosjean, F.; Esposito, V.; Wu, J.; Fu, L.; Hu, H.; Tan, J.; He, C.; Gray, S.; et al. Low-protein diet supplemented with ketoacids reduces the severity of renal disease in 5/6 nephrectomized rats: A role for KLF15. Kidney Int. 2011, 79, 987.
- Maniar, S.; Beaufils, H.; Laouari, D.; Forget, D.; Kleinknecht, C. Supplemented low-protein diets protect the rat kidney without causing undernutrition. J. Lab. Clin. Med. 1992, 120, 851–860.
- Laouari, D.; Jean, G.; Kleinknecht, C.; Broyer, M. Growth, free plasma and muscle amino-acids in uraemic rats fed various low-protein diets. Pediatr. Nephrol. 1991, 5, 318–322.
- Benjelloun, A.S.; Merville, P.; Cambar, J.; Aparicio, M. Effects of a low-protein diet on urinary glycosaminoglycan excretion in adriamycin-treated rats. Nephron 1993, 64, 242–248.
- Barsotti, G.; Moriconi, L.; Cupisti, A.; Dani, L.; Ciardella, F.; Lupetti, S.; Giovannetti, S. Protection of renal function and of nutritional status in uremic rats by means of a low-protein, low-phosphorus supplemented diet. Nephron 1988, 49, 197–202.
- Meisinger, E.; Gretz, N.; Strauch, M. Hyperfiltration due to amino and keto acid supplements of low-protein diets: Influence on proteinuria. Infus. Klin Ernahr 1987, 14 (Suppl. 5), 26–29.
- Di Iorio, B.R.; Marzocco, S.; Bellasi, A.; De Simone, E.; Dal Piaz, F.; Rocchetti, M.T.; Cosola, C.; Di Micco, L.; Gesualdo, L. Nutritional therapy reduces protein carbamylation through urea lowering in chronic kidney disease. Nephrol. Dial. Transplant. 2018, 33, 804–813.
- Garneata, L.; Stancu, A.; Dragomir, D.; Stefan, G.; Mircescu, G. Ketoanalogue-Supplemented Vegetarian Very Low-Protein Diet and CKD Progression. J. Am. Soc. Nephrol. 2016, 27, 2164–2176.
- Di Iorio, B.; Di Micco, L.; Torraca, S.; Sirico, M.L.; Russo, L.; Pota, A.; Mirenghi, F.; Russo, D. Acute effects of very-low-protein diet on FGF23 levels: A randomized study. Clin. J. Am. Soc. Nephrol. 2012, 7, 581–587.
- Marzocco, S.; Dal Piaz, F.; Di Micco, L.; Torraca, S.; Sirico, M.L.; Tartaglia, D.; Autore, G.; Di Iorio, B. Very low protein diet reduces indoxyl sulfate levels in chronic kidney disease. Blood Purif. 2013, 35, 196–201.
- Di Iorio, B.R.; Cucciniello, E.; Martino, R.; Frallicciardi, A.; Tortoriello, R.; Struzziero, G. Acute and persistent antiproteinuric effect of a low-protein diet in chronic kidney disease. G Ital. Nefrol 2009, 26, 608–615.
- Menon, V.; Kopple, J.D.; Wang, X.; Beck, G.J.; Collins, A.J.; Kusek, J.W.; Greene, T.; Levey, A.S.; Sarnak, M.J. Effect of a very low-protein diet on outcomes: Long-term follow-up of the Modification of Diet in Renal Disease (MDRD) Study. Am. J. Kidney Dis. 2009, 53, 208–217.
- Mircescu, G.; Gârneaţă, L.; Stancu, S.H.; Căpuşă, C. Effects of a supplemented hypoproteic diet in chronic kidney disease. J. Ren. Nutr. 2007, 17, 179–188.
- Gennari, F.J.; Hood, V.L.; Greene, T.; Wang, X.; Levey, A.S. Effect of dietary protein intake on serum total CO2 concentration in chronic kidney disease: Modification of Diet in Renal Disease study findings. Clin. J. Am. Soc. Nephrol. 2006, 1, 52–57.
- Menon, V.; Wang, X.; Greene, T.; Beck, G.J.; Kusek, J.W.; Selhub, J.; Levey, A.S.; Sarnak, M.J. Homocysteine in chronic kidney disease: Effect of low protein diet and repletion with B vitamins. Kidney Int. 2005, 67, 1539–1546.
- Feiten, S.F.; Draibe, S.A.; Watanabe, R.; Duenhas, M.R.; Baxmann, A.C.; Nerbass, F.B.; Cuppari, L. Short-term effects of a very-low-protein diet supplemented with ketoacids in nondialyzed chronic kidney disease patients. Eur. J. Clin. Nutr. 2005, 59, 129–136.
- Prakash, S.; Pande, D.P.; Sharma, S.; Sharma, D.; Bal, C.S.; Kulkarni, H. Randomized, double-blind, placebo-controlled trial to evaluate efficacy of ketodiet in predialytic chronic renal failure. J. Ren. Nutr. 2004, 14, 89–96.
- Di Iorio, B.R.; Minutolo, R.; De Nicola, L.; Bellizzi, V.; Catapano, F.; Iodice, C.; Rubino, R.; Conte, G. Supplemented very low protein diet ameliorates responsiveness to erythropoietin in chronic renal failure. Kidney Int. 2003, 64, 1822–1828.
- Malvy, D.; Maingourd, C.; Pengloan, J.; Bagros, P.; Nivet, H. Effects of severe protein restriction with ketoanalogues in advanced renal failure. J. Am. Coll. Nutr. 1999, 18, 481–486.
- Kopple, J.D.; Levey, A.S.; Greene, T.; Chumlea, W.C.; Gassman, J.J.; Hollinger, D.L.; Maroni, B.J.; Merrill, D.; Scherch, L.K.; Schulman, G.; et al. Effect of dietary protein restriction on nutritional status in the Modification of Diet in Renal Disease Study. Kidney Int. 1997, 52, 778–791.
- Levey, A.S.; Adler, S.; Caggiula, A.W.; England, B.K.; Greene, T.; Hunsicker, L.G.; Kusek, J.W.; Rogers, N.L.; Teschan, P.E. Effects of dietary protein restriction on the progression of advanced renal disease in the Modification of Diet in Renal Disease Study. Am. J. Kidney Dis. 1996, 27, 652–663.
- Klahr, S.; Levey, A.S.; Beck, G.J.; Caggiula, A.W.; Hunsicker, L.; Kusek, J.W.; Striker, G. The effects of dietary protein restriction and blood-pressure control on the progression of chronic renal disease. Modification of Diet in Renal Disease Study Group. N. Engl. J. Med. 1994, 330, 877–884.
- Coggins, C.H.; Dwyer, J.T.; Greene, T.; Petot, G.; Snetselaar, L.G.; Van Lente, F. Serum lipid changes associated with modified protein diets: Results from the feasibility phase of the Modification of Diet in Renal Disease Study. Am. J. Kidney Dis. 1994, 23, 514–523.
- Lindenau, K.; Abendroth, K.; Kokot, F.; Vetter, K.; Rehse, C.; Fröhling, P.T. Therapeutic effect of keto acids on renal osteodystrophy. A prospective controlled study. Nephron 1990, 55, 133–135.
- Jungers, P.; Chauveau, P.; Ployard, F.; Lebkiri, B.; Ciancioni, C.; Man, N.K. Comparison of ketoacids and low protein diet on advanced chronic renal failure progression. Kidney Int. Suppl. 1987, 22, S67–S71.