Your browser does not fully support modern features. Please upgrade for a smoother experience.
Please note this is an old version of this entry, which may differ significantly from the current revision.
Subjects:
Agriculture, Dairy & Animal Science
Vertebrates maintain complex symbiotic relationships with microbiota living within their gastrointestinal tracts which reflects the ecological and evolutionary relationship between hosts and their gut microbiota.
- Calotes versicolor
- gut microbiota
- spatial heterogeneity
1. Introduction
The gut is the primary site for absorbing and reformulating nutrients from the food [1,2]. Microbiota of the vertebrate gastrointestinal tract have complex symbiotic relationships with their host. The gut microbial community structure significantly influences the host ecology and evolution via energy budget [3], foraging behavior [4], immunity [5,6,7], nutrient metabolism [8,9], and reproductive performance [10,11]. However, the composition of the gut microbial community is influenced by environmental factors, pH, oxygen concentration, nutrient composition, and other physiological characteristics in different gut chambers [12,13,14,15,16,17]. To date most microbiota and their relationship with host studies have focused on invertebrates [18,19], fish [20,21,22,23], amphibians [24,25,26], birds [15,27,28], mammals [29,30,31] and some reptiles [2,11,13,32]. However, studies on lizards’ gut microbial ecology and their relationship with the host are very limited. The lizrads’ gut microbial community compositions and structures were similar to those observed in mammals, and previous studies have documented general patterns. Further, gut bacterial diversity did not depend on the diversification of lizard hosts [33], but it varied along altitudes, diet and captive environment [2,14,34,35,36,37,38], and changed due to climate warming [32]. There was no significant difference in gut bacterial diversity between juveniles and adults [35], but males had significantly higher gut bacterial diversity and richness than do females [39], while non-gestation females had higher gut bacterial richness than do late-gravid females [11].
There is a complex gut microbiota composition that varies between different regions in the gastrointestinal tract [40]. Physiological changes in different areas of the small intestine and the large intestine, including chemical and nutritional gradients and isolated host immune activity, are thought to affect the composition of bacterial communities [41]. The microbiome composition differs between the large intestine and small intestine in Agkistrodon piscivorus [42]. However, the differences in the relative abundance in Shinisaurus crocodilurus were reported, such as Bacteroidetes (32.1%) and Proteobacteria (47.9%) were the dominant phyla in the cloacal swab samples [38], whereas Firmicutes (61.2%) and Proteobacteria (35.8%) were the dominant phyla in fecal samples [35]. The majority of these studies have been conducted using fecal samples, cloaca swabs, or the intestinal contents collected from wild-caught or captive individuals. Microbiota plays an important role in host physiology, such as in nutrient digestion and uptake, and in the synthesis of fatty acids, amino acids and vitamins [43,44]. The microbial metabolites include short chain fatty acids from bacterial degradation of dietary fiber [45], secondary bile acids originating from the bacterial conversion of bile acids in the colon [46], and the product of microbial-host co-metabolism of nutrients [45] protect host health [47]. There are differences in metabolic production in different intestines basing on the bacterial community compositions. However, this understanding is limited in lizards and the spatial variations and co-occurrence patterns of gut microbiota inside the gastrointestinal tracts of a host and variations of microbial community among samples remain poorly understood.
2. Bacterial Community Compositions
A total of 497,643, 484,884 and 497,237 raw reads were obtained from SI, AI and LI groups, respectively. The Shannon–Wiener index curve for all samples showed suggesting that there were sufficient sequences for further analyses (Figure S1A). Furthermore, the Good’s coverage estimation minimum values were >99.9%, indicating that most gut bacterial communities of diverse species were retrieved from all samples (Figure S1B).
At the phylum level, Proteobacteria (31.81%), Firmicutes (39.41%), Bacteroidetes (21.13%), Actinobacteria (1.86%) were four identified dominant phyla (mean relative abundance > 1%), which contributed more than 94% of abundance across all samples (Figure 1A). At the family level, the top 17 families were listed (Figure 1B). For all samples, Ruminococcaceae (14.54%), Bacteroidaceae (9.09%) and Enterobacteriaceae (9.00%) were the dominant families (mean relative abundance > 9.00%), but Brucellaceae was more than 9.00% in SI group, Lachnospiraceae and Erysipelotrichaceae were more than 9% in LI group and AI group. At the genus level, Bacteroides, Citrobacter, Eubacterium, Ochrobactrum, Parabacteroides, Akkermansia, Coprobacillus, Sediminibacterium, Acinetobacter (mean relative abundance > 2%) genera were consistently present in each group (Figure 1C).
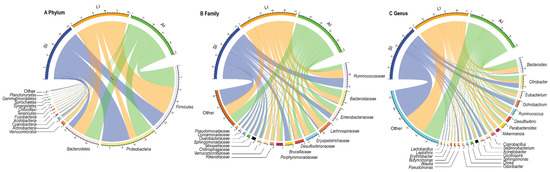
Figure 1. Composition of the gut microbiota of each group at the phylum (A), family (B) and genus (C) levels. SI: sample from the small intestine, LI: sample from the large intestine, and AI: sample from the large intestine when individuals are free-living. The visualization was prepared with R package circlize.
The relative abundances of plylum Firmicutes (t = −2.93, df = 8, p < 0.05) and plylum Bacteroidetes (t = −2.37, df = 8, p < 0.05) showed an increasing trend from small intestine to large intestine, but plylum Proteobacteria (t = 4.40, df = 8, p < 0.01) showed a decreasing trend from small intestine to large intestine (Figure 1A and Figure S2). Furthermore, LI and AI groups tended to have more genus Bacteroides (t = −3.04, df = 8, p < 0.05 for LI; t = −2.73, df = 8, p < 0.05 for AI), but less genus Ochrobactrum (t = 4.95, df = 8, p < 0.01 for LI; t = 3.13, df = 8, p < 0.05 for AI) than SI samples (Figure 1C).
The alpha diversities were employed to evaluate the diversity differences in the gut microbial community among the three groups (Table 1). No significant differences were detected in Chao1, the Observed species number, Shannon, Simpson, Pielou’s E, and Good’s coverage (all p > 0.05) upon one-way Anova except Faith’s PD, that SI had the lowest measurement of phylogenetic diversity.
Table 1. The alpha diversity of microbiota among three groups in Calotes versicolor.
| Species | SI | LI | AI | One-Way Anova |
|---|---|---|---|---|
| Chao1 | 695.22 ± 21.47 | 805.21 ± 25.71 | 866.02 ± 25.07 | F2,24 = 2.155, p = 0.138 |
| Observed species | 691.04 ± 20.93 | 762.60 ± 15.03 | 799.51 ± 40.77 | F2,24 = 2.327, p = 0.119 |
| Shannon | 0.92 ± 0.02 | 0.93 ± 0.01 | 0.94 ± 0.01 | F2,24 = 0.657, p = 0.527 |
| Simpson | 5.98 ± 0.42 | 5.85 ± 0.30 | 6.09 ± 0.28 | F2,24 = 0.216, p = 0.808 |
| Pielou’s Evenness | 0.59 ± 0.03 | 0.61 ± 0.02 | 0.64 ± 0.02 | F2,24 = 0.161, p = 0.852 |
| Good’s coverage | 0.996 ± 0.001 | 0.997 ± 0.001 | 0.996 ± 0.001 | F2,24 = 0.389, p = 0.682 |
| Faith’s PD | 56.07 ± 2.77 b | 81.44 ± 2.40 a | 83.21 ± 4.59 a | F2,24 = 4.640, p = 0.020 |
Alpha diversity estimates mean ± se. SI: sample from the small intestine, LI: sample from the large intestine, and AI: sample from the large intestine when individuals are free-living. α = 0.05, a > b.
With regard to beta diversity, the results of the PCoA plot (Figure 2) and ANOSIM showed significant differences between the SI group and other groups, respectively (SI-LI, R = 0.84, p < 0.01; SI-AI, R = 0.41, p < 0.01), with similarity between LI group and AI group (R = 0.02, p = 0.534).
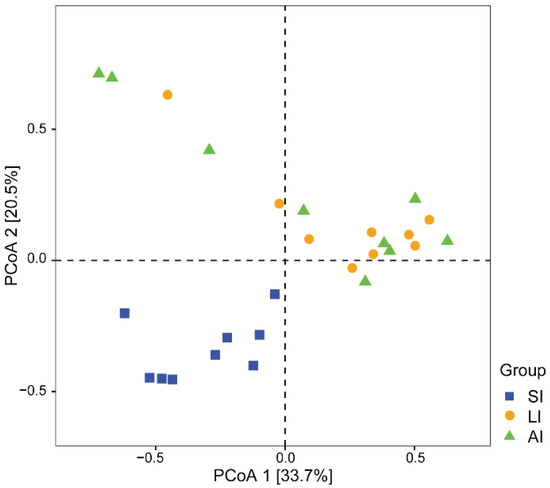
Figure 2. The beta diversity of the gut microbiota composition of three groups by PCoA. The variation explanation is indicated on each respective axis. SI: sample from the small intestine, LI: sample from the large intestine, and AI: sample from the large intestine when individuals are free-living.
3. LEfSe Analysis of Bacterial Communities
Forty biomarkers were significantly different (LDA > 4.0, p < 0.05), of which 23 biomarkers in the SI group were higher, 8 biomarkers in the LI group were higher, and 9 biomarkers in the AI group were higher than the other two groups based on the LDA scores (>4.0), respectively (Figure 3). Compared to SI, the AI had a higher abundance of the genus Bacteroides (Class: Bacteroidia), Coprobacillus and Eubacterium (Class: Erysipelotrichia), and the LI had a higher abundance of the genus Parabacteroides (Family: Porphyromonadaceae) and Ruminococcus (Family: Lachnospiraceae), and Families: Odoribacteraceae and Rikenellaceae. However, SI had a higher abundance of the genus Acinetobacter and Pseudomonas (Class: Gammaproteobacteria), Sediminibacterium (Class: Chitinophagia), and Ochrobactrum and Sphingomonas (phylum: Proteobacteria), Comamonadaceae and Oxalobacteraceae (Class: Betaproteobacteria) than that in the other two groups (Figure 3).
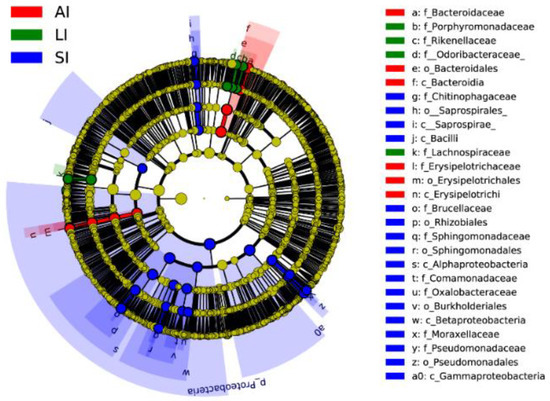
Figure 3. Linear discriminative analysis of effect size (LEfSe) analysis of taxonomic biomarkers of gut microbiota. Cladogram of significant changes at all taxonomic levels. The root of the cladogram represents the domain bacteria. The size of the node represents the abundance of taxa. LDA scores > 4 were shown. SI: sample from the small intestine, LI: sample from the large intestine, and AI: sample from the large intestine when individuals are free-living.
4. Functional Predictions of Bacterial
All bacterial Amplicon Sequence Variant (ASV) species possessed Nearest Sequenced Taxon Index (NSTI) values < 2 (range from ~0.00 to 1.76). At the top level, 182 KEGG metabolic pathways were identified as metabolism (79.84%), genetic information processing (12.19%), cellular processes (4.54%), environmental information processing (2.65%), organismal systems (0.41%, Figure 4A) and other (0.38%). At the second level, 35 functions were identified, including (top 10) carbohydrate metabolism, amino acid metabolism, metabolism of cofactors and vitamins, metabolism of terpenoids and polyketides, metabolism of other amino acids, lipid metabolism, energy metabolism, replication and repair, xenobiotics biodegradation and metabolism and glycan biosynthesis and metabolism (Figure 4B), while at the third level, the biosynthesis of ansamycins was a primary function (mean relative abundance > 2%, Figure 4C).
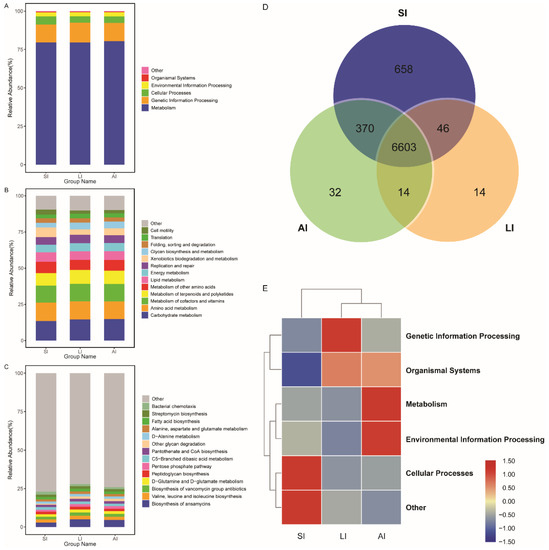
Figure 4. Functional classifications of 16s RNA in microbiota at (A) the top level, (B) the second level, and (C) the third levels of relative abundance, and (D) Venn and (E) clusters analysis of functions among three groups. SI: sample from the small intestine, LI: sample from the large intestine, and AI: sample from the large intestine when individuals are free-living.
The shared genes indicated that most of the knockouts (KOs) were common among the three groups, while 658, 14 and 32 KOs were exclusive to the SI, LI and AI groups, respectively (Figure 4D). The heatmap of the cluster indicated that at the top level, the KOs of SI group were enriched in Cellular processes (Figure 4E). There were significant differences at 16 pathways between SI and LI group (adj p < 0.05), and at 14 pathways between SI and AI group (adj p < 0.05), especially, secondary bile acid biosynthesis, glycosaminoglycan degradation, sphingolipid metabolism and lysosome, the four functions were higher in AI and LI group (Figure 5). There were no significant differences between AI and LI groups (all adj p > 0.05).
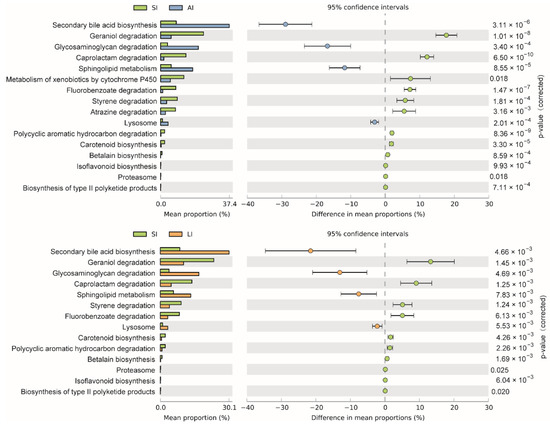
Figure 5. Different KEGG pathways at the third level between groups. SI: sample from the small intestine, LI: sample from the large intestine, and AI: sample from the large intestine when individuals are free-living.
This entry is adapted from the peer-reviewed paper 10.3390/ani11082461
This entry is offline, you can click here to edit this entry!