1. Introduction
Air pollution is one of the major environmental risk factors affecting human health, climate change, and ecosystems. The World Health Organization (WHO) reported that air pollution was associated with seven million deaths in the world in 2016 [
1]. Many air pollutants are emitted along with carbon dioxide (CO
2), by combustion, and some of them have radiative forcing, which affects the global radiation balance [
2]. In addition, air pollutants, such as ozone, affect the yield of crops [
3], which may lead to a decrease in food supply in the future. In Japan, measures to control the air pollutant emissions from various stationary and mobile sources, have been applied since the 1950s. Wakamatsu et al. (2013) [
4] discussed the relationship between air pollution trends throughout Japan and Tokyo from 1970 to 2012, and air pollution control measures. That study clarified that the concentration of air pollutants is steadily decreasing, due to the effects of various source measures. On the other hand, regarding particulate matter (e.g., PM
2.5) and photochemical oxidants (e.g., ozone), which are mainly composed of secondary air pollutants, the compliance rate of air quality standards, which is defined as the ratio of the number of stations complying with air quality standards to the total number of stations, has not reached 100%, and further measures are required. Information on the compliance rate of air quality standards in Japan, the inter-comparison with the United States and Europe, and the WHO air quality guidelines, are summarized in
Supplement (S1).
PM
2.5 is defined as a particulate matter that has a diameter of less than 2.5 micrometers, and its concentration is associated with ischemic heart disease [
5]. Photochemical oxidants are defined as ozone, peroxyacetyl nitrate, and other oxidizing substances that are produced by photochemical reactions (which liberate iodine from neutral potassium iodide solution, excluding nitrogen dioxide). Since photochemical oxidants are almost the same as tropospheric ozone, they are referred to as ‘ozone’ hereafter. Ozone, the precursors of which are nitrogen oxides and volatile organic compounds, is one of the short-lived climate pollutants. The concentration of ozone has been gradually increasing year-by-year, over a wide area of Japan, including rural areas (that are not directly affected by anthropogenic emission sources of air pollutants).
There are not many papers that summarize the relationship between emissions and the concentrations of air pollutants in Japan, over a long period of time. Wakamatsu et al. (2013) [
4] analyzed the relationships between the introduction of regulations, mainly on automobiles, and air pollutant concentrations, up to 2012 in Japan, and the results showed that the introduction of stricter regulations led to a decrease in air pollutant concentrations. However, the relationship between emissions and concentrations of air pollutants was not quantitatively analyzed. Kannari et al. (2013) [
6] summarized the relationships between vehicle emissions and air pollutant concentrations, from 1980 to 2010. In this paper, it was suggested that while air pollutants concentrations, such as NOx and CO, decrease in response to a decrease in vehicle emissions, there are substances for which the influence of non-vehicle sources and secondary generation processes is significant (e.g., NMHC, PM). However, emissions including stationary sources were not directly taken into account in this paper. In Japan, the transboundary transportation of high-concentration PM
2.5 was widely reported in newspapers and news reports in 2013, and PM
2.5 has been a major social concern since then. The air pollution in Japan has mainly been improved mainly the measures against vehicle emissions. However, in order to further improve air pollution, it is necessary to consider not only the impact of vehicle emissions, but also the impact of non-vehicle emission sources and transboundary transportation. Recently, as part of the measures to prevent the spread of the novel coronavirus (COVID-19), there have been changes in economic activities, and there has been a trend towards improvement in air pollution.
This paper analyzes the trends and characteristics of the concentrations of various air pollutants, mainly focusing on PM2.5, ozone, and related substances, as typical substances that do not comply with air quality standards, over the past 30 years, since the 1990s in Japan. Also, the relationship between the emissions and concentrations of air pollutants are quantitatively analyzed, in order to obtain information that will contribute to the measures and research needed to further improve air pollution in the future. The most recent air pollution episodes, such as high-concentration PM2.5 from volcanic eruptions and the impact of reduced economic activity due to measures to prevent the spread of COVID-19 on air pollution concentrations, were also analyzed. Based on these results, the necessary countermeasures for each air pollutant are discussed.
2. Air Quality Issues in Japan after 2019
Although the analysis results of air pollution concentration data up to 2018 were presented above, various air pollution episodes have occurred in Japan since 2019. Here, we summarize the case of the widespread high PM2.5 concentrations that were associated with a volcanic eruption in August 2020. In addition, there have been changes in economic activities from March 2020 to the present (summer of 2021), due to various restrictions aimed at preventing the spread of COVID-19, which have resulted in improved air quality. This air quality improvement was evaluated using monthly average concentrations from 2016 to 2020.
2.1. Transport of Sulfuric Acid Particles Due to a Volcanic Eruption (August 2020)
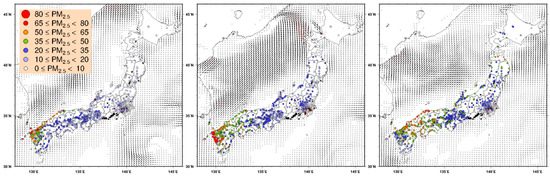
Nishinoshima Island (27.2° N, 140.9° E) is a volcanic island that is located approximately 800 km south of the Japanese archipelago. The island has been erupting intermittently and a large-scale eruption occurred in July 2020. Normally, volcanic ash and volcanic gases that are emitted from Nishinoshima are mostly transported to the east side of the Japanese archipelago. However, in August 2020, the emitted volcanic ash and gases reached the northern part of region 8, on a westward airflow, and widespread high PM
2.5 concentrations were observed.
Figure 11 shows the distribution of PM
2.5 concentrations at 18:00 on 2 August through to 4 August 2020.
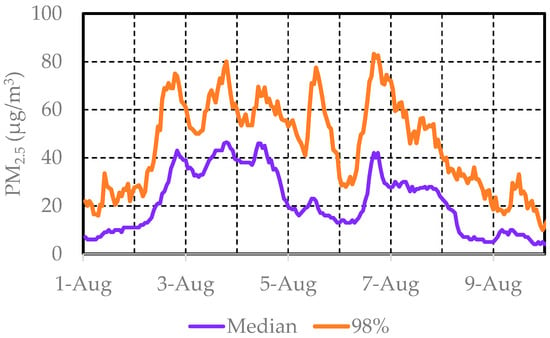
Figure 12 shows the time series of the median PM
2.5 concentration and the 98% concentration in region 8, from 1 August to 10 August 2020. From this figure, it can be observed that, from August 2 to 6, an air mass of about 40 μg/m
3 on average and about 80 μg/m
3, at a 98% concentration, reached region 8. Nakayama et al. [
22] suggest that both the volcanic ash itself and the secondary-produced particles originating from the volcanic gases, contributed to the increase in PM
2.5 concentration during this episode.
Figure 11. Distribution of PM2.5 concentrations at 18:00 on August 2 through to 4 August 2020.
Figure 12. Median and 98% concentrations of PM2.5 in region 8 from 1 August to 10 August 2020.
2.2. Air Impact of Measures to Prevent the Spread of COVID19 (March 2020)
The first outbreak of the novel coronavirus (COVID-19) was reported in December 2019, and as the virus subsequently spread to Europe, the United States, and other regions, measures were taken to prevent a pandemic, including urban lockdowns, and other measures to control human movement and economic activity. As a result of travel restrictions and a reduction in economic activity, many cities reported a general improvement in the concentrations of PM
2.5, NO
2, and SO
2 in their air quality during this period [
23]. However, during this time, ozone is reported to have increased.
In Japan, a state of emergency was declared from 7 April to 25 May 2020. Under the emergency, people were requested to refrain from going out, but no lockdown was enforced.
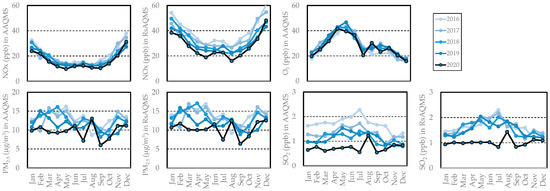
Figure 13 shows the monthly averages of NOx, O3, PM2.5, and SO2 concentrations at the AAQMS and RsAQMS in Tokyo, from 2016 to 2020. Note that the ozone concentrations at the RsAQMS in Tokyo have not been measured, so the ozone concentrations at the RsAQMS are not shown in Figure 13.
Figure 13. Monthly average concentrations of NOx, O3, PM2.5 and SO2 at AAQMS and RsAQMS in the Tokyo metropolitan area from 2016 to 2020.
NOx concentrations have been decreasing over time, especially at the RsAQMS, indicating that a reduction in vehicle emissions has resulted in a decrease in NOx concentrations. NOx concentrations in 2020 were the lowest in those five years, especially in April and May, under the declaration of the state of emergency. This indicates that the reduction in vehicle emissions over time and the temporary decrease in vehicle activity, resulted in lower NOx concentrations in April and May of 2020. Similarly, for PM2.5, the concentrations are lower from March to May 2020. Since there is almost no difference in the concentrations between AAQMS and RsAQMS, it is considered that the lower concentrations are due to a decrease in vehicle emissions and stationary sources emissions, caused by the overall decline in economic activity. As for O3 concentrations, although there are reports of increased concentrations, due to the effects of lockdown in other countries, there does not seem to be any significant change from previous years, in April and May, under the declaration of the state of emergency in Tokyo. This might be due to differences in the concentrations and/or concentration ratios of precursors between Japan and other countries. Further detailed analysis may help us to find effective measures to reduce the ozone concentration, which is difficult to reduce.
As for SO2 concentrations, the concentrations of both AAQMS and RsAQMS have decreased in all months of 2020, regardless of the date of the emergency declaration. In January 2020, the International Maritime Organization (IMO) introduced a regulation on marine fuels (lower sulfur), and this regulation is thought to have reduced SO2 concentrations in the atmosphere.
3. Conclusions
This paper shows the trends and causes of air pollution in Japan over the past 30 years, since the 1990s, focusing mainly on PM2.5, ozone, and related substances, as typical substances that do not comply with air quality standards.
The concentration of PM2.5 has been decreasing over time in China, Korea, and Japan. In terms of the components of PM2.5, the component with the largest decrease rate between 2012 and 2018 is elemental carbon (EC), while the decrease rate of organic carbon (OC) is small. Since OC accounts for a large percentage of PM2.5, OC source control and VOC control, which are precursors of secondary particles of OCs, are important for further reduction in OC concentrations. The analysis of PM2.5 mass concentration, the concentration of the major components of PM2.5, and SPM concentration, focused on the concentration difference between RsAQMS and AAQMS, and the results showed that the concentration differences were all about the same amount, approximately 1 µg/m3. It is suggested that the influence of non-exhaust particles on RsAQMS is limited, because the difference in concentrations between RsAQMS and AAQMS can be explained by the major PM2.5 components, which include little non-exhaust particles. Therefore, further research is needed to understand the accuracy of the current emission inventories and the behavior of non-exhaust particles in roadside air.
For NOx and SO2, there is a relationship between domestic anthropogenic emissions and annual average atmospheric concentrations, indicating that anthropogenic emission control measures are directly effective in the reduction in concentrations. The reduction in NOx may be the result of stricter vehicle emission regulations, and the reduction in SO2 may be the result of the widespread use of low-sulfur fuels. The trend of a decrease in PM emission and atmospheric concentration did not necessarily coincide, due to secondary particles, suggesting that especially VOC emissions as precursors need to be reduced.
Air pollution episodes since 2019, including large-scale transboundary transport and the effects of volcanic eruptions, are summarized. Such high-concentration episodes may occur in the future. Due to the effect of reduced economic activity, as a consequence of COVID-19, the concentrations of NOx and PM2.5 decreased, due to the decrease in emissions under the state of emergency declaration, but the concentration of ozone did not increase, unlike other countries. Further detailed analysis of the differences between Japan and other countries may help us to find effective measures to reduce the ozone concentration. The concentration of SO2 decreased significantly in 2020, regardless of whether the state of emergency was declared or not, due to the effect of the reduction in emissions, caused by the introduction of regulations on marine fuels.
Recently, there has been an acceleration of efforts by countries to reduce carbon dioxide (CO2) emissions and “carbon neutral”. Since air pollutants are often emitted together with CO2 from combustion, carbon neutral efforts may have a positive effect on air pollutants, and, in some cases, a negative effect. It is necessary to continue to monitor this issue, to ensure that there are positive effects on both carbon neutral and air pollutants.