Your browser does not fully support modern features. Please upgrade for a smoother experience.
Please note this is an old version of this entry, which may differ significantly from the current revision.
Subjects:
Transportation
|
Psychology
Real-time coaching programs are designed to give feedback on driving behavior to usage-based motor insurance users; they are often general purpose programs that aim to promote smooth driving.
- highway safety
- deceleration lane
- exit ramp
- real-time feedback
- driving simulator
- usage-based insurance
- PHYD
- driving behavior
1. Introduction
Highway deceleration lanes and exit ramps are a relevant concern in road safety. Despite accounting for a negligible amount of total freeway mileages, they are significantly more risky than freeway mainline sections: in the United States, a National Cooperative Research Program (NCHRP) report showed an average rate of 0.68 crashes per million miles traveled by vehicles on deceleration lanes, 20% higher than that of freeway mainline sections near the exit ramp, and three times higher than that on acceleration lanes [1].
Despite this, there is a relatively small body of research on this topic, which dates back to the 1960s [2]. The vast majority of the studies focused on finding relationships between geometric/traffic features of the deceleration lanes and crash rates [3][4][5][6]. The main goal of these studies was to help practitioners to design safer infrastructures. The main geometric features that were shown to have an impact on deceleration lane safety are: deceleration lane length, deceleration lane type, and number of deceleration lanes. The conclusions from these studies were quite inconsistent; a recent meta-analysis [7] showed that, although significant risks associated with geometric features were observed in many studies, the meta-estimates were not found to be significant, suggesting the need for further research on the topic.
A different approach was applied by Calvi et al. [8], who studied the impact of traffic volume on deceleration lane safety with a driving simulator study involving 30 participants. Contrary to previous crash-based studies, the focus switched to microscopic aspects of the phenomenon, i.e., the behavior of drivers on the deceleration lane; to evaluate safety, they considered vehicle speeds, deceleration, and trajectories. The results showed a significant effect of traffic volume on vehicle speed, deceleration rate, and trajectory, and highlighted some relevant issues, such as that drivers tended to decelerate before diverging, and that speeds in the deceleration lane were significantly higher than the design speed. Subsequently, the authors applied the same driving-simulator-based approach to investigate the effect of the deceleration lane type, comparing parallel and tapered designs [9], and observed significant differences in the speeds of diverging drivers, with greater interference with the through traffic on the tapered lane. Another study focused on evaluating the effects of the number of exit lanes [10]: the two-lane exit layout seemed to provide improved performance over the single-lane one by limiting the interference of the diverging drivers with the through traffic. Their driving simulator approach was later successfully validated by comparing speed and trajectory data collected both in the field and with a simulator experiment [11]. As in the majority of studies in the literature, their declared end goal was to provide guidance for safer infrastructure design.
A driver-behavior-focused approach was followed also by Lyu et al. [12], who carried out a naturalistic experiment involving 46 participants on a typical highway deceleration lane in Wuhan. As in [8], Lyu et al. studied drivers’ speed, deceleration rate, and trajectories; in addition, they investigated vehicle lateral control during the diverging maneuver. The aim of the study was to investigate the effect of some sociodemographic characteristics (i.e., gender, occupation, experience) on drivers’ behavior, showing several significant effects. In particular, male drivers showed earlier entries into the deceleration lane in comparison with female drivers; moreover, before entering the deceleration lane, experienced and professional drivers performed the last lane change as early as possible; in addition, the vehicles’ speed while entering the exit ramp exceeded significantly the speed limit. Their approach introduced a crucial novelty to this line of research, switching the focus from infrastructural/traffic characteristics to drivers’ characteristics.
From this analysis of the literature, it is possible to observe that only a small number of studies have investigated the safety of highway deceleration lanes by focusing on the driving behavior of road users. In addition, to the best of our knowledge, none of them investigated in-vehicle countermeasures aimed at improving the safety of exiting maneuvers in highways.
2. Highway Deceleration Lane Safety: Effects of Real-Time Coaching Programs on Driving Behavior
2.1. Effect of Real-Time Coaching Program on Drivers’ Behavior (Factor Trial)
The results showed that the presence of the real-time coaching program had a significant effect on participants’ driving behavior, influencing their speed, deceleration, trajectory, and lateral control.
Drivers tended, in general, to behave more cautiously in Trial 2. This was confirmed by the fact that the average speed in the highway section decreased, on average, by almost 5 km/h. The fact that the driver’s “base” speed was lower in Trial 2 implied that the speeds in the deceleration lane were also lower in that trial. For this reason, instead of investigating in absolute terms the speeds at the beginning, entry point, and end of the deceleration lane, we chose to investigate the speed-changes at those points. This allowed us to isolate the further reduction in speed that was directly caused by the real-time coaching program. This effect was significant at the entry point (ΔV2) and at the end (ΔV3) of the lane; in terms of safety, these two variables are of particular interest, as one of the main issues of deceleration lanes is that drivers tend to exceed the design speeds used to determine the length of the lane and the radius of the ramp curve [8][13][14]. As regards the speed change at the beginning of the lane (ΔV1), the effect of the feedback appeared evident only for the defensive drivers.
Since the feedback system is directly linked to drivers’ acceleration/braking, it is not surprising that participants decelerated more smoothly in Trial 2. In particular, the improvement was more evident in the maximum deceleration values than in the mean values, coherent with what was observed in the rest of the simulation path, where participants significantly reduced the number of elevated gravitational-force events [15]. Note that this reduction in the deceleration values of Trial 2 was observed despite an increase in the speed reduction, meaning that drivers decelerated with less intensity but for a longer time, i.e., in a smoother way. Smoother driving is of course desirable from a safety point of view; harsh decelerations, conversely, are dangerous because they can increase the potential for loss of vehicle control and reduce the time available for other road users to respond to the driver’s behavior [16]. In addition, it is also worth noting that this significant reduction was observed despite the maximum deceleration value being relatively low, even in Trial 1, because of the geometric characteristics of the deceleration lane. Further research can investigate how program effectiveness on deceleration variables is influenced by lane geometry.
The program had a much more limited impact on vehicles’ trajectories, as it was not found significant, except for an interaction with the factor Cluster on variable E. Therefore, on average, drivers tended to start decelerating and entering the deceleration lane at the same points in both trials. However, by analyzing individual vehicle trajectories (see Figure 3), it was possible to observe that in Trial 2 the behavior was much more consistent among the participants and that there were fewer outliers: in Trial 1 seven of seventy-four drivers entered the deceleration lane with E < 100 m, whereas in Trial 2 all of them did it with E > 100 m.
One of the most important effects of the program involved lateral control, which significantly improved in Trial 2, considering both LATACC and SDSA. To some extent, this can be observed in qualitative terms in Figure 3, where the trajectories in Trial 2 showed generally fewer oscillations. This, again, represents a further positive effect on road safety.
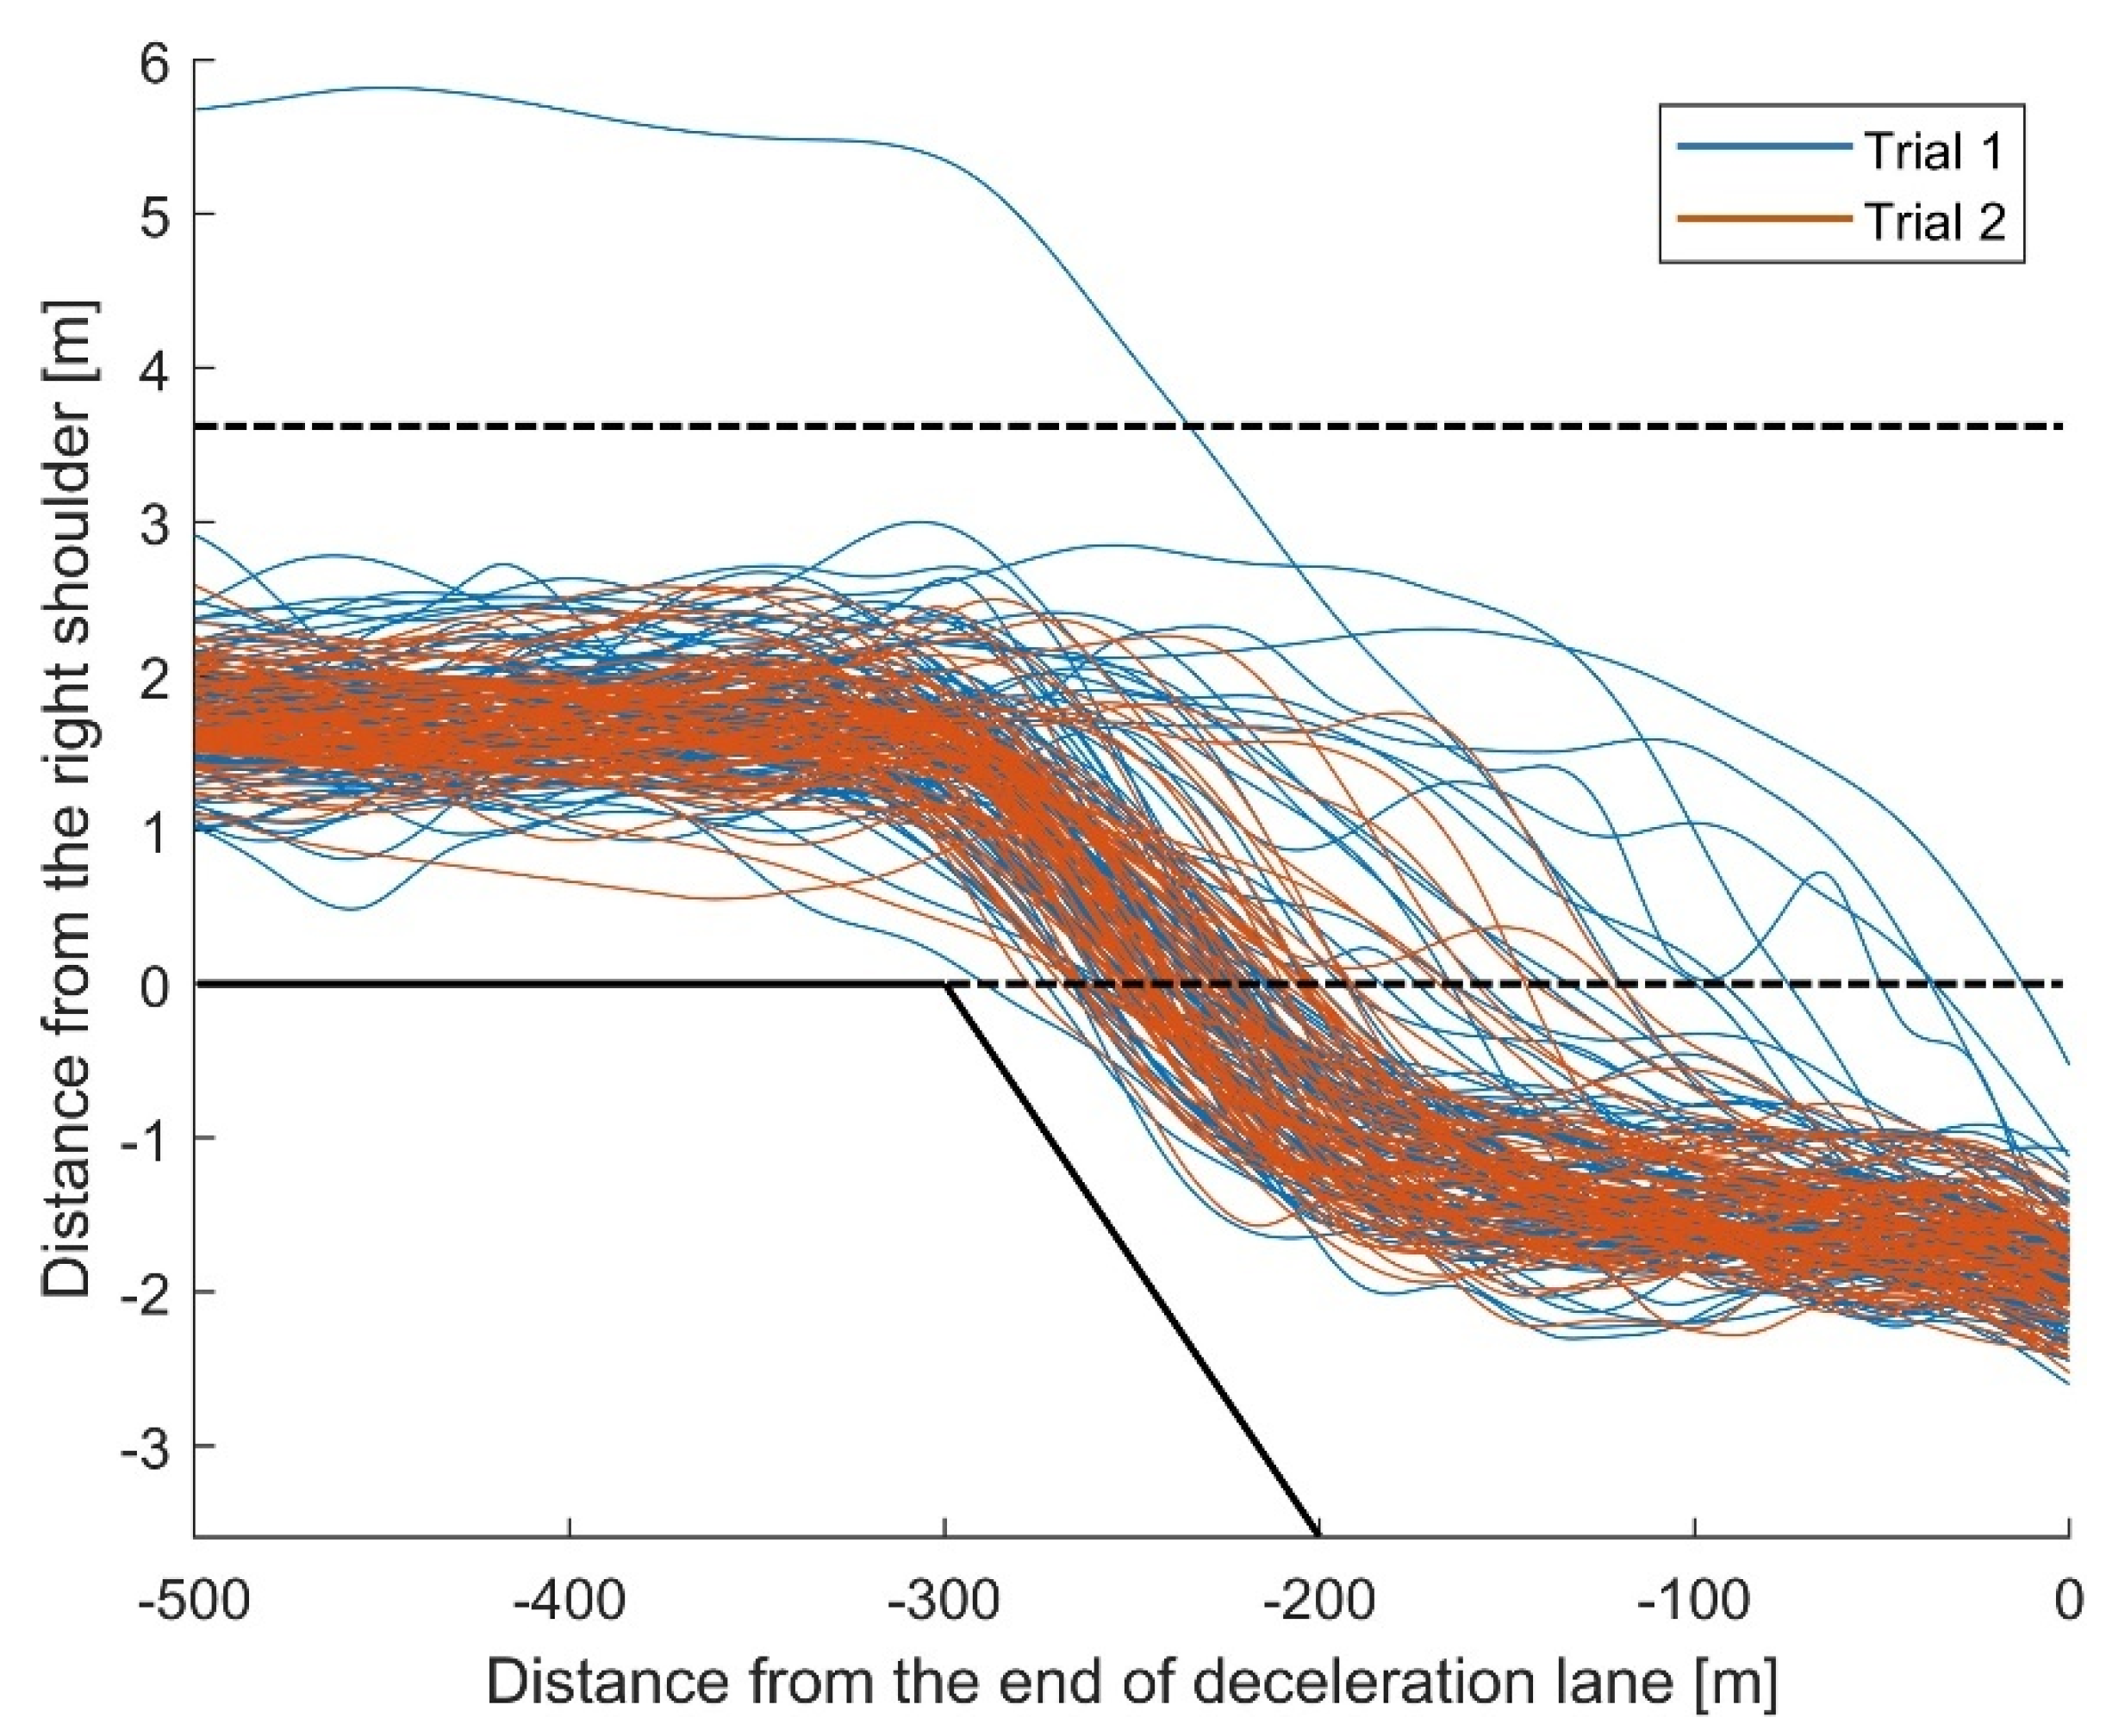 Figure 3. Individual vehicles’ COG trajectories in each Trial.
2.2. Effect of Driving Style on Program Effectiveness (Factor Cluster)
A significant effect of participants’ driving style was observed on speed and trajectory variables. Previous studies showed that the same real-time coaching program was more effective for aggressive drivers, mainly because there is more space for improvement [15][17].
As regards speed variables, however, the improvement was similar for both driver categories (except in the case of ΔV1), meaning, on the one hand, that all users can benefit from it, and, on the other hand, that aggressive drivers are unable to reach defensive drivers’ performance.
The analysis of trajectory variables deserves a more in-depth discussion, as the defensive drivers’ behavior is not the optimal one in terms of safety. As can be seen in Figure 6a, in Trial 1, defensive drivers tended to start their deceleration earlier than aggressive drivers, while entering the deceleration lane at about the same spot. This implies that the majority of defensive drivers adopted a potentially dangerous (and also operationally disruptive—see [18]) exit strategy, which consisted in starting the deceleration before entering the deceleration lane. Such behavior was observed also in [8]. Twenty-three out of 36 defensive drivers (63.8%) were characterized by this behavior; conversely, only 12 out of 38 aggressive drivers adopted it (31.6%).
By entering the deceleration lane earlier in Trial 2, some defensive drivers switched exit strategy, reducing to 18 (i.e., 50%) the number of defensive drivers decelerating before entering the deceleration lane.
This change in exit strategy was likely linked to the decrease in approaching speed, with defensive drivers reaching the beginning of the deceleration lane with a significantly lower speed in Trial 2, allowing them to perform the exiting maneuver comfortably, even without starting the deceleration beforehand. This did not happen to aggressive drivers (see Figure 4b), who, consequently, did not significantly modify their trajectory in Trial 2.
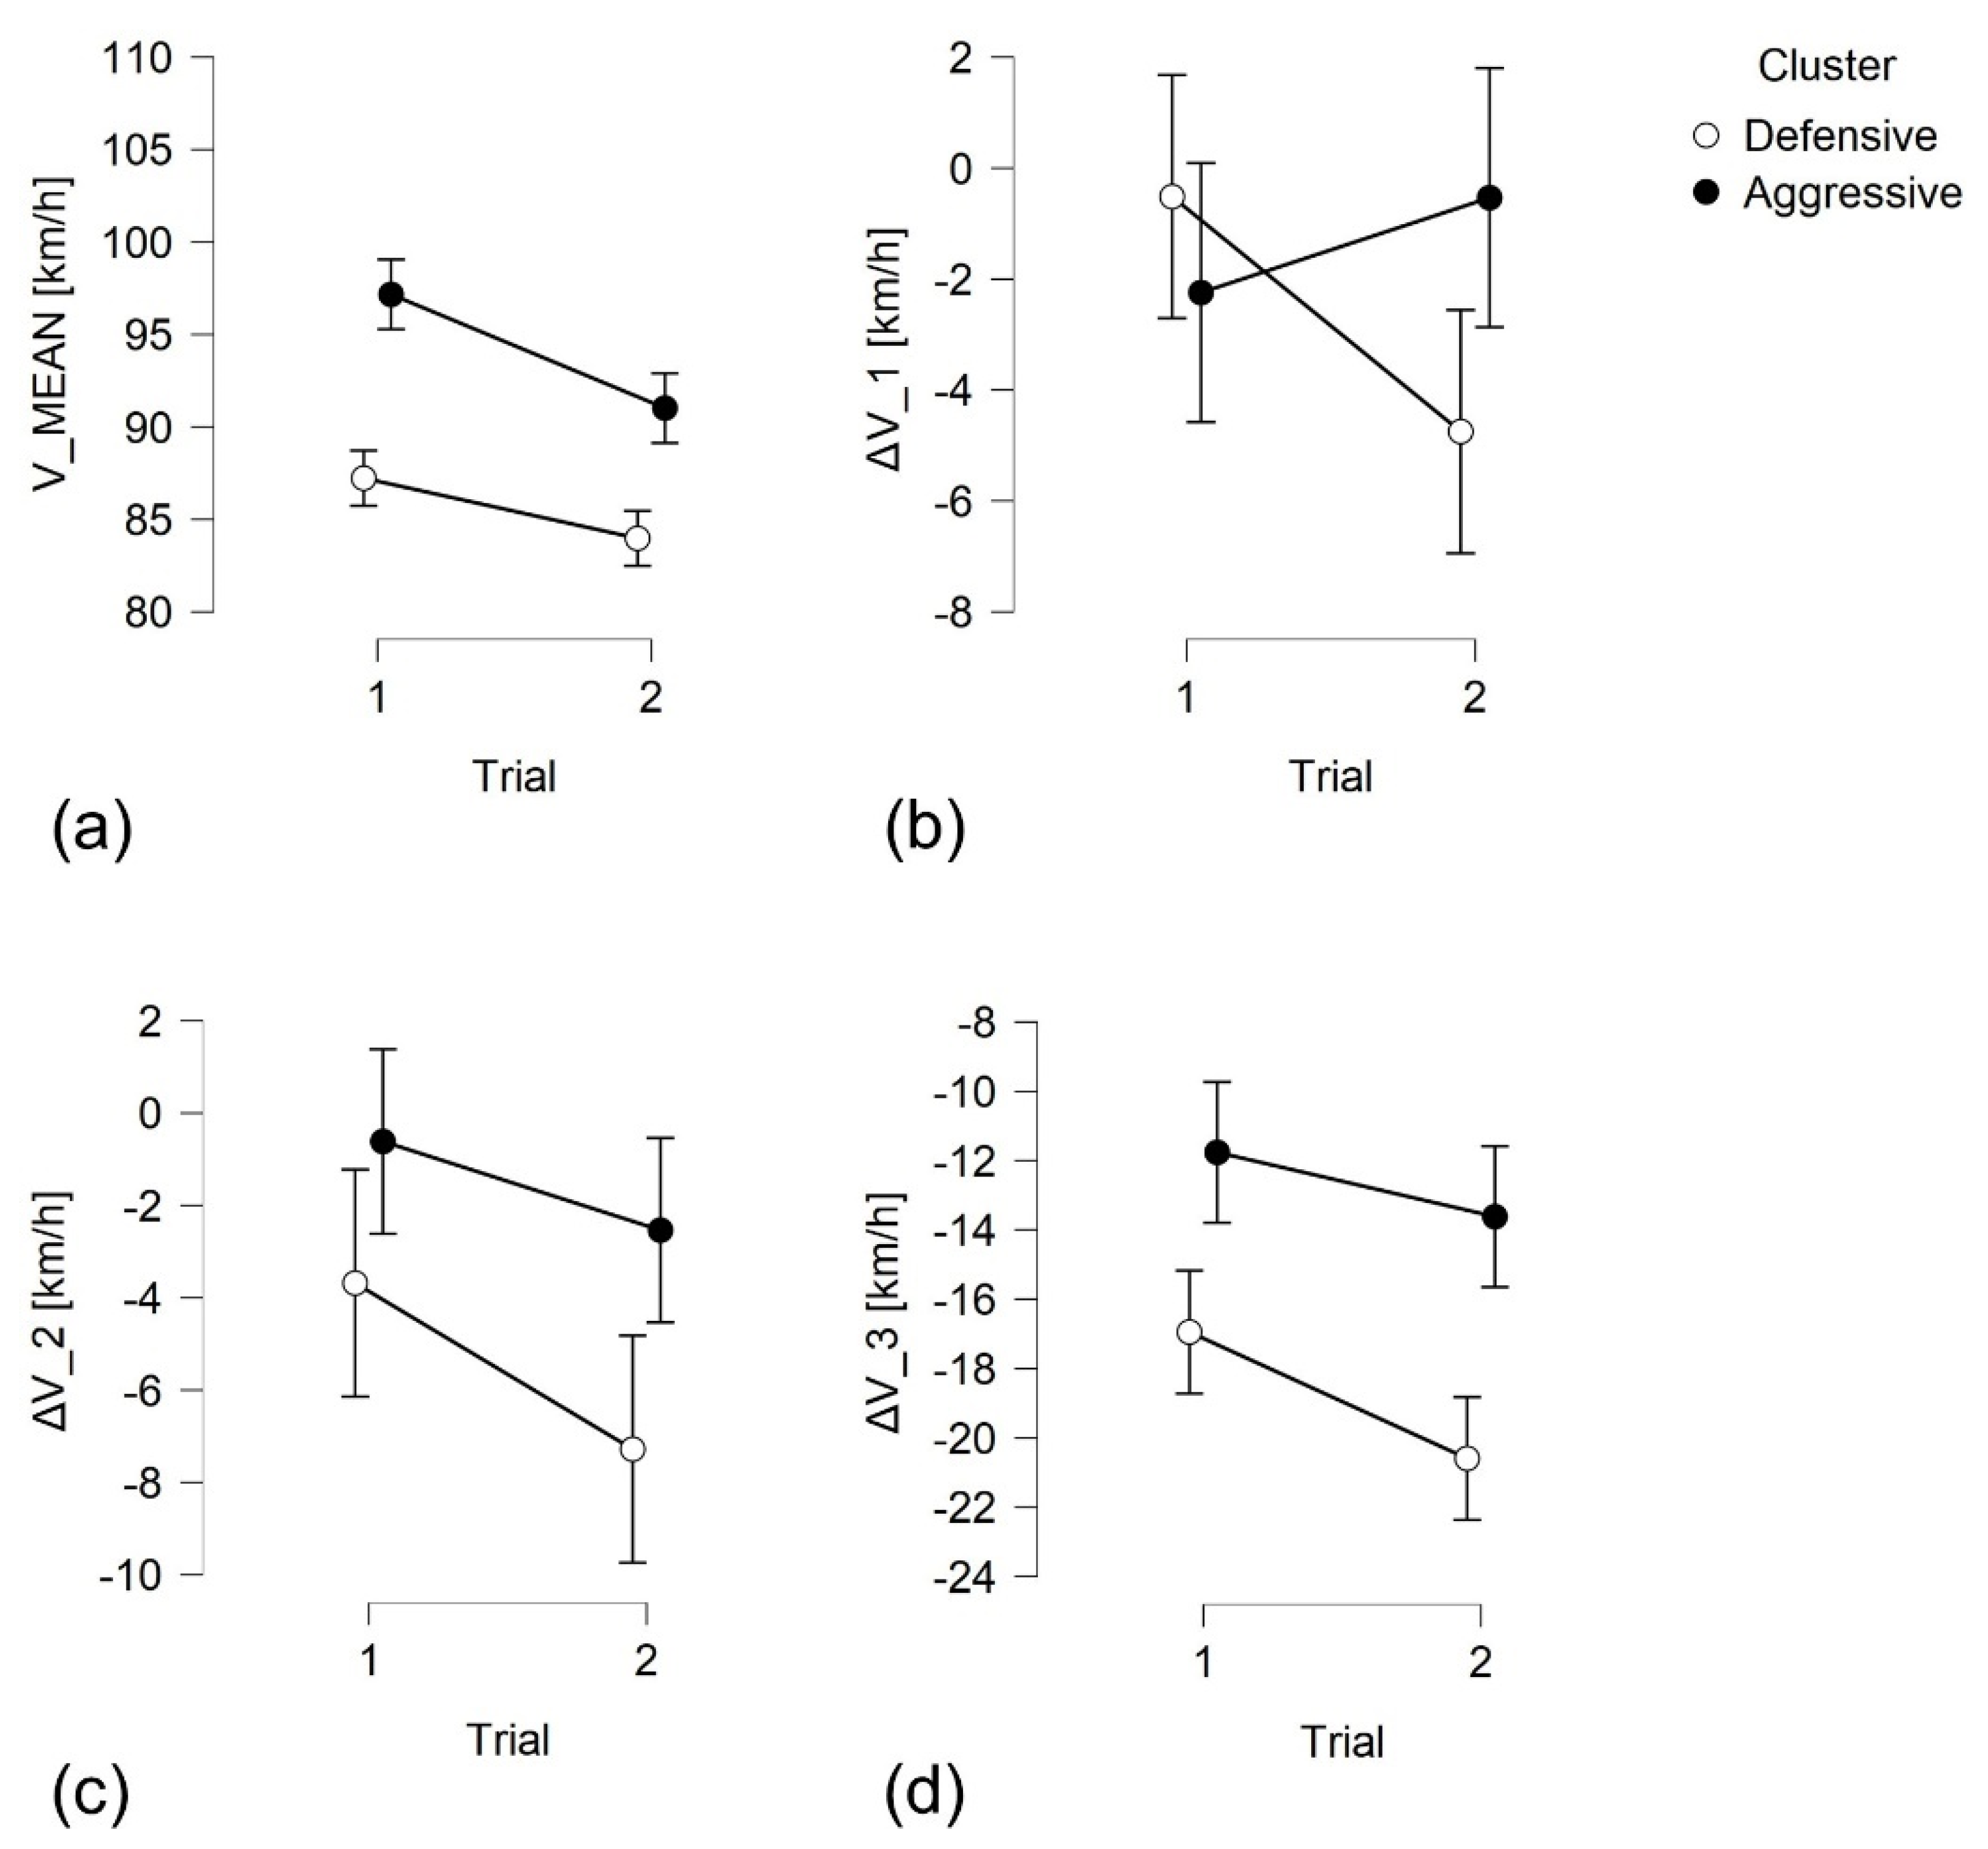 Figure 4. Mixed ANOVA results. Circles represent mean values, bars the 95% confidence intervals. Trial and Cluster effects on: (a) mean speed in the highway; (b) speed change at the beginning of the lane; (c) speed change at the exit point; (d) speed change at the end of the lane.
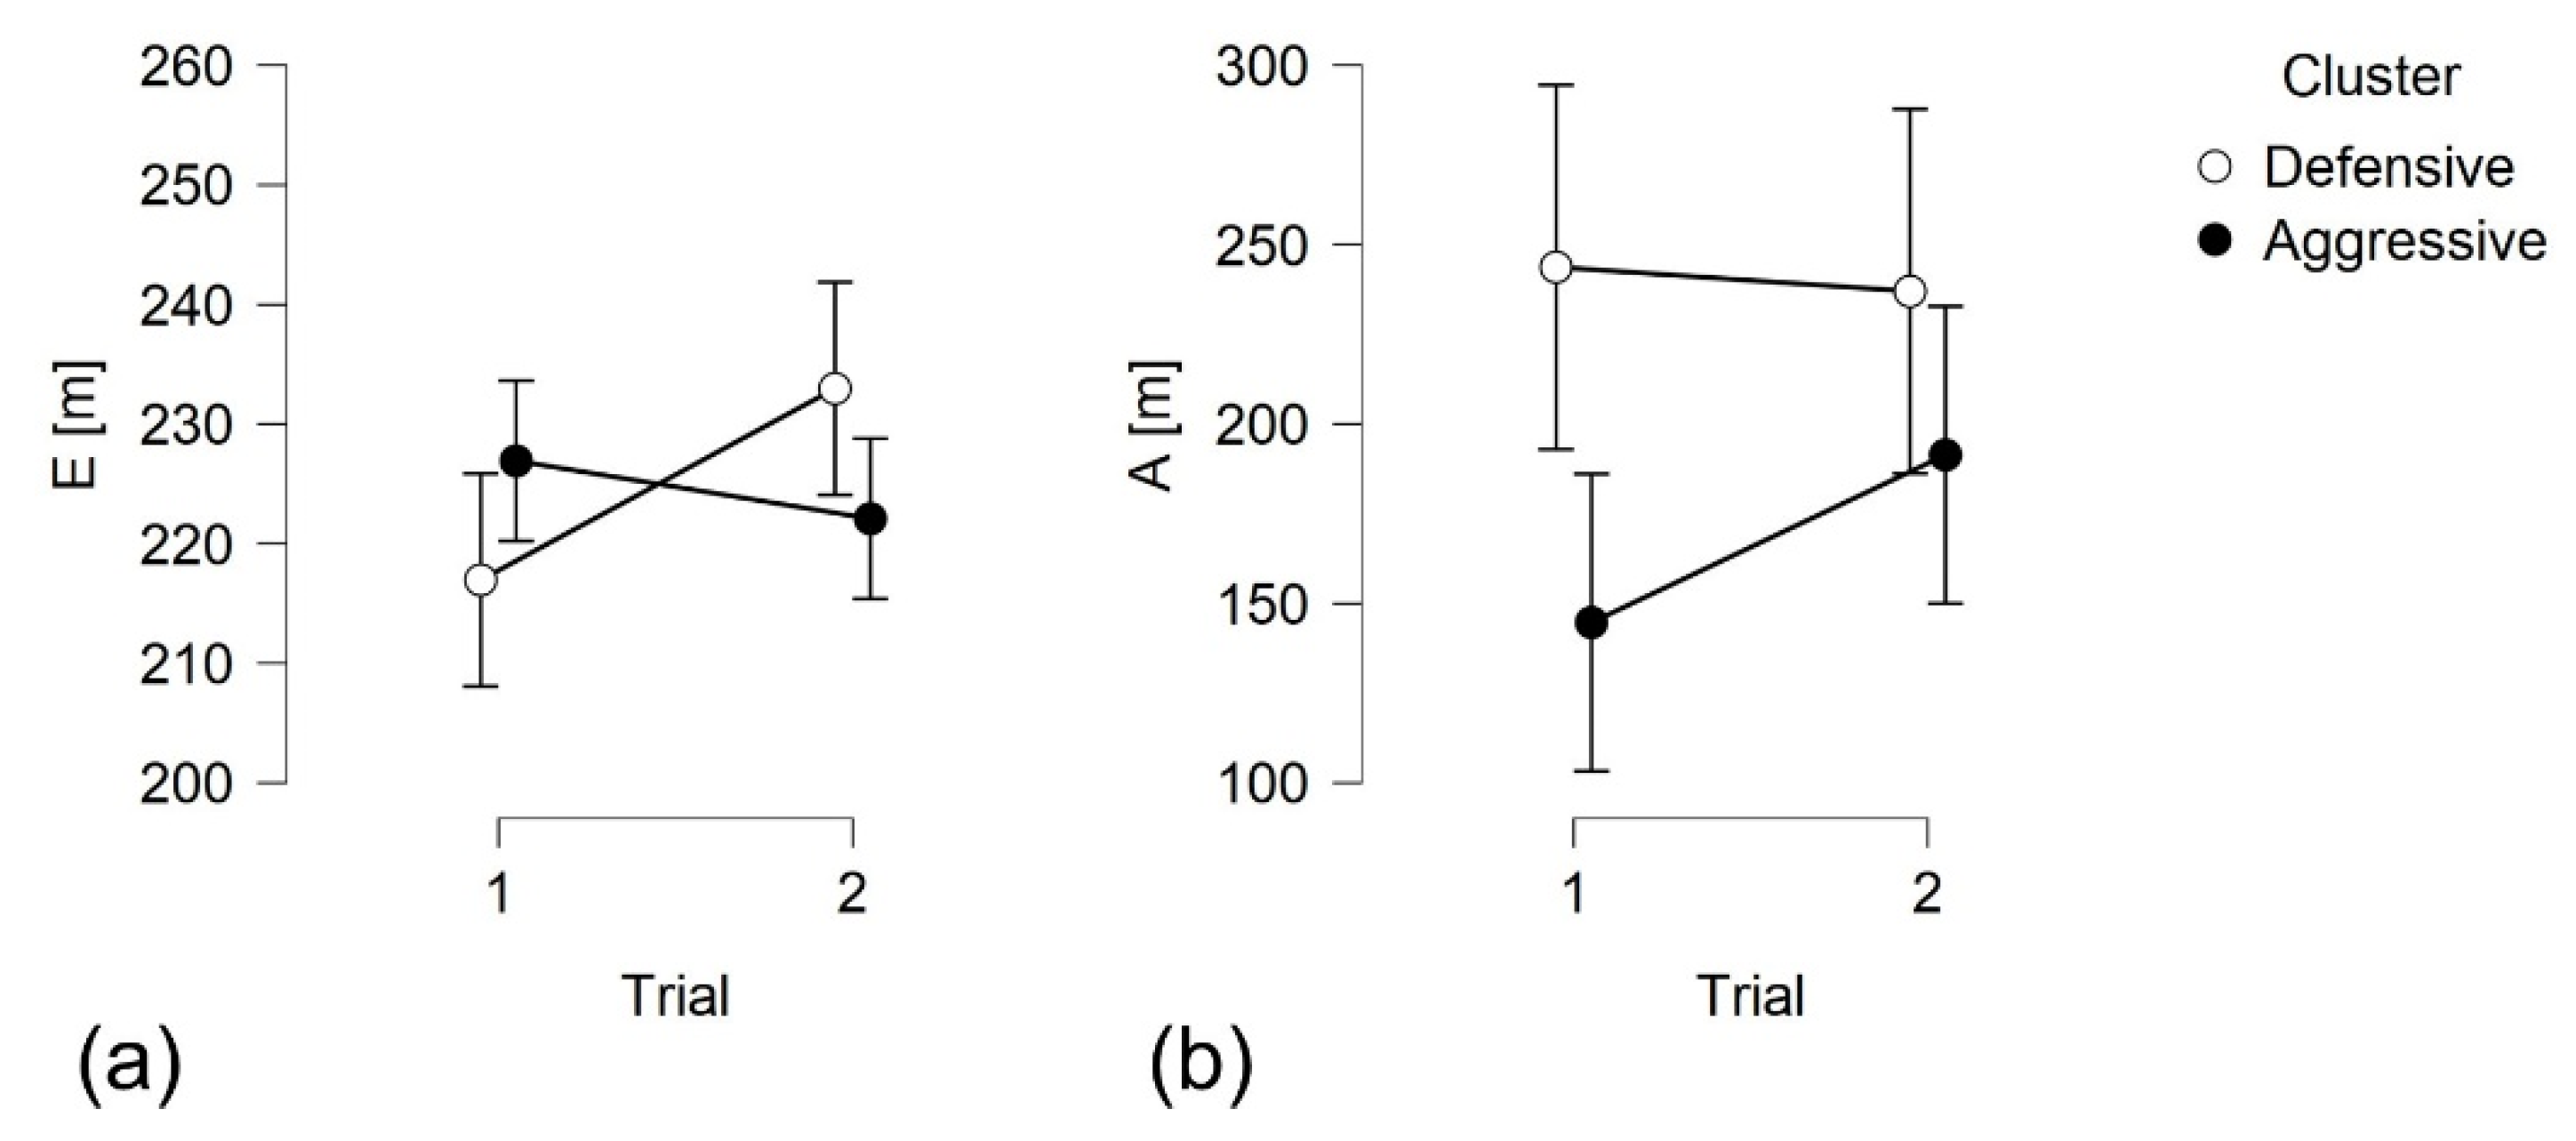 Figure 6. Mixed ANOVA results. Circles represent mean values, bars the 95% confidence intervals. Trial and Cluster effects on: (a) exit point E; (b) start-of-deceleration point A.
2.3. Effect of Feedback Modality and Variance on Program Effectiveness
It has been suggested in the literature that multimodal feedbacks are more effective than either visual or auditory feedbacks, whereas, considering the two modes separately, results are not conclusive [19][20][21]. For this reason, Feedback Modality variable was included in the experimental design. The results of the present study did not show significant differences between auditory and visual modalities, with the notable exception of lateral control, where the visual feedback produced an improvement in performance and the auditory did not. However, as can be observed in Figure 7, this may have been caused by a random difference in the two groups in Trial 1, combined with a ceiling effect, which prevented the participants in the auditory feedback group to improve their performance in the second trial.
Feedback valence (positive or negative) did not show any significant effect on most of the dependent variables, as observed in previous studies on this driving simulator experiment [15][17]. This is in contrast with the findings of Harbeck et al. [22], who suggested that rewards have greater impact on behavioral changes, especially for young drivers. It is however possible that in the present study there was a ceiling effect, caused by the attributes of the feedback sounds: their symbolic meaning may have amplified their effect, disguising differences in their impacts. For one variable, DEC_MAX, a significant interaction between Feedback valence and Trial was found, as only participants who received a negative feedback were able to improve their performance in Trial 2. However, as in the case of the feedback modality effect on lateral control discussed above, this may be explained, at least in part, by a random difference in the two groups in Trial 1 (Figure 5b). Further research is required to confirm these findings.
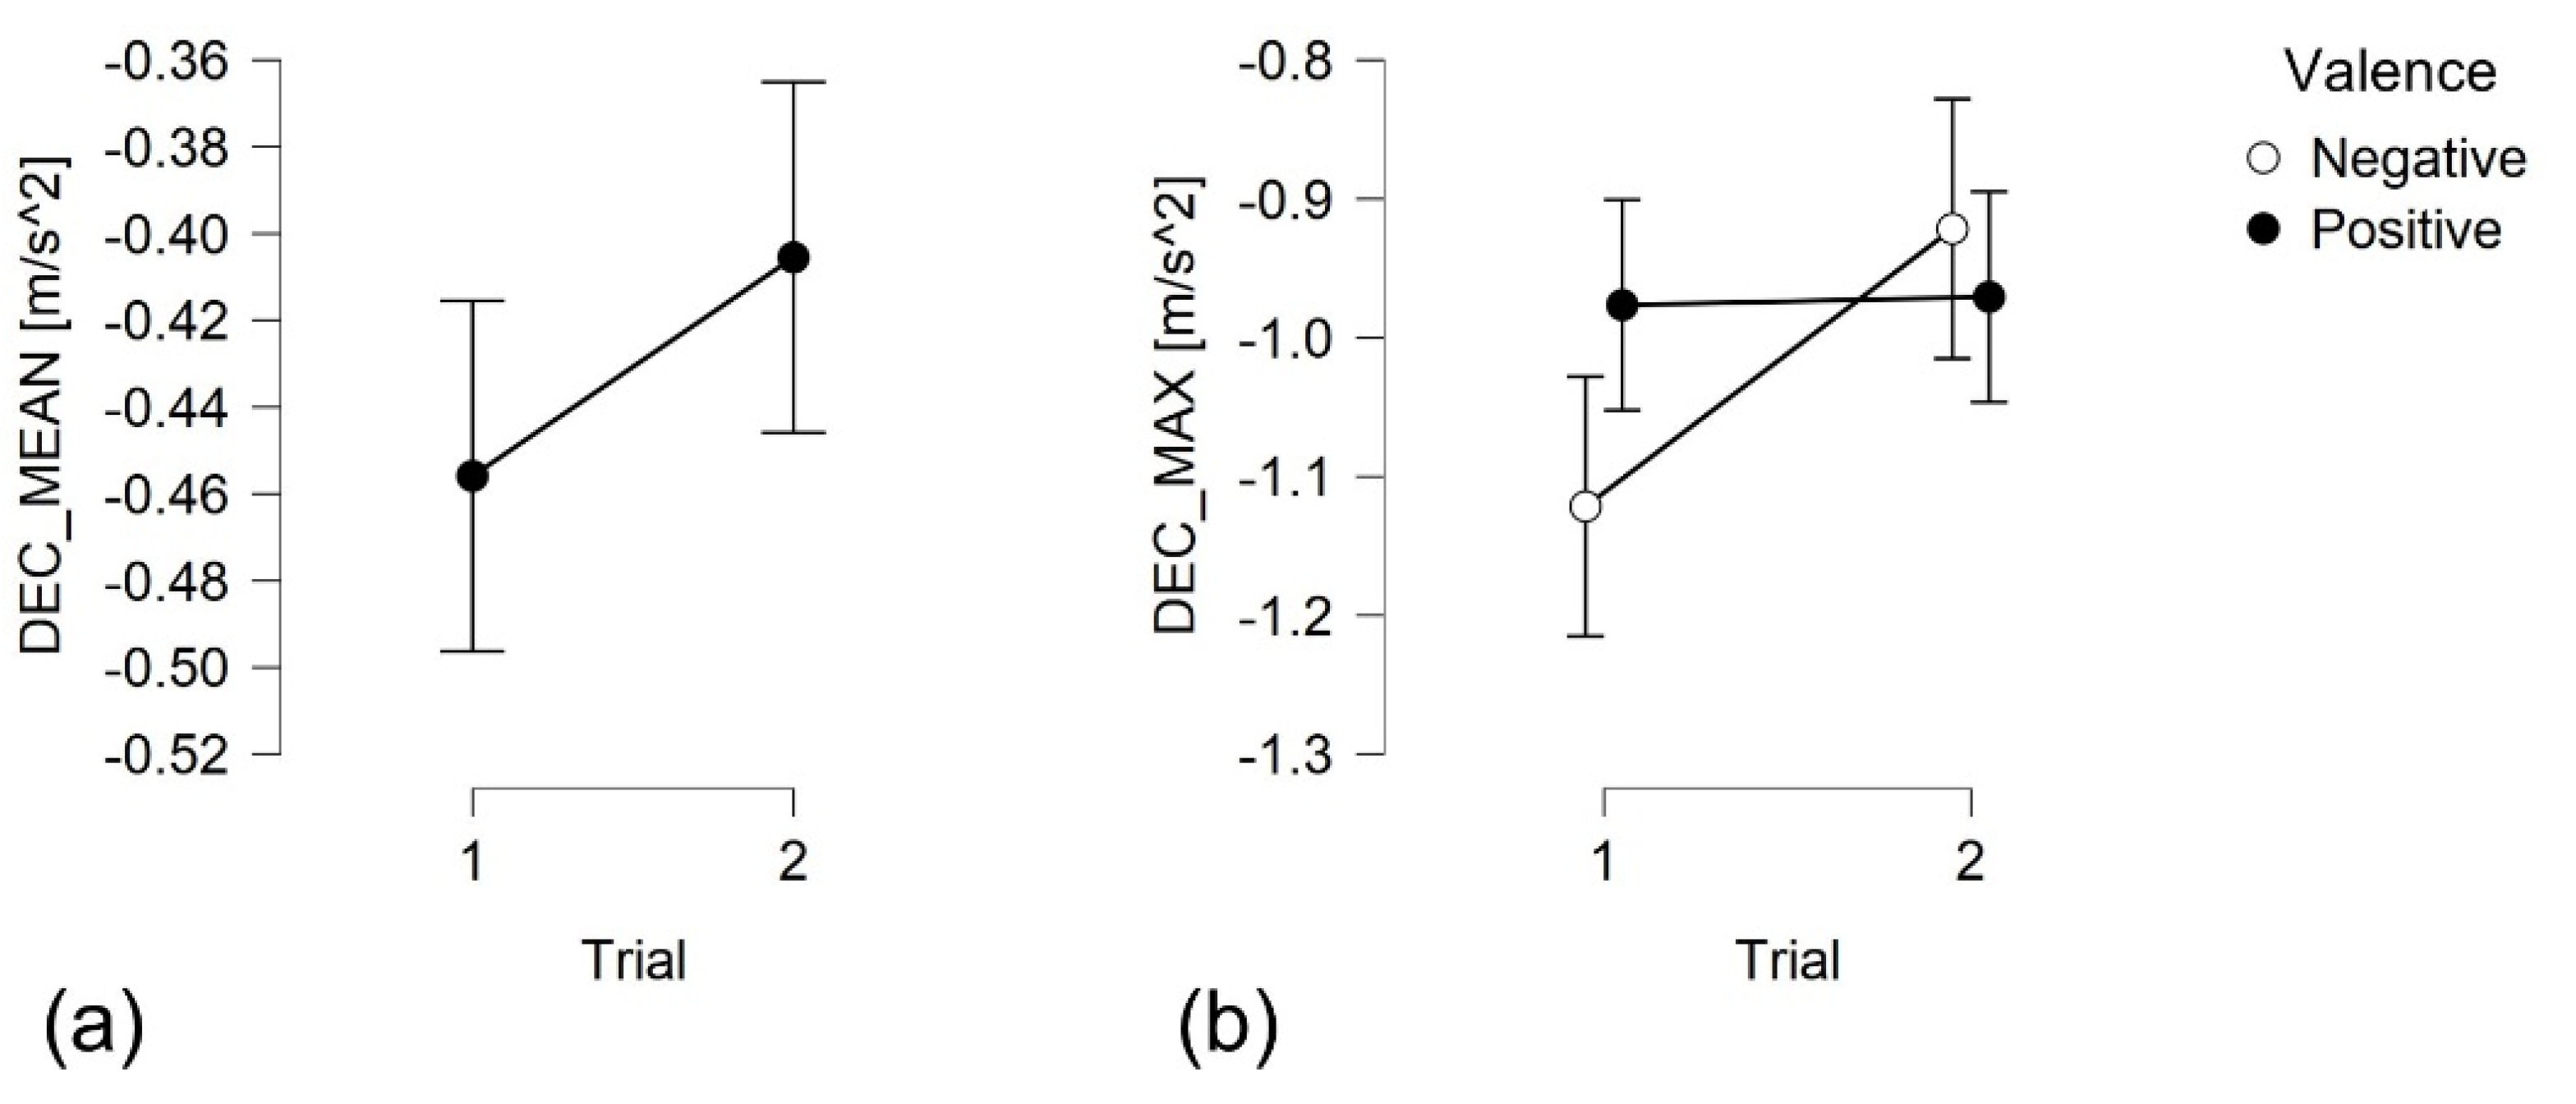 Figure 5. Mixed ANOVA results. Circles represent mean values, bars the 95% confidence intervals. (a) Trial effect on mean deceleration; (b) Trial and Feedback valence effects on maximum deceleration.
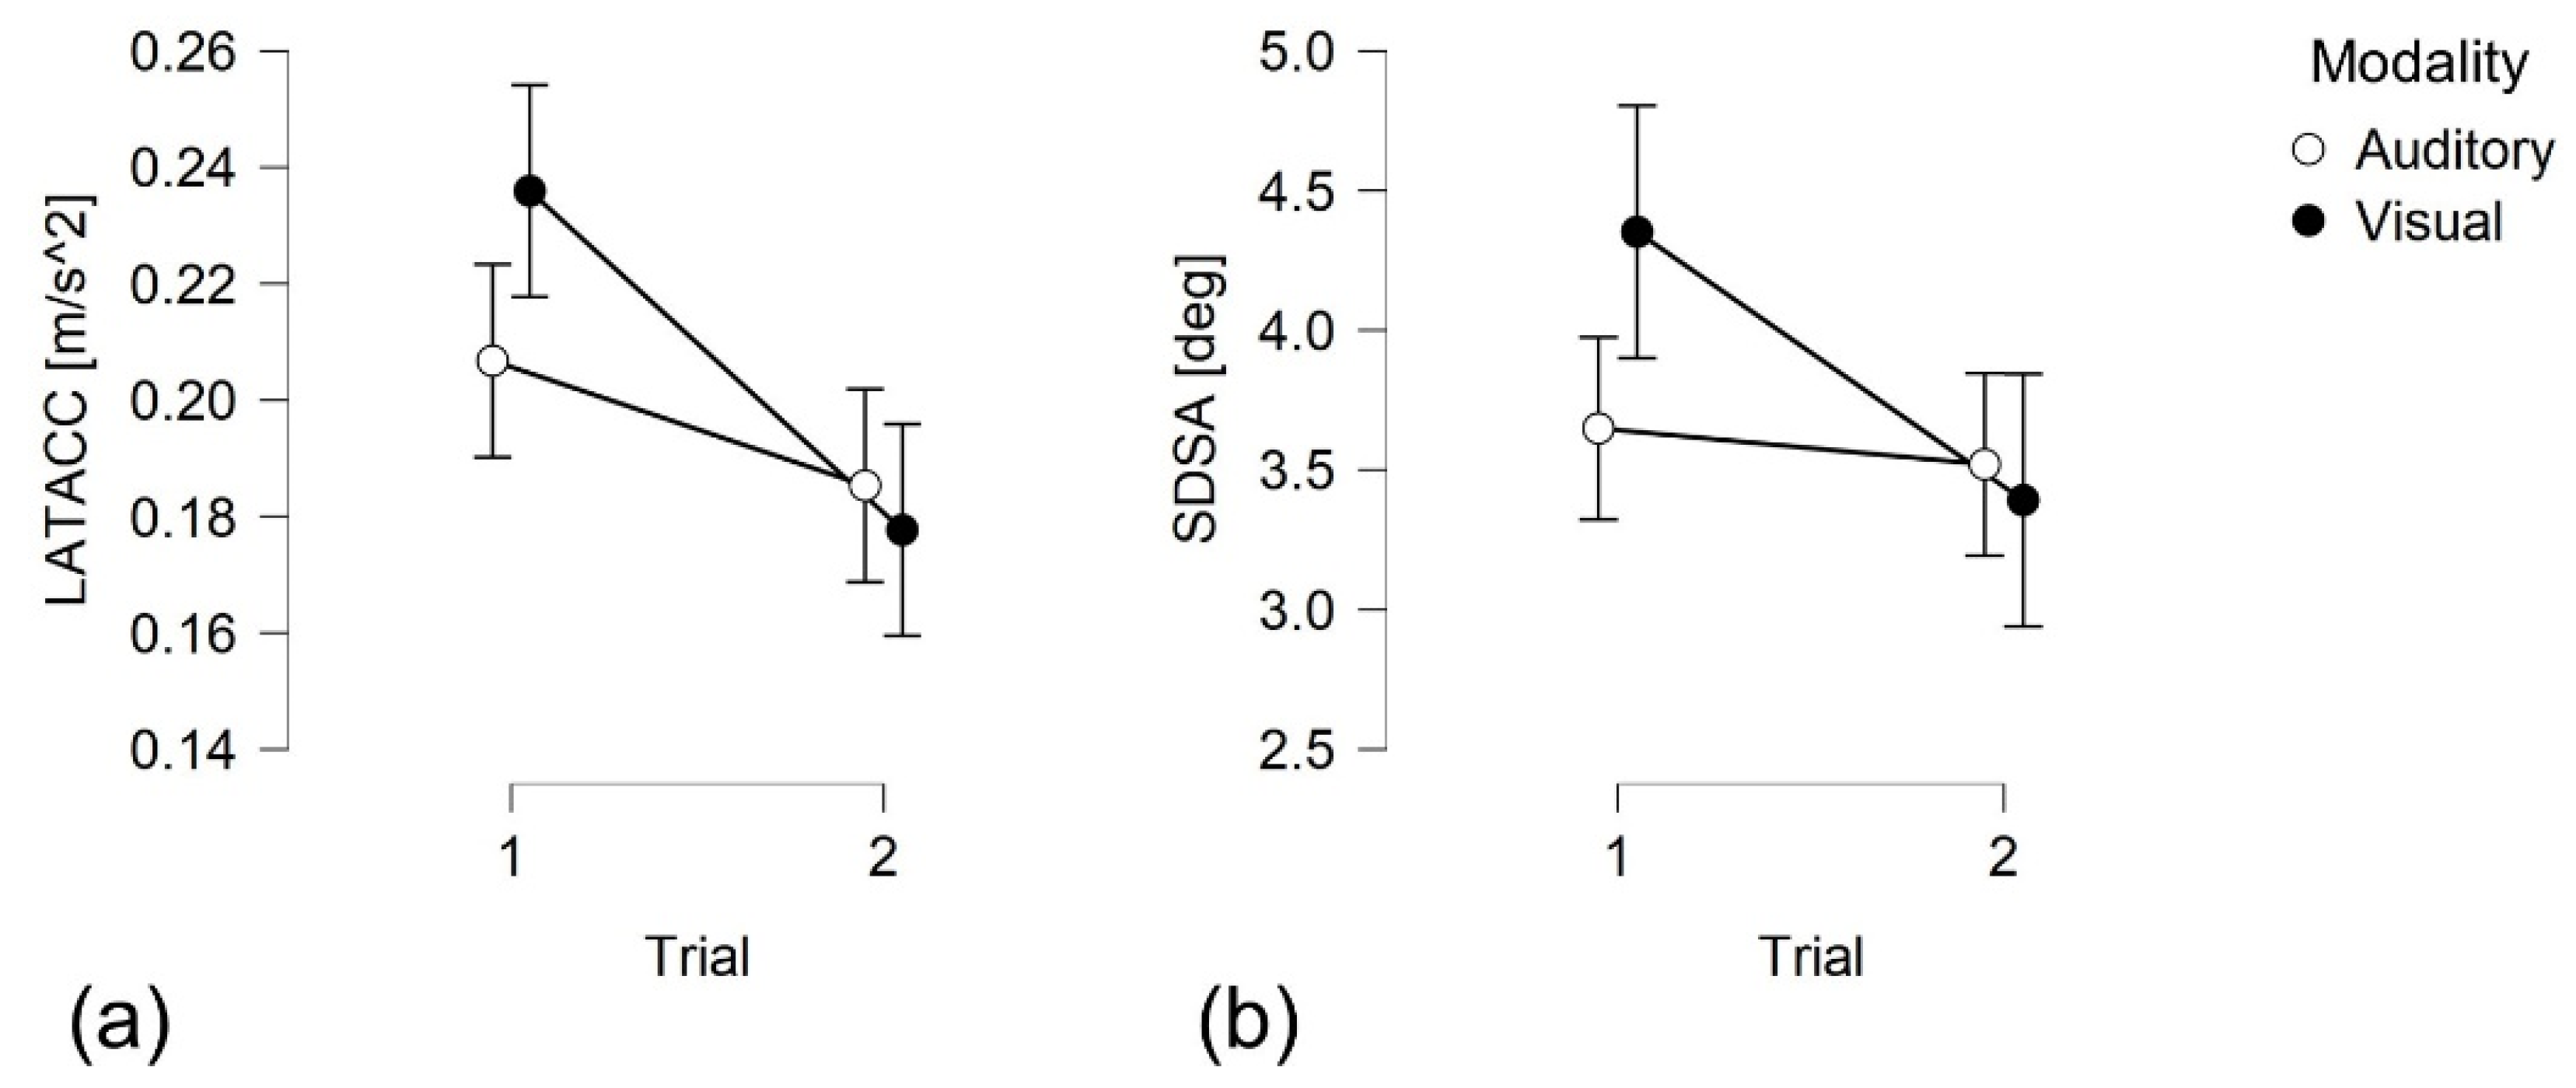 Figure 7. Mixed ANOVA results. Circles represent mean values, bars the 95% confidence intervals. Trial and Feedback modality effects on: (a) mean lateral acceleration (LATACC); (b) standard deviation of steering angle (SDSA).
3. Conclusions
We investigated the impact of a motor insurance real-time coaching program on drivers’ behavior on highway deceleration lanes. Data were collected with a driving simulator experiment, and the analyses involved several kinematic variables.
The main result is that the tested real-time coaching programs were able to significantly improve the safety of the exit maneuver from the highway, with participants reducing their speed both approaching and using the deceleration lane, decelerating more smoothly and with higher lateral control. This also allowed some drivers, characterized by a “defensive” driving style, to modify their exit strategy by entering the deceleration lane before starting the deceleration, instead of doing the opposite (which is both a safety and an operational issue). Finally, no significant effect of feedback modality and valence was observed on most of the investigated variables.
These results have a potentially relevant practical interest because they suggest that it is possible to improve driving behavior with a very simple general purpose feedback system that depends only on a fixed acceleration/deceleration threshold. They also suggest that developing real-time coaching systems, primarily aimed at increasing the smoothness of driving style, could also produce additional benefits in specific and seemingly unrelated situations, as also shown in previous works [17].
This entry is adapted from the peer-reviewed paper 10.3390/su13169089
References
- Torbic, D.J.; Hutton, J.M.; Bokenkroger, C.D.; Harwood, D.W.; Gilmore, D.K.; Knoshaug, M.M.; Ronchetto, J.J.; Brewer, M.A.; Fitzpatrick, K.; Chrysler, S.T.; et al. NCHRP Report 730: Design Guidance for Freeway Mainline Ramp Terminals; National Cooperative Highway Research Program, Transportation Research Board: Washington, DC, USA, 2012; ISBN 9780309258548.
- Lundy, R.A. The effect of ramp type and geometry on accidents. Highw. Res. Rec. 1967, 163, 80–119.
- McCartt, A.T.; Northrup, V.S.; Retting, R.A. Types and characteristics of ramp-related motor vehicle crashes on urban interstate roadways in Northern Virginia. J. Saf. Res. 2004, 35, 107–114.
- Lord, D.; Bonneson, J.A. Calibration of predictive models for estimating safety of ramp design configurations. Transp. Res. Rec. 2005, 1908, 88–95.
- Bared, J.; Giering, G.L.; Warren, D.L. Safety evaluation of acceleration and deceleration lane lengths. ITE J. 1999, 69, 50–54.
- Chen, H.; Zhou, H.; Lin, P.-S. Freeway deceleration lane lengths effects on traffic safety and operation. Saf. Sci. 2014, 64, 39–49.
- Papadimitriou, E.; Theofilatos, A. Meta-analysis of crash-risk factors in freeway entrance and exit areas. J. Transp. Eng. Part A Syst. 2017, 143, 04017050.
- Calvi, A.; Benedetto, A.; De Blasiis, M. A driving simulator study of driver performance on deceleration lanes. Accid. Anal. Prev. 2012, 45, 195–203.
- Calvi, A.; Bella, F.; D’Amico, F. Diverging driver performance along deceleration lanes: Driving simulator study. Transp. Res. Rec. J. Transp. Res. Board 2015, 2518, 95–103.
- Calvi, A.; Bella, F.; D’Amico, F. Evaluating the effects of the number of exit lanes on the diverging driver performance. J. Transp. Saf. Secur. 2016, 10, 105–123.
- Calvi, A.; D’Amico, F.; Ferrante, C.; Bianchini Ciampoli, L. A driving simulator validation study for evaluating the driving performance on deceleration and acceleration lanes. Adv. Transp. Stud. 2020, 50, 67–80.
- Lyu, N.; Cao, Y.; Wu, C.; Xu, J.; Xie, L. The effect of gender, occupation and experience on behavior while driving on a freeway deceleration lane based on field operational test data. Accid. Anal. Prev. 2018, 121, 82–93.
- El-Basha, R.H.S.; Hassan, Y.; Sayed, T.A. Modeling freeway diverging behavior on deceleration lanes. Transp. Res. Rec. J. Transp. Res. Board 2007, 2012, 30–37.
- Fukutome, I.; Moskowitz, K. Traffic behavior and off-ramp design. Highw. Res. Rec. 1963, 21, 17–31.
- Rossi, R.; Tagliabue, M.; Gastaldi, M.; De Cet, G.; Freuli, F.; Orsini, F.; Di Stasi, L.L.; Vidotto, G. Reducing elevated gravitational-force events through visual feedback: A simulator study. Transp. Res. Procedia 2021, 52, 115–122.
- Simons-Morton, B.G.; Zhang, Z.; Jackson, J.C.; Albert, P.S. Do elevated gravitational-force events while driving predict crashes and near crashes? Am. J. Epidemiol. 2012, 175, 1075–1079.
- Rossi, R.; Orsini, F.; Tagliabue, M.; Di Stasi, L.L.; De Cet, G.; Gastaldi, M. Evaluating the impact of real-time coaching programs on drivers overtaking cyclists. Transp. Res. Part F Traffic Psychol. Behav. 2021, 78, 74–90.
- Van Beinum, A.; Farah, H.; Wegman, F.; Hoogendoorn, S. Driving behaviour at motorway ramps and weaving segments based on empirical trajectory data. Transp. Res. Part C Emerg. Technol. 2018, 92, 426–441.
- Adell, E.; Vaárhelyi, A.; Alonso, M.; Plaza, J. Developing human–machine interaction components for a driver assistance system for safe speed and safe distance. IET Intell. Transp. Syst. 2008, 2, 1–14.
- Cabral, J.P.; Remijn, G.B. Auditory icons: Design and physical characteristics. Appl. Ergon. 2019, 78, 224–239.
- Cao, Y.; Mahr, A.; Castronovo, S.; Theune, M.; Stahl, C.; Müller, C.A. Local danger warnings for drivers: The effect of modality and level of assistance on driver reaction. In Proceedings of the International Conference on Intelligent User Interfaces, Hong Kong, China, 7–10 February 2010; pp. 239–248.
- Harbeck, E.; Glendon, A.I.; Hine, T.J. Reward versus punishment: Reinforcement sensitivity theory, young novice drivers’ perceived risk, and risky driving. Transp. Res. Part F Traffic Psychol. Behav. 2017, 47, 13–22.
This entry is offline, you can click here to edit this entry!