Artemisia-AgNPs Applicaton in cancer nanomedicine: History
Please note this is an old version of this entry, which may differ significantly from the current revision.
Subjects: Oncology
Contributor:

The fight against cancer is one of the main challenges for medical research. Recently, nanotechnology has made significant progress, providing possibilities for developing innovative nanomaterials to overcome the common limitations of current therapies. In this context, silver nanoparticles (AgNPs) represent a promising nano-tool able to offer interesting applications for cancer research. Following this path, we combined the silver proprieties with Artemisia arborescens characteristics, producing novel nanoparticles called Artemisia–AgNPs. A “green” synthesis method was performed to produce Artemisia–AgNPs, using Artemisia arborescens extracts. Several biological assays were performed to evaluate the Artemisia–AgNPs anti-cancer properties. 

  • ancer research
  • nanotechnology
  • silver nanoparticles
  • Artemisia arborescens
  • RNA-seq

Note: The following contents are extract from your paper. The entry will be online only after author check and submit it.

1. Introduction

Nowadays, cancer incidence is rapidly increasing, and it is considered to be the second most common cause of death worldwide [1]. Cancer is a group of diseases defined by a high proliferation index and alteration of several physiological cellular mechanisms. The main therapeutic treatments currently used are surgery, radiotherapy and chemotherapy. These treatments can lead to common complications, including severe side effects, incomplete tumor resection, and development of resistance [2][3]. Cancer nanomedicine is emerging as a new research field with the aim of offering potential nano-tools for oncological applications. The final goal of cancer nanomedicine is to provide early detection of tumors, accurate diagnoses, and personalized therapy [4][5]. The principal advantage of cancer nanomedicine consists of exploiting nano-sized particles that are able to act at a molecular level, on the road to more personalized medicine. In the last few years, several nanoparticles have been studied for cancer diagnosis and treatment, such as carbon nanotubes [6], paramagnetic nanoparticles [7], liposomes [8], gold nanoparticles [9], and many others [10]. Silver nanoparticles (AgNPs), thanks to their interesting physical-chemical properties, are becoming of great interest in cancer research. Silver is a noble metal with attractive biological properties, including anti-bacterial and anti-mycotic activities. Recently, some studies have shown that a large number of silver compounds have many effects on cancer cells [11]. Silver exhibits low toxicity but, at the same time, poor bioavailability due to the effective physiological mechanism of detoxification of the human body. Therefore, AgNPs represent an excellent solution to avoid this problem. Indeed, AgNPs can be internalized by cells through endocytosis and other up-take mechanisms, releasing Ag+ ions, which are the reactive species of silver, at the target sites [12]. Several studies have shown that AgNPs induce cytotoxicity through reactive oxygen species [13]. Nevertheless, to better understand the biological mechanism of AgNPs, further investigation is needed.
In the last few years, “green” synthesis is emerging as an alternative method to produce AgNPs. This approach is easy, inexpensive, and eco-friendly, since it is based on biosynthesis from plants, bacteria, and fungi extracts [14]. The “green” procedure involves the addition of a silver salt, commonly silver nitrate (AgNO3), to plant extracts so that the biomolecules present in the solution can reduce silver ions into metal nanoparticles. The main biomolecules implicated in this reaction are terpenoids, polyphenols, enzymes, and proteins. The shape and the dimensions of nanoparticles are influenced by the origin of the extracts, the temperature, and the pH of the solution. These characteristics affect the biological responses of AgNPs [15]. Moreover, biomolecules are present in the reaction medium, especially proteins and enzymes, which are then distributed on the surface of the particles as a layer called the “capping”. In addition, the capping influences the biological activity of AgNPs. Indeed, as suggested by several studies, nanoparticles presenting capping on their surface are more biocompatible compared to those that do not. The “capped” nanoparticles have shown less cytotoxicity but appear to be more efficient compared to “naked” nanoparticles [16][17].

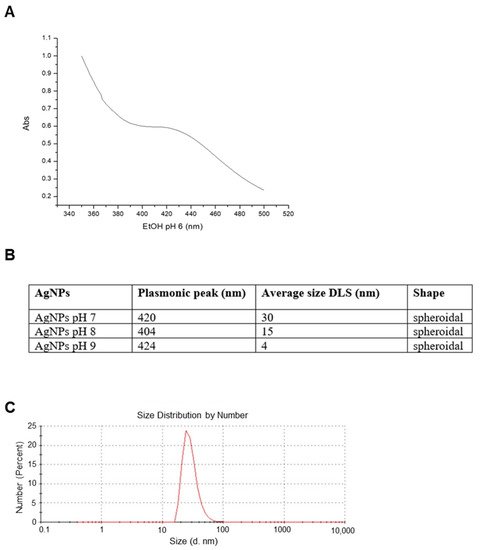
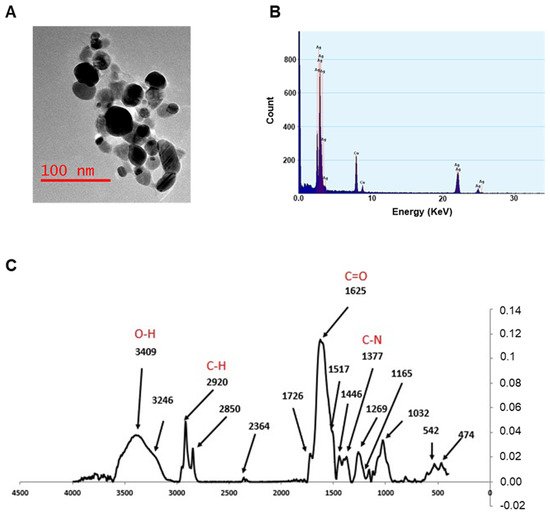
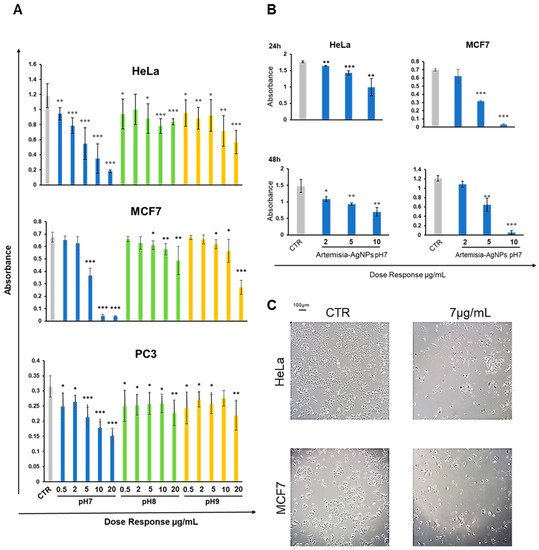
2. Nanoparticles Characterization and XTT Analysis

Size is a fundamental factor in determining the biological activity of nanoparticles. In general, it has been observed that the smaller the size, the higher the activity [18]. Nevertheless, very small particles can exert toxic effects on cells: sometimes nanoparticles below 10 nm are not suitable for biological experiments because they can, for instance, cause hemolysis [19]. Nevertheless, the presence of capping on their surface can easily modulate their activity, making them less toxic and more active and biocompatible. Therefore, it is important to find a balance between activity and toxicity by tuning the dimensions of the nanoparticles. A good way to do this is to control the pH of the solution in which the nanoparticles are synthesized, knowing that in general higher pH corresponds to smaller particles [20]. Consequently, a procedure already in use was modified to control the dimension of the AgNPs by tuning the pH in solution [21]. Hence, three different batches of Artemisia–AgNPs have been prepared at distinct pH values (7, 8, and 9) in order to examine whether, as expected, the pH change was able to modify their size, but also to influence their capping and, therefore, their biological behavior. Ultracentrifugation at 13,000 rpm was introduced to increase the yield of the recovered AgNPs and to shorten the workout procedure, significantly improving the synthetic process.
A full characterization of the AgNPs was carried out in order to study their structural features. UV-vis spectra showed a plasmonic peak around 420 (Figure 1A), suggesting a spheroidal shape for these nanoparticles with a probable size between 10 and 30 nm [22]. DLS analysis showed that the size distribution of AgNPs changed according to the pH of the reaction solution. As expected, an increase in the pH determined a decrease in the hydrodynamic radius [23], which turned out to be around 30 nm for AgNPs at pH 7 (Figure 1B), around 15 nm for AgNPs at pH 8, and around 4 nm for AgNPs at pH 9. Measurements taken after weeks from their synthesis evidenced that the dimensions remained constant over time, indicating that these particles are rather stable.
Figure 1. Artemia-AgNPs characterization. (A) Table indicating the major properties of all three nanoparticles. (B) Selected UV-vis spectrum for AgNPs at pH 7 showing the plasmonic peak at 420 nm. (C) Selected DLS measurements for AgNPs at pH 7.
TEM analysis confirms the information on the size and morphology of the AgNPs, which were, in almost all cases, spheroidal in shape, with average dimensions well below 50 nm. The TEM image shown in Figure 2A displays the morphology of the nanoparticles obtained at pH 7, characterized by a spheroidal shape and no aggregation in water. EDX profile was used to evaluate the elemental structure of the nanoparticles (Figure 2B), underlining their silver composition. The other elements presented in the spectra are due to the holey carbon/copper grid used.
Figure 2. TEM analysis, EDX profile, and FTIR measurements. (A) TEM image for AgNPs at pH 7. (B) EDX profile showing the presence of elemental Ag (Cu signals are due to the grid used). (C) FTIR spectra of AgNPs synthesized at pH 7. Spectra were acquired in the range 400–4000 cm−1.
The FTIR measurements were performed by recording the signals in the range of 400–4000 cm−1 with a resolution of 4 cm−1, in order to acquire more information on the capping molecules. FTIR spectra from all samples were almost identical, indicating an analogous composition (Figure 2C). The bands observed suggest that amines, proteins, or (poly)phenolic compounds of Artemisia leaf extracts may be involved in the formation of the capping. A broad band from 3100 to 3600 cm−1 incorporates both OH and NH stretching frequencies, while the signals around 2900 cm−1 can be attributed to the sp3 CH stretching mode of hydrocarbon moieties, and those between 1630 (νC=O) and 1000 cm−1 are most probably due to amidic compounds (i.e., proteins and enzymes) or amines.
The characterization of the three batches of AgNPs showed that, while they were all spheroidal in shape and shared the same capping molecules, the pH at which they were obtained was actually able to influence their dimensions, with a higher pH corresponding with smaller nanoparticles as expected.
To check the antitumor effects of our AgNPs, we treated different cell cancer lines (HeLa, MCF-7 and PC3) with increasing doses (from 0.5 to 20 µg/mL) of Artemisia–AgNPs (pH 7, pH 8 and pH 9) in order to evaluate cell viability by XTT assay. We observed a dose-dependent anti-proliferative effect of Artemisia–AgNPs. The decrease in viability was more relevant for the Artemisia–AgNPs pH7 compared to the others, with a decrease in cell viability in a dose dependent manner (Figure 3A). Other studies demonstrated the ability of AgNPs to inhibit cell proliferation, inducing cell death [24][25]. Moreover, it was shown that the cytotoxic action is influenced by size and surface area of AgNPs [26]. Regarding the distinct action of AgNPs due to the different sizes, recent evidence suggests that the appropriate size for cellular uptake, in order to achieve the greatest biological activity of nanoparticles without the risk of hemolysis, is around 40–50 nm [27].
Figure 3. XTT assay. (A) HeLa, MCF-7, and PC3 were treated with increasing doses (0.5–20 µg/mL) of each Artemisia–AgNPs (pH 7, pH 8, and pH 9). An XTT assay was performed to evaluate cell viability. (B) XTT assay of Artemisia–AgNPs pH7 on HeLa and MCF-7. HeLa and MCF-7 were cultured with 2, 5, and 10 µg/mL of Artemisia–AgNPs pH 7. Cell viability was evaluated using XTT assay. (C) Microscope images. HeLa and MCF-7 treated for 24 h with 7 µg/mL of Artemisia–AgNPs pH 7. Data were analyzed using Student’s t test, * = p value < 0.05, ** = p value < 0.01, *** = p value < 0.001.
Moreover, as reported in Figure 3A, the anti-proliferative activity of Artemisia–AgNPs pH7 is more evident on HeLa and MCF-7 compared to PC3 (Figure 3A). In accordance with our results, Sadegh et al. observed that AgNPs synthesized using green synthesis showed more selective activity against an MCF-7 cell line [28].
Based on these data, we selected Artemisia–AgNPs pH7 for further analysis in order to clarify their specific effects on HeLa and MCF-7. Therefore, to validate the cytotoxic effects, XTT assay was repeated at 24 h and 48 h, using concentrations of 2, 5, and 10 µg/mL of Artemisia–AgNPs pH 7. As showed in Figure 3B, Artemisia–AgNPs pH7 revealed a high anti-proliferative effect, especially at the concentration between 5 and 10 µg/mL. Thereby, for the following experiments, we considered 7 µg/mL of Artemisia–AgNPs pH7 to be the ideal concentration to significantly reduce cell viability. The microscope images in Figure 3C clearly show the cells after 24 h of treatment with 7 µg/mL of Artemisia–AgNPs pH7. Compared to the control, most cells suffered when detached from the plate and died after treatment.

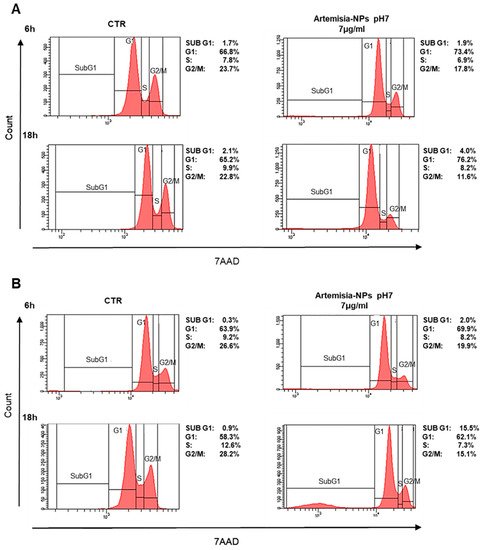
3. Cell Cycle Impact

In order to evaluate the impact on the cell cycle, cells were treated with 7 µg/mL of Artemisia–AgNPs for 6 h and 18 h. Interestingly, a significant reduction in the number of HeLa cells in G2/M phase was found after only 6 h of treatment in comparison to control samples (Figure 4A). At 18 h of incubation, the arrest of cells in the G0/G1 phase was evident (Figure 4A). Similar results were found in MCF-7 cell lines treated with Artemisia–AgNPs (Figure 4B). Especially, after 18 h of incubation, the percentage of cells in the G2/M phase strongly decreased in association with an increase in G0/G1 phase. Moreover, we observed a relevant increment of the SubG1 phase, an index of cellular death (Figure 4B). The impact on cell cycle of cancer cells mediated by AgNPs was analyzed by other studies. The exposition to 10–50 μg/mL of AgNPs for 24 h determined a relevant increase in the SubG1 population on HeLa cells and cells were not able to go through G2 checkpoint [29]. In contrast to our results, other authors studied AgNPs on lung epithelial cells and glioblastoma cells, observing an increase in G2/M-phase cells accompanied by a decrease in the G1 population after treatment [30]. This divergence in cell cycle data may be due to different factors including cell lines, distinct synthesis of AgNPs, and presence of capping able to change the biological behaviors of AgNPs. Nonetheless, further investigations are needed to better understand the cell cycle effects mediated by AgNPs.
Figure 4. Cell cycle analysis. (A) HeLa cells were treated with 7 µg/mL of Artemisia–AgNPs pH 7 or left untreated. The cell cycle was evaluated after 6 h and 18 h by flow cytometry. (B) MCF-7 cells were treated to the same condition as HeLa and cell cycle effects were evaluated by flow cytometry.

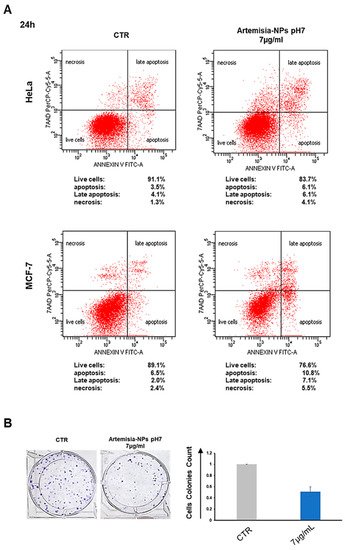
4. Artemisia–AgNPs Induce Apoptosis and Inhibit Colony Formation in Cancer Cells

Following cell cycle analysis, in order to discriminate between apoptotic and necrotic cells, an Annexin V/7aad assay was performed. To enhance the dead cell number, cells were incubated for 24 h with 7 µg/mL of Artemisia–AgNPs pH7. We determined that Artemisia–AgNPs induced significant apoptotic effects in both cell lines, with a slight increment of necrotic cells (Figure 5A). In line with our data, various studies have demonstrated the ability of AgNPs to induce apoptosis in several cancer cell lines [31][32]. In any case, treatment with high doses of AgNPs may lead to a prevalent necrotic effect [33].
Figure 5. Apoptosis and cell colony formation assays. (A) Apoptosis/Necrosis assay. On the left control samples, while on the right samples treated with 7 µg/mL of Artemisia–AgNPs pH 7. Above HeLa cells and below MCF-7 cells. Cells were stained with Annexin V/7aad and analyzed by flow cytometry. (B) Clonogenic assay. After the formation of the first colonies, cells were treated with 7 µg/mL of Artemisia–AgNPs pH 7. Cell colonies were stained and counted.
Moreover, we employed a clonogenic assay to assess the ability of Artemisia–AgNPs pH7 to arrest cell colony formation. Figure 5B clearly shows the clonal growth inhibition mediated by 7 µg/mL of Artemisia–AgNPs pH7.

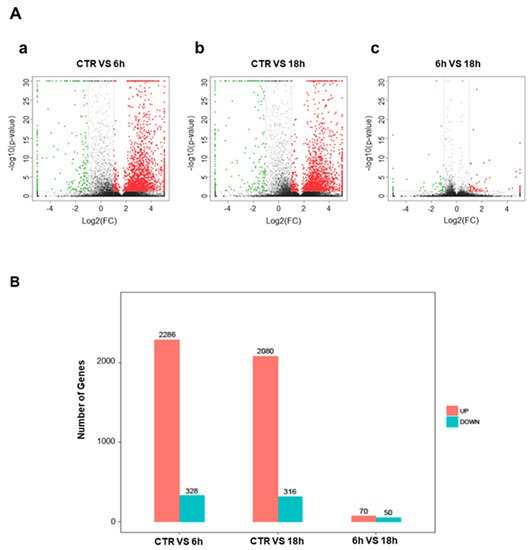
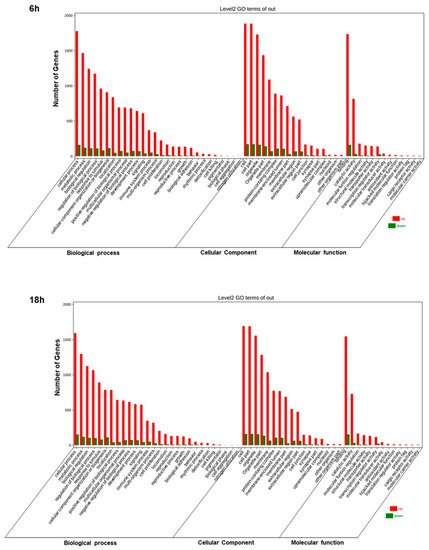
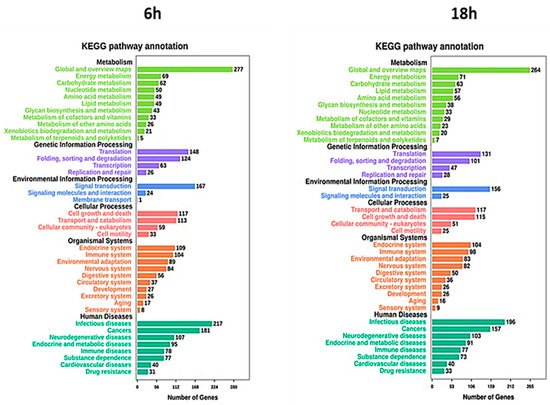
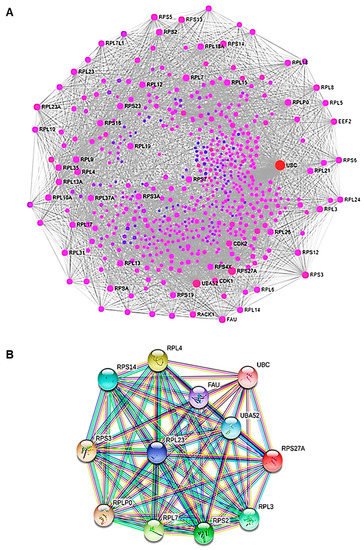
5. Artemisia–AgNPs Impact on Gene Expression

To elucidate the mechanism of action of Artemisia–AgNPs, we performed RNA-sequencing on HeLa cells in order to have a wide overview of the impact on gene expression. After 6 h and 18 h of treatment, we observed several differentially expressed genes (DEGs), using parameter the log2 fold-change values and p-values as reference indicators for significant difference (Figure 6A). Figure 6B shows in detail the gene variations: 2286 up-regulated and 328 down-regulated genes after 6 h of treatment, while after 18 h of treatment 2080 up-regulated and 316 down-regulated genes are shown.
Figure 6. Differentially expressed genes. (A) Volcanic map of differential genes. The DEGs set after 6 h and 18 h of Artemisia–AgNPs treatment. Red dots indicate up-regulated genes, green dots represent down-regulated genes, and black dots indicate genes with no significant difference. (|logFC| ≥ 2 and p value < 0.05). a: CTR vs. 6 h; b: CTR vs. 18 h; c: 6 h vs. 18 h. (B) Histogram of differential genes. The DEGs set disturbed by Artemisia–AgNPs treatment (|logFC| ≥ 2 and p value < 0.05).
Afterward, we employed OmicShare tools, an online software, for the gene ontology (GO) analysis, enabling the study of the functions of the differentially expressed genes (DEGs). In detail, through these tools it is possible to evaluate the cellular components, biological processes, and molecular functions correlated with DEGs. We found similar results at 6 h and 18 h. Artemisia–AgNPs appear to work at an intracellular level, with enriched genes mainly expressed in organelles and their membranes (Figure 7). Regarding the biological processes, the main up-regulated genes were correlated with metabolic processes and biological regulation. The molecular functions of DEGs were mainly involved in binding, catalytic activity, and molecular function regulator.
Figure 7. GO analysis. GO annotation for 6 h and 18 h of treatments of DEGs. The number of enriched genes is presented.
To further characterize the differentially expressed genes, investigating the metabolic and signal transduction pathways involved, KEGG pathway analysis was performed. The analysis showed a strong association between DEGs and cellular metabolism, translation, and folding processes (Figure 8). Moreover, several DEGs were also correlated with signal transduction and cell growth and death. Regarding human diseases, the DEGs correlated with Artemisia–AgNPs treatment are mainly enriched in infections and cancers.
Figure 8. KEGG analysis. The pathways involved in the DEGs were analyzed using KEGG analysis. The number of enriched genes and pathway terms are presented.
To investigate the protein–protein interaction (PPI) network, we used an online mapping tool (NetworkAnalyst3.0) (Figure 9A). The PPI network analysis led to the evaluation of the top 15 genes, classified as hub genes by degree. The following are the names of the hub genes: UBC, UBA52 (over-expressed during hepatoma cell apoptosis), RPS27A (cell malignant transformation), RPS3 (cell apoptosis regulation), FAU (down-regulated in human prostate, breast, and ovarian cancers), RPL7 (cell apoptosis regulation), RPL23A, RPL4 (self-translation regulation—E. coli), RPLP0 (tumor progression, invasion, metastasis), RPS5, RPL9, RPS14, RPS2, RPL3, and RPL23. These genes encode for ubiquitin-ribosomal proteins, which are involved in a variety of biological events, including cellular mechanisms correlated with cancer formation and progression. Ubiquitin is a highly conserved regulatory protein that covalently binds proteins, leading to post-translational modification of proteins. Ubiquitination is a crucial event for cell cycle progression and cell proliferation. Alterations of this process are associated with cancer development [34]. In order to clarify the association between the hub genes, we also performed a PPI analysis of the hub genes (Figure 9B). Therefore, through the functional and pathway enrichment analysis, we identified the involvement of these 15 hub genes in several biological processes, including regulation of gene expression, DNA damage response, genome nucleotide-excision repair, and in ribosomes (Table 1).
Figure 9. PPI analysis. (A) The PPI network of DEGs. The nodes represent the differential genes and the connections between the nodes reveal the interactions between the genes. The size of the nodes indicates the degree of the genes, and the different colors represent the distinct gene expression (red are up-regulated genes and violet are less up-regulated). (B) The PPI network of hub genes. Co-expression network with top hub DEGs.
Table 1. The top 15 hub genes enrichment with GO and KEGG.
Category Term Description Gene Count p Value
Biological Process (GO) GO:0010629 Negative regulation of gene expression 12 2.33 × 10⁻¹²
Biological Process (GO) GO:0090304 Nucleic acid metabolic process 12 5.05 × 10⁻⁸
Biological Process (GO) GO:00427969 DNA demage response, detection of DNA demage 4 9.62 × 10⁻⁸
Biological Process (GO) GO:0042276 Error-prone translesion synthesis 4 2.46 × 10⁻⁶
Biological Process (GO) GO:0006297 Nucleotide-excision repair, DNA gap filling 3 3.52 × 10⁻⁶
Biological Process (GO) GO:0070911 Global genome nucleotide-excision repair 3 4.76 × 10⁻⁶
Biological Process (GO) GO:0000122 Negative regulation of transcription by RNA polymerase II 5 1.05 × 10⁻³
KEGG_PATHWAY Hsa03010 Ribosome 11 2.96 × 10⁻²⁰

This entry is adapted from the peer-reviewed paper 10.3390/ijms22168621

References

  1. Bray, F.; Ferlay, J.; Soerjomataram, I.; Siegel, R.L.; Torre, L.A.; Jemal, A. Global cancer statistics 2018: GLOBOCAN estimates of incidence and mortality worldwide for 36 cancers in 185 countries. CA Cancer J. Clin. 2018, 68, 394–424.
  2. Dobbelstein, M.; Moll, U. Targeting tumour-supportive cellular machineries in anticancer drug development. Nat. Rev. Drug Discov. 2014, 13, 179–196.
  3. Arruebo, M.; Vilaboa, N.; Sáez-Gutierrez, B.; Lambea, J.; Tres, A.; Valladares, M.; González-Fernández, Á. Assessment of the evolution of cancer treatment therapies. Cancers 2011, 3, 3279–3330.
  4. Tran, S.; DeGiovanni, P.; Piel, B.; Rai, P. Cancer nanomedicine: A review of recent success in drug delivery. Clin. Transl. Med. 2017, 6, 44.
  5. Shi, J.; Kantoff, P.W.; Wooster, R.; Farokhzad, O.C. Cancer nanomedicine: Progress, challenges and opportunities. Nat. Rev. Cancer 2017, 17, 20–37.
  6. Ji, S.R.; Liu, C.; Zhang, B.; Yang, F.; Xu, J.; Long, J.; Jin, C.; Fu, D.L.; Ni, Q.X.; Yu, X.J. Carbon nanotubes in cancer diagnosis and therapy. Biochim. Biophys. Acta 2010, 1806, 29–35.
  7. Gobbo, O.L.; Sjaastad, K.; Radomski, M.W.; Volkov, Y.; Prina-Mello, A. Magnetic Nanoparticles in Cancer Theranostics. Theranostics 2015, 5, 1249–1263.
  8. Deshpande, P.P.; Biswas, S.; Torchilin, V.P. Current trends in the use of liposomes for tumor targeting. Nanomedicine 2013, 8, 1509–1528.
  9. Sztandera, K.; Gorzkiewicz, M.; Klajnert-Maculewicz, B. Gold Nanoparticles in Cancer Treatment. Mol. Pharm. 2019, 16, 1–23.
  10. Grodzinski, P.; Silver, M.; Molnar, L.K. Nanotechnology for cancer diagnostics: Promises and challenges. Expert Rev. Mol. Diagn. 2006, 6, 307–318.
  11. Medici, S.; Peana, M.; Crisponi, G.; Nurchi, V.M.; Lachowicz, J.I.; Remelli, M.; Zoroddu, M.A. Silver coordination compounds: A new horizon in medicine. Coord. Chem. Rev. 2016, 327, 349–359.
  12. Foroozandeh, P.; Aziz, A.A. Insight into Cellular Uptake and Intracellular Trafficking of Nanoparticles. Nanoscale Res. Lett. 2018, 13, 339.
  13. Dayem, A.A.; Hossain, M.K.; Lee, S.B.; Kim, K.; Saha, S.K.; Yang, G.M.; Choi, H.Y.; Cho, S.G. The Role of Reactive Oxygen Species (ROS) in the Biological Activities of Metallic Nanoparticles. Int. J. Mol. Sci. 2017, 18, 120.
  14. Ahmed, S.; Ahmad, M.; Swami, B.L.; Ikram, S. A review on plants extract mediated synthesis of silver nanoparticles for antimicrobial applications: A green expertise. J. Adv. Res. 2016, 7, 17–28.
  15. Albanese, A.; Tang, P.S.; Chan, W.C. The effect of nanoparticle size, shape, and surface chemistry on biological systems. Annu. Rev. Biomed. Eng. 2012, 14, 1–16.
  16. Rajabnia, T.; Meshkini, A. Fabrication of adenosine 5′-triphosphate-capped silver nanoparticles: Enhanced cytotoxicity efficacy and targeting effect against tumor cells. Process Biochem. 2018, 65, 186–196.
  17. Bhunia, A.K.; Samanta, P.K.; Aich, D.; Saha, S.; Kamilya, T. Biocompatibility study of protein capped and uncapped silver nanoparticles on human hemoglobin. J. Phys. 2015, 48, 235305.
  18. Raza, M.A.; Kanwal, Z.; Rauf, A.; ASabri, N.; Riaz, S.; Naseem, S. Size- and Shape-Dependent Antibacterial Studies of Silver Nanoparticles Synthesized by Wet Chemical Routes. Nanomaterials 2016, 6, 74.
  19. Kim, D.H.; Park, J.C.; Jeon, G.E.; Kim, C.S.; Seo, J.H. Effect of the Size and Shape of Silver Nanoparticles on Bacterial Growth and Metabolism by Monitoring Optical Density and Fluorescence Intensity. Biotechnol. Bioprocess Eng. 2017, 22, 210–217.
  20. Kamali, M.; Ghorashi SA, A.; Asadollahi, M. Controllable Synthesis of Silver Nanoparticles Using Citrate as Complexing Agent: Characterization of Nanopartciles and Effect of pH on Size and Crystallinity. Iran. J. Chem. Chem. Eng. Int. Engl. Ed. 2012, 31, 21–28.
  21. Avitabile, E.; Senes, N.; D’Avino, C.; Tsamesidis, I.; Pinna, A.; Medici, S.; Pantaleo, A. The potential antimalarial efficacy of hemocompatible silver nanoparticles from Artemisia species against P. falciparum parasite. PLoS ONE 2020, 15, e0238532.
  22. Martínez-Castañón, G.A.; Niño-Martínez, N.; Martínez-Gutierrez, F.; Martínez-Mendoza, J.R.; Ruiz, F. Synthesis and antibacterial activity of silver nanoparticles with different sizes. J. Nanoparticle Res. 2008, 10, 1343–1348.
  23. Qin, Y.; Ji, X.; Jing, J.; Liu, H.; Wu, H.; Yang, W. Size control over spherical silver nanoparticles by ascorbic acid reduction. Colloids Surf. A Phys. Eng Asp. 2010, 372, 172–176.
  24. Urbańska, K.; Pająk, B.; Orzechowski, A.; Sokołowska, J.; Grodzik, M.; Sawosz, E.; Szmidt, M.; Sysa, P. The effect of silver nanoparticles (AgNPs) on proliferation and apoptosis of in ovo cultured glioblastoma multiforme (GBM) cells. Nanoscale Res. Lett. 2015, 10, 98.
  25. Loutfy, S.A.; Al-Ansary, N.A.; Abdel-Ghani, N.T.; Hamed, A.R.; Mohamed, M.B.; Craik, J.D.; Eldin, T.A.; Abdellah, A.M.; Hussein, Y.; Hasanin, M.T.; et al. Anti-proliferative Activities of Metallic Nanoparticles in an in Vitro Breast Cancer Model. Asian Pac. J. Cancer Prev. 2015, 16, 6039–6046.
  26. Sur, I.; Altunbek, M.; Kahraman, M.; Culha, M. Interaction of multi-functional silver nanoparticles with living cells. Nanotechnology 2010, 21, 175104.
  27. Lu, F.; Wu, S.H.; Hung, Y.; Mou, C.Y. Size effect on cell uptake in well-suspended, uniform mesoporous silica nanoparticle. Small 2009, 5, 1408–1413.
  28. Khorrami, S.; Zarrabi, A.; Khaleghi, M.; Danaei, M.; Mozafari, M.R. Selective cytotoxicity of green synthesized silver nanoparticles against the MCF-7 tumor cell line and their enhanced antioxidant and antimicrobial properties. Int. J. Nanomed. 2018, 13, 8013–8024.
  29. Al-Sheddi, E.S.; Farshori, N.N.; Al-Oqail, M.M.; Al-Massarani, S.M.; Saquib, Q.; Wahab, R.; Musarrat, J.; Al-Khedhairy, A.A.; Siddiqui, M.A. Anticancer Potential of Green Synthesized Silver Nanoparticles Using Extract of Nepeta deflersiana against Human Cervical Cancer Cells (HeLA). Bioinorg. Chem. Appl. 2018, 2018, 9390784.
  30. Lee, Y.S.; Kim, D.W.; Lee, Y.H.; Oh, J.H.; Yoon, S.; Choi, M.S.; Lee, S.K.; Kim, J.W.; Lee, K.; Song, C.W. Silver nanoparticles induce apoptosis and G2/M arrest via PKCζ-dependent signaling in A549 lung cells. Arch. Toxicol. 2011, 85, 1529.
  31. Kovács, D.; Igaz, N.; Keskeny, C.; Bélteky, P.; Tóth, T.; Gáspár, R.; Madarász, D.; Rázga, Z.; Kónya, Z.; Boros, I.M.; et al. Silver nanoparticles defeat p53-positive and p53-negative osteosarcoma cells by triggering mitochondrial stress and apoptosis. Sci. Rep. 2016, 6, 27902.
  32. Satapathy, S.R.; Mohapatra, P.; Preet, R.; Das, D.; Sarkar, B.; Choudhuri, T.; Wyatt, M.D.; Kundu, C.N. Silver-based nanoparticles induce apoptosis in human colon cancer cells mediated through p53. Nanomedicine 2013, 8, 1307.
  33. Çiftçi, H.; Türk, M.; Tamer, U.; Karahan, S.; Menemen, Y. Silver nanoparticles: Cytotoxic, apoptotic, and necrotic effects on MCF-7 cells. Turk. J. Biol. 2013, 37, 573–581.
  34. Deng, L.; Meng, T.; Chen, L.; Wei, W.; Wang, P. The role of ubiquitination in tumorigenesis and targeted drug discovery. Signal Transduct. Target. Ther. 2020, 5, 11.
More
This entry is offline, you can click here to edit this entry!