1. Introduction
Endometrial cancer is the sixth most common cancer in women and the 15th most commonly occurring cancer worldwide, with over 380,000 new cases reported in 2018 [
1,
2,
3]. The disease is most prevalent in post-menopausal women, with a dramatic 13% increase in the incidence reported in the UK between 2007–2017. Alarmingly this rate is exacerbated in younger women aged 25 to 45 years, [
2,
4] and has been linked to genetic factors, obesity and poor diet, with an elevated risk in patients suffering from polycystic ovary syndrome [
5,
6].
Endometrial cancer can broadly be divided to type I or II, with disease progression further defined in six stages, according to the Rotterdam criteria [
7]. Type I endometrioid adenocarcinoma, representing 80% of all cases [
8], is a low-grade, hormone receptor positive disease with a good prognostic outcome if diagnosed early [
6]. Many stage I cancers can be cured with surgery alone, although more advanced stages require adjuvant radiotherapy or chemotherapies such as paclitaxel and ifosfamide to avoid reoccurrence [
9]. In contrast, type II endometrial carcinomas are estrogen-independent, often with high-grade serous or clear cell histology and poor outcomes, and account for 40% of all endometrial cancer associated mortality [
4,
10]. Advanced stage endometrial cancers become metastatic, to the point where surgery is not the most appropriate treatment option. Chemotherapy then becomes preferred, with cisplatin, carboplatin, doxorubicin and taxane alone or in combination used as the most common treatment regimes, alongside hormone therapies such as megestrol for Type I estrogen-responsive cancers [
11].
Differences exist in the molecular pathogenesis of type I and II endometrial cancer [
12,
13] and links have been established to alterations in epigenetic processes such as DNA (de)methylation [
14], histone (de)methylation or (de)acetylation [
15,
16]. Nieminen et al. [
12], identified 24 tumor suppressor genes that were progressively hypermethylated during the development of type I endometrial cancer [
14,
17,
18]. Similarly, treatment of endometrial cancer models using small chemical compounds that modify epigenetic processes can partially, or even fully, restore the normal expression levels of genes including the re-expression of inactivated tumor suppressor genes and deactivation of activated oncogenes such as RASS-F1A, MGMT, HAND2, PTEN and MLH1 [
19,
20]. This epigenetic plasticity and the deregulation of epigenetic processes in endometrial cancer have led to the evaluation of suberoylanilide hydroxamic acid (SAHA), currently approved for the treatment of lymphoma and myelodysplastic syndromes, in endometrial cancer clinical trials [
21]. SAHA inhibits class I and II HDACs by binding to the Zn
2+ chelation center in the enzyme and affects processes that lead to cell cycle arrest and apoptosis [
22,
23,
24]. However, in Phase II studies, SAHA has demonstrated little to no efficacy either alone or in combination with standard anti-cancer treatments [
25]. Several factors may cause the lack of HDAC response including low stability in the blood stream (two-hour elimination half-life) and an inability to accumulate adequate concentrations at the tumor site, a combination of increased drug efflux pump activity and low tumor penetration [
26]. Furthermore, the pharmacology of SAHA is particularly complex as it can act as an enzyme inducer following repeated dosing, increasing HDAC levels and may modify its own kinetics [
25].
Strategies to overcome such limitations include the development of nanovectors to increase drug stability and accumulation of drug-containing nanoparticles at tumor sites [
27,
28,
29,
30,
31,
32]. The improvement of safety and tolerability by nanoparticle-formulated drugs is exemplified by liposomal doxorubicin [
33], where increased concentrations of the therapeutic agent accumulate specifically in the tumor [
34], by virtue of the purported enhanced permeability and retention effect [
35,
36]. Previously, passive encapsulation and conjugations (prodrug approaches) of SAHA have been shown to improve the drug efficacy in melanoma and breast cancers, respectively [
37,
38].
Hyaluronic Acid (HA) is a naturally occurring polymer that consists of N-acetyl-d-glucosamine and d-glucuronic acid repeat units and is a ligand for the CD44 receptor [
39]. HA has previously been used successfully as a targeting agent in nanoformulations. Notably, Tran et al., designed a SAHA solid lipid nanoparticle (SLN) with HA surface expression for improved cellular uptake in lung adenocarcinoma (A549) and tongue squamous cell carcinoma (SCC-7) [
40]. Even though there are benefits to lipidic carriers for drug delivery, SLNs have a several disadvantages including non-compatibility with hydrophilic agents, gelation of SLN suspensions, low loading capacities, high costs (comparative to a polymer alternative) and the increase in SLN particle size over time [
41,
42].
Polymers provide an excellent platform for nanovector systems, with many polymer nanoparticle developments reported for the treatment of solid tumors [
43,
44]. Pluronic
® F-127 is a water soluble triblock copolymer consisting of poly(ethylene oxide)-poly(propylene oxide)-poly(ethylene oxide) repeats (PEO101-PPO56-PEO101) that possess a low toxicity in vivo, and is FDA approved [
45]. F127 nanoparticles have been developed for the controlled release of therapeutic drugs, peptides and proteins [
46,
47,
48] and with carboxylic groups to mediate the addition of tumor targeting moieties such a folate [
49,
50]. HA is a ligand for the CD44 receptor [
39,
51] that is found at low levels on the surface of epithelial cells but is highly expressed in endometrial tumors, playing a key role in tumor development and progression [
52,
53]. In vivo studies have demonstrated that HA functionalized nanoparticles target CD44 over-expressing tumor sites [
54,
55], and exhibit enhanced stability in the bloodstream [
40]. Previously, Pluronic
® F-127-HA conjugates have been used to form macromolecular hydrogels for slow drug release implants, however, there has been no application of HA-pluronic as discrete nano-micelles for drug delivery [
56,
57].
2. Effective SAHA Dose Determination for Type I and II Endometrial Cancer Models
Ishikawa (type I) and Hec50 (type II) endometrial cancer cell lines [
58] were used to determine an effective treatment concentration for SAHA prior to its encapsulation in Pluronic
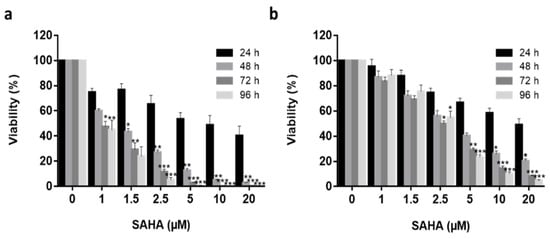
® F-127 vectors. Ishikawa and Hec50 cells were treated with an increasing dose of SAHA concentration (1 μM to 20 μM) over 96 h (
Figure 1) and found to have different response profiles to SAHA treatment, with Ishikawa cells being much more sensitive to the drug [
21,
71,
72]. No significant reduction in Ishikawa cell viability was observed following treatment with 1 µM SAHA after 48 h (
p > 0.05), the half-maximal inhibitory concentration (IC50) was observed at 1.5 µM (
p > 0.05) and IC99 at 20 µM (
p < 0.001) treatment. Hec50 cells demonstrated approximate IC15, IC45 and IC95 following 1 µM, 2.5 µM (
p < 0.05) and 20 µM (
p > 0.001) treatments, respectively. Using the 72 h data series, the IC50 was determined to be 1.2 µM and 2.7 µM for Ishikawa and Hec50, respectively. Having established the response profiles to SAHA exposure, 2.5 μM was selected for all further treatments, as this was the lowest concentration where a significant reduction in viability was observed for both cell types.
Figure 1. Free SAHA drug cytotoxicity in in vitro Endometrial cancer models. Increasing concentrations (1 μM to 25 μM) of free SAHA were added to both Ishikawa (a) and Hec50 (b) cells over a 96 h period (24 h—black columns, 48 h—medium grey, 72 h—dark grey, 96 h—light grey) and viability quantified using Real Time Glo viability test (n = 3), independent biological experiments. All data was normalized to the untreated control cells. Statistical significance is indicated on graphs: p ≤ 0.05 denoted by *, p ≤ 0.01 by ** and p ≤ 0.001 by ***.
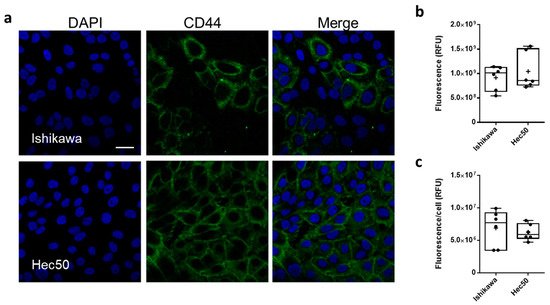
CD44 protein expression was characterized in both Ishikawa and Hec50 cell lines, using confocal laser scanning microscopy (CSLM;
Figure 2). CD44 was shown to be expressed throughout the Ishikawa population with a mean relative fluorescence (RFU) of 9.15 ± 1.02 × 10
8 and a mean cellular RFU of 6.88 ± 1.4 × 10
6 (
Figure 2b,c and
Figure S2). In comparison, only a portion of Hec50 cells assessed were shown to be CD44+, with a whole population RFU of 1.04 ± 0.15 × 10
9 and a cellular RFU of 6.26 ± 0.52 × 10
6. Interestingly, this heterogenous expression of CD44 still amounts to a similar mean expression to that shown in the homogenous Ishikawa population, due in part to the number of high expressing cells across the monolayer.
Figure 2. CD44 expression in endometrial cancer models. Representative immunofluorescence images showing CD44 expression (FITC, green) in Ishikawa and Hec50 cells (a) nuclei where stained with DAPI (blue), scale bar is 30 μm. Relative fluorescence units (RFU) values obtained from ImageJ analysis of immunofluorescence images (b), RFU per cell based on nuclei count (c) where each point plotted is value from each field analyzed.
3. Physicochemical Characterisation of Functionalized and SAHA-Loaded Pluronic® F-127 Nanoparticles
Pluronic
® F-127 nanoparticles (NP) and thiolated pluronic nanoparticles (NP-S-S) were fabricated using thin-film hydration [
50]. HA was conjugated to particles post-fabrication by HA-thiol treatment, to obtain HA-coated NPs (NP-HA) [
73]. Briefly, a disulphide bridge was introduced by activating the PEG-diols with 4-nitrochloroformate followed by reacting with 2-(2-pyridyldithio) ethylamine to obtain NP-S-S. The efficiency of this pyridyl functionalization was 78% following reduction. Separately, HA-thiols were synthesized by conjugating 3,3′-dithiobis (propanoic hydrazide) followed by reduction with DTT. The degree of thiol modification was estimated by Ellman’s assay and was found to be 7% with respect to disaccharide repeat units. SAHA payloads were incorporated into the micelles by co-dissolution prior to thin-film formation. DLS measurements of empty NP gave sizes of 29.1 ± 2.1 nm, particle size increased to 35.7 ± 3.6 nm after drug incorporation (SAHA-NP) and the addition of HA to the surface of the particle (SAHA-NP-HA) gave a further increase to of 251.6 ± 22.0 nm (
Table 1).
Table 1. Characterization of nanodelivery systems. Four different nanoparticle formulations were analyzed by size (DLS), polydispersity index (PDI; DLS), zeta potential (DLS), encapsulation efficiency (EE%) and drug release profile data. All data shown is average and standard deviation, from a minimum of three independent biological repeats. ** Statistically significant values compared to SAHA-NP.
| Particle |
Size Average (nm) |
PDI |
Zeta Potential (mV) |
Encapsulation Efficiency (EE%) |
Loading Capacity (LC%) |
Drug Release Maxima (h) |
Encapsulated Drug Released over 72 h |
First Order Rate Constant |
| Empty NP |
29.1 ± 2.1 |
0.243 |
0.120 ± 0.25 |
- |
- |
- |
- |
- |
| SAHA-NP |
35.7 ± 3.6 |
0.354 |
−0.197 ± 0.15 |
18% |
0.6% |
2 |
28.06 µg |
2.5 ± 0.2 |
| SAHA-NP-S-S- |
179.9 ± 15.0 |
0.229 |
−3.12 ± 0.61 |
42% |
9.1% |
0.5 |
44.61 µg |
- |
| SAHA-NP-HA |
251.6 ± 22.0 |
0.312 |
−14.23 ± 3.29 |
45% ** |
9.7% ** |
23.5 |
39.63 µg |
0.3 ± 0.03 |
High resolution analysis was undertaken by using AFM peak-force tapping mode imaging, giving more accurate size determination than is possible with DLS [74,75,76,77,78]. The spherical geometry of intact particles was clearly demonstrated, with diameters of 40 ± 3 nm and 75 ± 7 nm for SAHA-NP and SAHA-NP-HA, respectively (Figure 3a,b). These size ranges and particle morphology were confirmed using TEM (See Figure S3). Image analysis of over 250 particles per formulation gave mean sizes of 20.3 ± 4.6 nm for SAHA-NP and 43.8 ± 18.7 nm for SAHA-NP-HA. These sizes are notably smaller than values from AFM data and the standard deviation is much larger. Previous comparisons of six different characterization techniques found that TEM under-estimated NP size in comparison to both DLS and AFM, potentially an artefact of the staining and drying process (which could lead to micelle branches collapsing) required for TEM analyses [79]. F127 micelles displayed uniformity after drug encapsulation as shown in the PDI measurements, where SAHA-NP particles exhibited a PDI of 0.354 and the empty NP 0.243. HA functionalization resulted in a significant decrease in zeta potential to −14.23 ± 3.29 mV compared to SAHA-NP (−0.197 ± 0.15 mV) (Table 1). SAHA encapsulation efficiency was 42% for SAHA-NP-HA (Table 1) and was 2.5-fold greater than SAHA-NP (18%; p < 0.05). SAHA-NP-HA had an enhanced loading capacity (LC) of 9.7% (wt./wt.%), a 16-fold increase compared to SAHA-NP (0.6% wt./wt.%, p < 0.01) and demonstrated a significant increase in LC compared to comparable reported drug delivery systems (DDS) where SAHA encapsulation into HA-coated particles was only 1.9% [40].
Figure 3. Nanoparticle AFM imaging. F127 nanoparticles were deposited on a mica substrate and analyzed by AFM. (a) NP topography showing the round shape. (b) Vertical line profile calculated along the solid white dotted line showing particle height around 40 nm. Scale bar 300 nm. (c) NP-HA image showing size and topography. Encapsulation efficiency and release profile HPLC chromatogram and calibration curve. SAHA encapsulation efficiency was calculated relative to a standard curve constructed from increasing SAHA concentrations from over range of 2.5 to 100 μM (absorbance at 241 nm and retention time = 8.34 min) in DMSO solution, measured by HPLC (d). Calibration curve (e) and linear fitting are representative of that constructed independently for each particle preparation. The purity (based on AUC) was >95%. Cumulative passive SAHA release profiles from nanoparticles (f). Cumulative percentage as a proportion of the released drug, not total drug encapsulated. Data generated using LC-UV analysis. SAHA-NP (black line) and SAHA-NP-HA (blue line) release profiles with corresponding first order rate constant.
Passive drug release at physiological salt concentrations (151.5 mM PBS;
Figure 3f) determined a consistent release was established at 7.5 h for SAHA-NP and 25.0 h for SAHA-NP-HA, a delayed release between SAHA-NP and SAHA-NP-HA of 17.5 h. Maximal drug release was at 2 h for SAHA-NP and 24.5 h for SAHA-NP-HA. Presented (
Figure 3e,f) are cumulative percentage as a proportion of the released drug only, not total drug encapsulated. All formulas were shown to retain at least 94% of payload over the time period investigated. The slow and sustained release of SAHA for all formulations, evidenced by plateau in
Figure 3f, demonstrated the advantage of nano-formulation in terms of the efficient stabilization of hydrophobic SAHA at the PPO core and supported the absence of any burst release. Drug release modelling of SAHA-NP and SAHA-NP-HA gave first-order release constants of 2.5 +/− 0.2 and 0.3/−0.03, indicating the addition of HA to the particle surface altered release kinetics. It is likely that the slower release rates observed were due in part to the super-saturation of hydrophobic SAHA at the higher concentrations encapsulated in these particles [
80]. In addition, HA is a relatively large polymer and creates a rate-limiting barrier [
81,
82] likely resulting in increased SAHA stability in free circulation and prolonged release. Over the 72 h period the mass of SAHA released from each formula was 28.1 µg (SAHA-NP) and 39.6 µg (SAHA-NP-HA) less than 5.5% of total drug cargo for all formulations, demonstrating a stable DDS that retains the majority of the encapsulated cargo. This data is a significant improvement on similar lipid-based systems, [
38] where HA-SLN encapsulation of SAHA demonstrated concerns of rapid drug release where 50% of drug had been expelled in the first 10 h.
4. Micelle Encapsulation Enhances SAHA Cytotoxicity
Ishikawa and Hec50 cells were grown in the presence of empty nanoparticles or NP-HA particles, with no significant increase in cellular toxicity observed (Figure 4b,e; p > 0.05), demonstrating the biocompatibility of the polymer with or without the HA moiety attached. The cytotoxic effect of SAHA-NP and SAHA-NP-HA was evaluated on Ishikawa cell monolayers (Figure 4c), and both SAHA-NP and SAHA-NP-HA were found to significantly reduce cell viability by 94% (p < 0.05) and 97% (p < 0.05), respectively, after 48 h. Both NP formulations were much more effective compared to free SAHA (41% reduction/IC40, Figure 4c). After 72 h cell viability had continued to decrease, a reduction of 97% and 98% was observed for SAHA-NP (p < 0.05) and SAHA-NP-HA (p < 0.05). Free drug SAHA after 72 h essentially had no further reduction in viability by 39%, possibly indicative of recovery and reflecting that free drug has poor long-term stability. In Hec50, following 48 h (Figure 4f) cellular viability was reduced by 79% (p < 0.05) following SAHA-NP exposure, compared to only 23% for the free drug (IC25) (Figure 4). Cell viability was further decreased with SAHA-NP after 72 h, significantly lowered by 86% (p < 0.05) compared to only 30% with the free drug (IC30). Encapsulation of SAHA substantially improved efficacy, however HA incorporation into the NP system did not enhance the efficacy of the SAHA-NP in 2D cell models, where cell viability decreased by 63% after 48 h and 74% after 72 h, respectively.
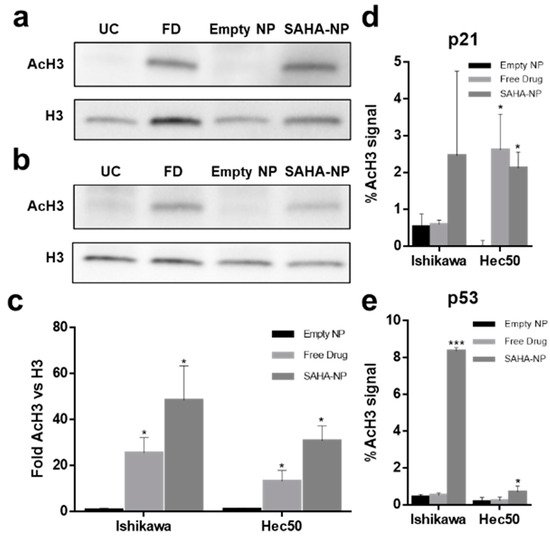
5. SAHA-NP Treatment Alters Histone H3 Acetylation at the Promoters of p21 and p53
SAHA inhibits histone deacetylation resulting in increased histone (H3 and H4) acetylation levels [
22] and affects cell cycle progression through restoration of p21 expression in both Ishikawa and Hec50 cells [
23] while reducing the expression of p53 in Ishikawa cells [
88,
89]. To determine whether these molecular responses were altered following encapsulation, global levels of acetylated histone H3 (AcH3) were measured (
Figure 5a–e) and SAHA-NP treatment was shown to induce an expected 2–3-fold increase in the global level of AcH3, as well as induce locus specific increase in acetylation for both p21 and p53.
Figure 5. Mechanism of action of SAHA encapsulated and free SAHA drug in endometrial cancer cells. Protein blot analysis (AcH3 and H3) to demonstrating the SAHAs mechanism of action in Ishikawa (
a) and Hec50 cells (
b) (original images can be found at
Figure S9), and protein density analysis of AcH3 (
c) following 48 h treatments (
n = 3). Treatments tested; empty nanoparticle (black), free SAHA (light grey) and SAHA-NP (dark grey), all treatments were 2.5 μM. All data are normalized to the untreated control cells. Effect of SAHA on AcH3 binding to the p21 promoter (
d) and p53 promoter (
e) in endometrial cancer cells and promoter methylation. ChIP experiments, SAHA effect on binding of AcH3 antibody to the p21 and to the p53 promoter. Hec50 and Ishikawa cells were treated with empty nanoparticle (black), free SAHA (light grey) and SAHA-NP (dark grey) (
n = 3). Statistical significance is indicated on graphs:
p ≤ 0.05 denoted by * and
p ≤ 0.001 by ***.
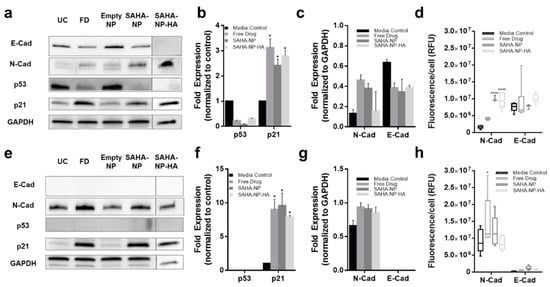
These changes in histone acetylation levels contribute to altered protein expression. As expected, p53 protein expression was reduced after treatment with all SAHA-NPs in Ishikawa cells (
Figure 6a,b), however as Hec50 are p53 null expression was undetected (
Figure 6e,f). Conversely, in response to SAHA-NP treatments, p21 expression increased approximately four times more in Hec50 compared to Ishikawa, indicating a hyper-reactivation of p21 in this type II endometrial cancer model (
Figure 6a,b,e,f). Epithelial–mesenchymal transition (EMT) status has been shown to be an important prognostic marker in endometrial cancer [
90], and SAHA has been shown to induce a pro-migration phenotype [
91,
92,
93]. N-Cadherin expression was upregulated following all SAHA treatments and E-cadherin was downregulated in Ishikawa following all treatments, an association seen in mesenchymal phenotypes [
90]. Immunofluorescence analysis of N and E cadherin (
Figure 6d,h and
Figure S5a,b), corroborate protein blot analyses and show heterogeneity of N-cadherin upregulation in Ishikawa populations following SAHA treatment. Ratios of N:E (
Figure S5c), show a change in Ishikawa from 0.2 to 0.5, 1.4 and 0.9 following free drug, SAHA-NP and SAHA-NP-HA, respectively.
Figure 6. SAHA and SAHA-NP systems alter p21 and p53 expression and molecular in endometrial cancer cells. Protein blots for Ishikawa (
a) (original images can be found at
Figure S10) and Hec50 (
e) (original images can be found at
Figure S11), and densitometry for media control (black) and 2.5 μM SAHA (medium grey), SAHA-NP (dark grey) and SAHA-NP-HA (light grey) for 48 h for p53 and p21 in Ishikawa (
b) and Hec50 (
f) and E and N cadherin in Ishikawa (
c) and Hec50 (
g). * p53 and p21 are average and standard error, from a minimum of three independent repeats normalized to the untreated controls and GAPDH protein density. Cadherin values are average and standard error from a minimum of three independent repeats normalized to GAPDH protein density level only. Cadherin expression in endometrial cancer models. Immunofluorescence of E and N-cadherin in Ishikawa (
d) and Hec50 (
h) cell lines following 48 h treatments, relative fluorescence units (RFU) values obtained from ImageJ analysis of immunofluorescence images (
n = 6), RFU per cell based on nuclei count. Statistical significance is indicated on graphs:
p ≤ 0.05 denoted by * and
p ≤ 0.0001 by ****.
6. HA Enhances Cytotoxicity of SAHA Nanoparticles in 3D Tumor Models
3D cellular models involve the establishment of complex cell-cell interactions as well as nutrient and oxygen gradients [
94] allowing a more patho-physiologically relevant evaluation in drug development to be undertaken [
95]. Whilst there is considerable variation between cell types, cells grown in spheroids are more akin to tumor cells in situ. The majority of cells in a spheroid, other than surface cells, leave the growth phase of cell cycle and become dormant due to contact inhibition [
96]. This more closely reflects proliferation rates and metabolism of tumors in vivo. A comparative study on the growth properties of endometrial cancer cells in monolayers versus spheroids has shown that this method of cell culture leads to metabolism, proliferation and autocrine/paracrine signaling reflective of tumors in situ, traits that are not displayed in monolayer cultures [
97].
Cell seeding optimization determined that a seeding density of 4 × 10
3 resulted in optimal spheroid growth for both Ishikawa and Hec50 (
Figure S6), using image (
Figure S7a,b) analysis and object area, circularity and density as broad indicators of successful establishment of the desired spheroid morphology and growth rate (
Figure 7b,e and
Figure 8d,h). Spheroid penetration and cellular uptake was investigated to further understand particle behavior. Spheroids were treated for 48 h with each NP formulation (loaded with PI), disaggregated and analyzed by flow cytometry. All NPs (including NP-S-S-) showed complete spheroid penetration with over 93% of cells being positive for PI. In Ishikawa (
Figure 7a), a clear increase in intensity/cell is seen in NP-HA (mean of 2.9 × 10
5) compared to all other treatments (NP, 2.2 × 10
5; NP-S-S-, 2.1 × 10
5). 3D NP uptake in Hec50 (
Figure 7d) show consistency with the results observed in 2D. NP-HA mean intensity/cell was shown to be 1.8 × 10
5 compared to 1.9 × 10
5 in NP treatments (NP-S-S-, 1.4 × 10
5). Interestingly, the interquartile range was shown to be higher for NP-HA than NP, conceivably due to the heterogenous expression of CD44 in Hec50 leading to a large spread of uptake throughout the population. Furthermore, both Ishikawa and Hec50 spheroids demonstrated a reduction in uptake when pre-treated with HA with mean intensities reduced by 0.5 × 10
5 (
Figure 7a) and 0.2 × 10
5 (
Figure 7d), respectively [
39]. Across both cell lines NP and NP-HA have great spheroid penetration, as evidenced by over 99.5% of Ishikawa cells and over 98% of Hec50 cells being NP positive. HA saturation inhibited uptake of NP-HA by 1.8% in Ishikawa cells and 3.6% of Hec50 cells.
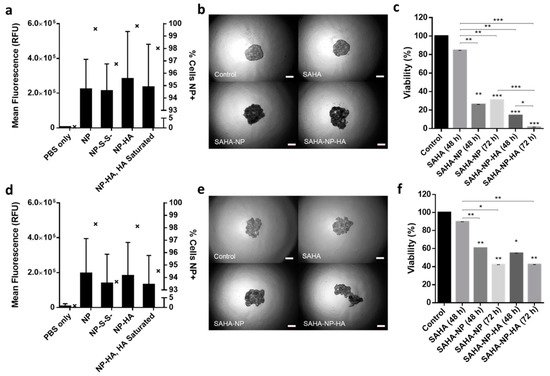
Figure 7. Nanoparticle uptake in 3D models. Quantified uptake in Ishikawa (a) and Hec50 (d) per cell, with a minimum of 5 × 10⁴ cells per sample and all treatments were 2.5 μM. Mean RFU/cell is depicted by bars which correspond to the left axis, the percentage of nanoparticle positive cells is given by interleaved scatter plots that corresponds to the right axis. Images of endometrial cancer model spheroids following treatment (40× magnification). Images of Ishikawa (b) and Hec50 (e) control spheroids and spheroids treated with SAHA free, SAHA-NP and SAHA-NP-HA. Scale bars are 50 μm. Cytotoxicity of SAHA-NP delivery systems. Spheroid cytotoxicity assessment using Celltiter Glo 3D (n = 3) of SAHA Free Drug, SAHA-NP and SAHA-NP-HA at 2.5 μM for 48 h and 72 h in Ishikawa (c) and Hec50 (f). All data is normalized to the untreated control cells. Statistical significance is indicated on graphs: p ≤ 0.05 denoted by *, p ≤ 0.01 by ** and p ≤ 0.001 by ***.
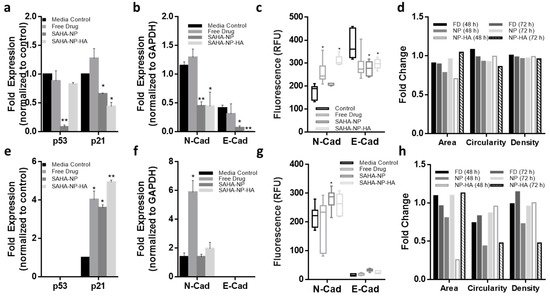
Figure 8. Effect of free and NP- encapsulated SAHA on p21 and p53 expression and molecular phenotype in 3D endometrial cancer models. Protein densitometry of media control (black) SAHA Free Drug (medium grey), SAHA-NP (dark grey) and SAHA-NP-HA (light grey), all treatments were 2.5 μM for 72 h. Protein analyses on cell cycle arrest markers p53 and p21 in Ishikawa (a) and Hec50 (e) and molecular phenotype markers E and N cadherin in Ishikawa (b) and Hec50 (f), * p53 and p21 results are average and standard error, from a minimum of three independent repeats, results are normalized to the untreated control cells and expressed as a ratio compared to housekeeping protein GAPDH density levels. Cadherin values are average and standard error, from a minimum of three independent repeats normalized to GAPDH protein density level only. Cadherin expression in spheroids Quantified immunofluorescence of E and N-cadherin in Ishikawa (c) and Hec50 (g) spheroids following treatments, relative fluorescence units (RFU) values obtained from ImageJ analysis of immunofluorescence images (n = 6), RFU per unit area. Spheroid morphology metrics ImageJ analysis of the spheroid images was conducted to ascertain change in area, circularity and density in Ishikawa (d) and Hec50 (h) following treatments, free drug 48 h (black), free drug 72 h (dark grey), SAHA-NP 48 h (medium grey), SAHA-NP 72 h (light grey), SAHA-NP-HA 48 h (white with grey outline) and SAHA-NP-HA 72 h (striped). All data was normalized to untreated control spheroids. Statistical significance is indicated on graphs: p ≤ 0.05 denoted by * and p ≤ 0.01 by **.