Your browser does not fully support modern features. Please upgrade for a smoother experience.
Please note this is an old version of this entry, which may differ significantly from the current revision.
Subjects:
Pathology
In the human heart, the energy supplied by the production of ATP is predominately accomplished by ß-oxidation in mitochondria, using fatty acids (FAs) as the primary fuel. Long-chain acylcarnitines (LCACs) are intermediate forms of FA transport that are essential for FA delivery from the cytosol into mitochondria.
- long-chain acylcarnitine
- cardiovascular disease
- mitochondria
1. Introduction
Mitochondrial dysfunction has been implicated in the development of heart failure, which is the leading cause of hospitalization in all Western countries and is associated with high morbidity and mortality. Mitochondrial dysfunction often develops as the result of unsuccessful adaptation to energy stress in the heart, which perpetuates a maladaptive spiral, augmenting cardiac damage. In clinical findings, heart failure was found to be linked to defective carnitine transport and mitochondrial fatty acid (FA) oxidation [1]. Cardiac mitochondrial FA oxidation is a pivotal pathway for maintaining energy homeostasis and is a significant source of adenosine triphosphate (ATP) energy provision under restricted glucose accessibility. Due to an impermeable inner mitochondrial membrane, free long-chain FAs enter mitochondria via a specialized carnitine carrier system, transporting activated FAs from the cytosol to mitochondria (Figure 1A) and are enzymatically transformed into acyl-coenzyme A(-CoA) esters [2,3].
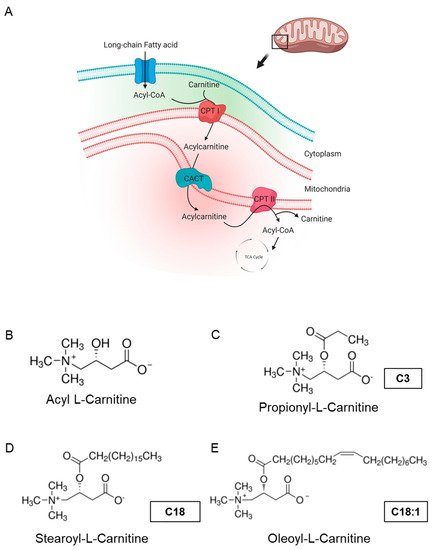
Figure 1. Carnitine shuttle in mitochondria and chemical structures of carnitines. (A) Description of acylcarnitine metabolism (free fatty acid metabolism) in general. Acyl-CoA and carnitine are conjugated (acylcarnitine) by carnitine-palmitoyl transferase I (CPT I) and transported across the inner membrane of mitochondria via carnitine-acylcarnitine translocase (CACT). Then, acyl-CoA and carnitine are released into the mitochondrial matrix by carnitine-palmitoyl transferase 2 (CPT II). Acyl-CoA is finally degraded and released as acetyl-CoA to enter the TCA cycle, synthesizing ATP. Subfigure A is created by BioRender.com (accessed on 23 March, 2021). (B–E) Molecular structures of acyl-l-carnitine, short-chain carnitine and long-chain acylcarnitines (LCACs).
Acyl-l-carnitine (Figure 1B) belongs to the family of carnitines, a group of naturally occurring compounds that are essential for the β-oxidation of FAs in mitochondria during ATP synthesis [4]. Long-chain acylcarnitines (LCACs, e.g., C18 or C18:1) are intermediates in intramitochondrial FA metabolism. For instance, the long-chain acylcarnitine C18:1 is an intermediate transportation form for the monounsaturated FA C18:1 and high LCAC levels have been related to CVD, including heart failure (HF), coronary artery disease (CAD) and cardiac arrhythmias [5,6,7,8,9,10,11]. Hence, LCACs are not only potential CVD biomarkers, but might also be the putative cause of distinct cardiac disease.
The zebrafish has become a valuable vertebrate model in the study of human cardiac disease and has already successfully contributed to the identification and characterization of the genetic and molecular underpinnings of CVD, as well as the discovery and mechanistic description of bioactive small molecules. During the last decade, in vivo screening of small molecules using zebrafish has helped to gain insights into their pharmacological characteristics, such as absorption, distribution, metabolism, excretion and toxicity, which were limited in cell-based analyses [12]. Cardiovascular physiology is highly conserved between humans and zebrafish, which guarantees the meaningful translation of findings from the zebrafish model to the human situation [13,14]. Vice versa, numerous human cardiovascular drugs and biologically active small molecules have already been shown to mediate identical effects on zebrafish physiology [15,16,17,18,19,20].
Here, to evaluate the putative impact of the LCACs C18 and C18:1 on mitochondrial and cardiac function in the in vivo vertebrate model of zebrafish, we treated wild-type zebrafish embryos with C18 and C18:1 and found that treatment with both LCACs resulted in a significantly reduced expression of genes involved in mitochondrial function and ATP production, eventually leading to decreased ATP levels. Similarly to mitochondrial morphology, structure and density in cardiomyocytes, cardiac chamber differentiation, specification and growth were not affected by LCAC treatment.
2. LCAC Treatment Interferes with Mitochondrial Function, Resulting in Diminished ATP Production
To assess the impact of long-chain acylcarnitines (LCACs) in vivo, we treated zebrafish embryos with the two LCACs C18 (stearoyl-l-carnitine) and C18:1 (oleoyl-l-carnitine), as well as the short-chain acylcarnitine (SCAC; propionyl-l-carnitine) C3 as a control (Figure 1C–E). First, embryos were incubated with 0.1, 0.5, 1 and 5 µM of C18, C18:1 or C3 from 48 h post-fertilization (hpf) for 48 h, to investigate potential adverse or toxic effects of the three molecules on zebrafish development, morphogenesis and survival (Figure 2A). By treating embryos with the different compounds, we found that 5 µM of C18 resulted in significantly increased mortality of zebrafish embryos, whereas 5 µM of C18:1 and C3 had no negative effects on embryo survival (Figure 2B). As we observed phenotypic changes such as pericardial edema and intracardiac blood congestion even with low concentrations (0.1 and 0.5 µM of LCACs) (Figure 3A–F and Supplementary Figure S1A–E), we decided to continue using these two concentrations in order to reduce the non-specific toxicity as much as possible. Nevertheless, these data persuaded us to exclude the high concentration from further analyses.
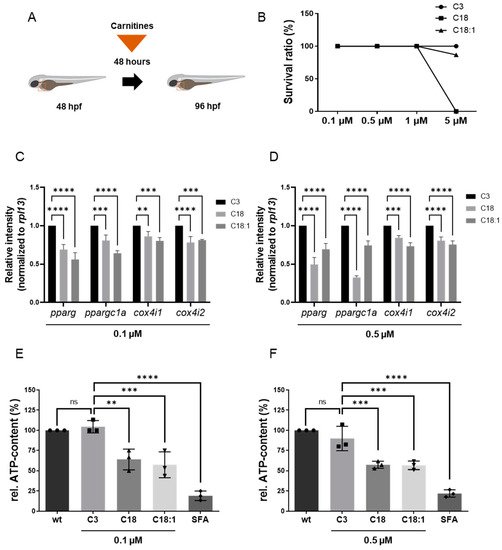
Figure 2. Experimental design of LCAC treatments in zebrafish embryos and survival rates for different concentrations of LCACs. Interrupted mitochondrial function by LCACs is accompanied by decreased ATP production. (A) Experimental design of compound treatments. (B) Lethality of the compounds at different concentrations. (C,D) Quantitative real-time PCR targeting genes related to ATP production (SD, n = 3, ns: p > 0.05, ** p < 0.01, *** p < 0.001, **** p < 0.0001). (E,F) Assessment of relative ATP content in zebrafish embryos after compound treatments (SD, n = 3, ns: p > 0.05, ** p < 0.01, *** p < 0.001, **** p < 0.0001). Abbreviations: rel. = relative, ns = not significant, wt = wild-type, SFA = sodium fluoroacetate.
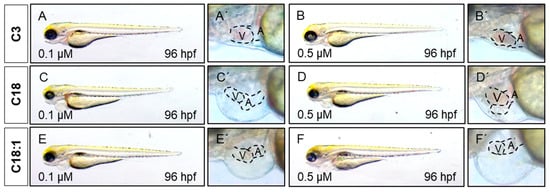
Figure 3. LCAC treatment induces cardiac phenotype in embryonic zebrafish. (A–F) Lateral view of embryos after 48 h of incubation with compounds. (A′–F′) Magnified view of hearts from subfigures A–F.
It is well known that LCACs (e.g., C14: myristoyl-L-carnitine, and C16: palmitoyl-L-carnitine) can suppress mitochondrial function by influencing Ca2+ homeostasis, leading to an inhibition of the TCA cycle and finally to the depletion of ATP [21]. Therefore, we evaluated whether C18 and C18:1 LCAC treatment of zebrafish embryos has an impact on mitochondrial function and subsequently the production of ATP. We first assessed the expression of marker genes such as pparg, ppargc1a, cox4i1 and cox4i2 (Supplementary Table S1), which are known to be downregulated in functionally compromised mitochondria [22,23]. We found that pparg and ppargc1a transcripts were indeed significantly decreased in C18- (0.1 μM: pparg: 0.69 ± 0.07, ppargc1a: 0.81 ± 0.07; 0.5 μM: pparg: 0.50 ± 0.09, ppargc1a: 0.33 ± 0.02, SD, n = 3, p < 0.001, p < 0.0001) and C18:1-treated embryos (0.1 μM: pparg: 0.56 ± 0.09, ppargc1a: 0.64 ± 0.03; 0.5 μM: pparg: 0.69 ± 0.08, ppargc1a: 0.74 ± 0.06, SD, n = 3, p < 0.0001) compared to C3-treated embryos (Figure 2C,D). Consistently, mRNA levels of cox4i1 and cox4i2, which encode subunits of cytochrome oxidase c, involved in the mitochondrial respiratory chain, were also significantly downregulated after C18 (0.1 μM: cox4i1: 0.86 ± 0.06, cox4i2: 0.78 ± 0.08; 0.5 μM: cox4i1: 0.84 ± 0.03, cox4i2: 0.81 ± 0.05, SD, n = 3, p < 0.01, p < 0.001, p < 0.0001) or C18:1 (0.1 μM: cox4i1: 0.80 ± 0.04, cox4i2: 0.81 ± 0.01; 0.5 μM: cox4i1: 0.73 ± 0.05, cox4i2: 0.76 ± 0.05, SD, n = 3, p < 0.001, p < 0.0001) treatment compared to the C3-controls (Figure 2C,D).
To prove that impaired mitochondrial activity caused by LCAC treatment subsequently led to the reduction of ATP, we quantified ATP levels in C18-, C18:1- and C3-treated zebrafish embryos. As a control, we treated zebrafish embryos with sodium fluoroacetate (SFA), a known inhibitor of the TCA cycle [19]. We found a significant reduction of ATP levels in C18- (0.1 μM: 63.89% ± 12.73%; 0.5 μM: 57.25% ± 4.36%, SD, n = 3, p < 0.01, p < 0.001), C18:1- (0.1 μM: 57.36% ± 16.01%; 0.5 μM: 56.66% ± 5.26%, SD, n = 3, p < 0.001) and SFA-treated zebrafish embryos, whereas treatment of zebrafish embryos with C3 (0.1 μM: 104.44% ± 7.70%; 0.5 μM: 89.83% ± 15.04%, SD, n = 3) had no effect on ATP production (Figure 2E,F).
3. Mitochondrial Structure in Cardiomyocytes Is Not Impaired by LCAC Treatment
To determine whether high LCAC uptake in mitochondria affects mitochondrial morphology and structure, thereby leading to defective ATP production, we first conducted quantitative real-time PCR (qRT-PCR) analyses to investigate the expression of mfn1, encoding the mitochondrial membrane protein involved in regulating mitochondrial morphology and metabolism [24,25]. We found the mfn1a and mfn1b mRNA levels in C18- and C18:1-treated embryos to be unaltered compared to the C3 control (Figure 4A,B and Supplementary Table S1). Next, we analyzed the mitochondrial ultrastructure in the ventricular and atrial cardiomyocytes of C3-, C18- and C18:1-treated embryos via transmission electron microscopy (TEM). We found that the mitochondrial structure in cardiomyocytes was not altered in C18- and C18:1-treated zebrafish embryos compared to control-treated (C3) or wild-type embryos (Figure 4C–H and Supplementary Figure S2A). The structure of the inner and outer mitochondrial membrane, as well as the cristae, were completely unaffected by LCAC treatment. Additionally, we found no other subcellular alterations in LCAC-treated embryos compared to C3 controls. Moreover, the mitochondrial density in C18- (0.1 μM: 7.4 ± 1.52/25 µm2, 0.5 μM: 6.8 ± 1.3/25 µm2, n = 5) and C18:1-treated embryonic hearts (0.1 μM: 6.8 ± 3.11/25 µm2, 0.5 μM: 7.0 ± 2.35/25 µm2, n = 5) was not significantly altered compared to C3-treated (0.1 μM: 7.4 ± 1.14/25 µm2, 0.5 μM: 7.8 ± 1.64/25 µm2, n = 5) or wild-type embryos (8.4 ± 1,14/25 µm2, n = 5) (Figure 4I). Next, we assessed mitochondrial size in C18-, C18:1- and C3-treated cardiomyocytes and found that the average size of cardiac mitochondria was also not impaired by C18 (0.1 μM: 0.43 ± 0.34 µm2, 0.5 μM: 0.30 ± 0.27 µm2, n = 10) or C18:1 treatment (0.1 μM: 0.30 ± 0.27 µm2, 0.5 μM: 0.39 ± 0.22 µm2, n = 10) compared to C3-treated or wild-type embryos (C3: 0.1 μM: 0.34 ± 0.17 µm2, 0.5 μM: 0.32 ± 0.16 µm2; wt: 0.37 ± 0.17 µm2, n = 10) (Figure 4J). These findings demonstrate that mitochondria density, morphology and structure are not impaired in cardiomyocytes treated with 0. 1 μM or 0.5 μM of LCACs.
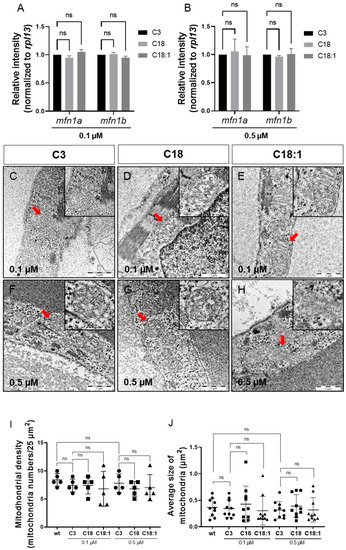
Figure 4. Sustained mitochondrial structure and distribution. (A,B) Quantitative real-time PCR targeting factors responsible for mitochondrial structure (SD, n = 3, ns: p > 0.05). (C–H) Mitochondria of compound-treated embryonic hearts visualized by means of electron microscopy. (I,J) Mitochondrial density and average size of mitochondria in EM images of embryonic zebrafish hearts treated with carnitines (SD, n = 5, 10: respectively, ns: p > 0.05). Abbreviations: ns = not significant, wt = wild-type.
4. Treatment of Embryos with LCACs Leads to Cardiac Dysfunction
It has been reported that mitochondrial dysfunction induced by specific mutations [19] or the pharmacological inhibition of mitochondrial activity [26] induces severe defects in the embryonic zebrafish heart. Since we observed mitochondrial dysfunction in C18- and C18:1-treated zebrafish, as well as a cardiac phenotype, we decided to characterize this phenotype in greater detail. The phenotype, characterized by a pericardial edema, was not observed in control-treated (C3-treated) embryos (Figure 3A–F,A’–F’). Pericardial edema in zebrafish embryos is a sign of either defective heart development or cardiac malfunction [19]. First, to evaluate whether the observed cardiac defects in LCAC-treated embryos were caused by impaired heart chamber differentiation and specification, we dissected embryonic zebrafish hearts at 96 hpf and subsequently performed immunostainings using antibodies directed against meromyosin (MF20) and the atrial-specific myosin heavy chain (S46) to visualize distinguishable ventricle and atrium features. As shown in Figure 5, similarly to the situation in embryos incubated with the control C3, we found that cardiac chamber differentiation and specification was completely unaffected in C18- and C18:1-treated zebrafish embryos (Figure 5A–F and Supplementary Figure S2B). Furthermore, to investigate whether LCAC treatment resulted in diminished cardiomyocyte numbers, we assessed total cardiomyocyte numbers and also counted the ventricular and atrial cardiomyocytes after treatments with C3, C18 and C18:1 separately. To do so, we treated embryos of transgenic zebrafish Tg(myl7:dsRed.nuc) expressing red fluorescence specifically in cardiomyocyte nuclei, with 0.1 μM and 0.5 μM of C18, C18:1 and C3 (Figure 6A–H) enabling the counting of cardiomyocytes, and found that neither the total cardiomyocyte numbers nor ventricular or atrial cardiomyocytes were reduced after treatment of the transgenic zebrafish embryos with 0.1 μM and 0.5 μM of C18, C18:1 or C3, or in the wild-type embryos (Figure 6I–K).
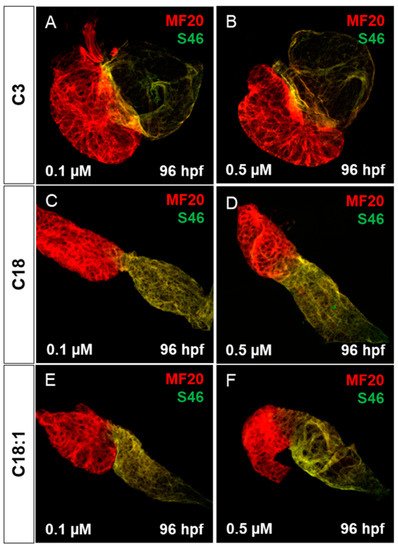
Figure 5. Cardiac chamber specification and development of LCAC-exposed zebrafish larvae. (A–F) Immunofluorescence staining of carnitine-treated embryonic hearts against sarcomeric myosin heavy chain (MF20) and slow developmental myosin heavy chain (S46).
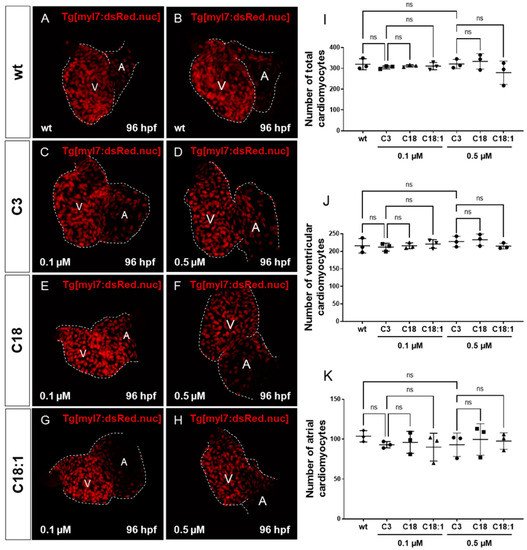
Figure 6. Impact of LCACs on cardiomyocyte numbers in zebrafish embryos. (A–H) Red-fluorescence-positive cardiomyocytes (CMs) of zebrafish embryos in wild-type and 0.1 M or 0.5 µM carnitine-treated embryos. (I–K) Counting CMs of whole heart, ventricle and atrium from wt and C3-, C18- and C18:1-treated embryos (total CMs: wt: 319.33 ± 26.08, C3 0.1 µM: 304.67 ± 7.57, C18 0.1 µM: 311.67 ± 5.51, C18:1 0.1 µM: 310.67 ± 17.56, C3 0.5 µM: 320.67 ± 21.78, C18 0.5 µM: 333.33 ± 37.17, C18:1 0.5 µM: 279.0 ± 55.75, SD, n = 3, ns: p > 0.05; ventricular CMs: wt: 215.67 ± 20.74, C3 0.1 µM: 211.67 ± 11.37, C18 0.1 µM: 215.67 ± 8.33, C18:1 0.1 µM: 220.67 ± 12.34, C3 0.5 µM: 227.67 ± 15.01, C18 0.5 µM: 232.67 ± 16.62, C18:1 0.5 µM: 214.67 ± 8.15, SD, n = 3, ns: p > 0.05; atrial CMs: wt: 103.67 ± 7.02, C3 0.1 µM: 93.0 ± 4.0, C18 0.1 µM: 96.0 ± 13.75, C18:1 0.1 µM: 90.0 ± 17.44, C3 0.5 µM: 93.0 ± 14.73, C18 0.5 µM: 99.67 ± 19.73, C18:1 0.5 µM: 97.67 ± 10.41, SD, n = 3, ns: p > 0.05). Abbreviations: ns = not significant, wt =wild-type.
This entry is adapted from the peer-reviewed paper 10.3390/ijms22168468
This entry is offline, you can click here to edit this entry!