Your browser does not fully support modern features. Please upgrade for a smoother experience.
Please note this is an old version of this entry, which may differ significantly from the current revision.
The Earth’s climate is changing; ice sheets and glaciers are melting and coastal hazards and sea level are rising in response. With a total population of over 300 million people situated on coasts, including 20 of the planet’s 33 megacities (over 10 million people), low-lying coastal areas represent one of the most vulnerable areas to the impacts of climate change. The need to identify and implement adaptation solutions to the impacts of climate change in coastal zones is urgent.
- sea-level rise
- climate change
- shoreline erosion
- adaptation
- managed retreat
1. Introduction
The climate has been changing for as long as we have had the Earth and the Sun. The amount of solar radiation we receive from the Sun has varied over tens of thousands of years due in large part to the Milankovitch cycles, which control the distance between the Earth and the Sun. Sea level is intimately tied to ocean warming and therefore climate change. As temperatures rise during warm or interglacial periods, seawater expands, and the ice covering Antarctica, Greenland and the mountain glaciers of the planet melts, increasing sea levels globally. During cooler (glacial) periods, sea level is lowered as seawater cools and takes up less volume, and more precipitation falls as snow freezes to ice and allows ice sheets and glaciers to expand.
However, global warming from greenhouse gas concentration during the last century has led to higher sea levels, globally driven by the melting of ice sheets and the thermal expansion of the ocean. Sea levels will continue to rise in the future, critically threatening low-lying coastal zones [1]. The potential for high-end sea-level rise may remain despite the ambition of the Paris Agreement to limit global temperature increase well below 2 °C above pre-industrial levels, given the inertia in ocean processes.
Coastal zones are particularly vulnerable to the impacts of sea-level rise. However, sea-level rise is not the only way climate change affects coastlines. Climate changes also affect processes and dynamics in coastal zones through interannual and long-term changes in winds, storm surges or wave action [2,3,4,5,6]. Changes in wind patterns, wave power, extreme waves and sea levels [7,8,9,10,11,12] all drive important effects on coastlines. However, these changes vary between regions and coastlines, from seasonal to interannual and long-term temporal scales, triggering different impacts locally, such as flooding and erosion [3,13,14]. Expected rises in water temperatures and ocean acidification will also impact coastal ecosystems, with important implications for the services they provide, such as fisheries, coastal protection or carbon sequestration [15,16,17,18,19,20,21,22].
Increasing coastal hazards combined with development and demographic concentration in coastal areas makes the need for adaptation urgent. However, the status of implementation is still limited along many coastlines, challenged by important technical, economic, financial and social factors [23]. Coastal communities require targeted responses, plans and informed action in order to address the present and future effects and costs from sea-level rise and climate change.
2. Sea-Level Rise
2.1. Historic Changes in Sea Level
Geological evidence, primarily from sediments and fossils collected from the continental shelf, provides clear global confirmation that the rapid rise of the sea level following the end of the last ice age approximately 20,000 years ago slowed to nearly a halt approximately 7–8000 years ago [24]. From that time until around the mid-1800s, sea level rose at less than 1 mm/year. With the onset of the industrial era and the increasing combustion of fossil fuels (coal, oil and natural gas), the greenhouse gas content of the atmosphere gradually increased. Since the onset of the industrial revolution the content of carbon dioxide in the atmosphere has increased from natural levels varying from approximately 175–275 ppm to 419 ppm today, which is an increase of approximately 50 percent. Greater greenhouse gas concentrations have amplified the Earth’s natural greenhouse effect, leading to a gradually warming planet. Over the past 100 years, the Earth’s climate has warmed by approximately 1 °C (1.8 °F; Figure 1). As temperatures rose, ice sheets and continental glaciers melted at an increasing rate and seawater warmed and expanded. Global sea levels rose in response, raising sea levels at a more rapid rate than over the previous 7000–8000 years [25].
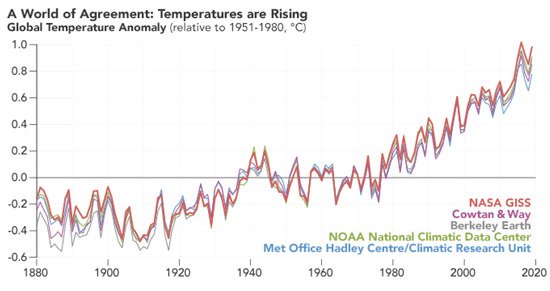
Figure 1. Annual global surface temperature 1850–2019. Source: (NASA Earth Observatory/Robert Simmon). The line plot below shows yearly temperature anomalies from 1880 to 2019 as recorded by NASA, NOAA, the Berkeley Earth research group, the Met Office Hadley Centre (United Kingdom), and the Cowtan and Way analysis. NASA’s temperature analyses incorporate surface temperature measurements from more than 20,000 weather stations, ship- and buoy-based observations of sea surface temperatures, and temperature measurements from Antarctic research stations. Credits: NASA’s Earth Observatory, obtained from: https://earthobservatory.nasa.gov/world-of-change/global-temperatures, accessed on 1 August 2021.
Today, hundreds of tidal gauges around the coastlines of the world are recording sea water levels, but the first measurements date from the mid-1800s. Tide gauges track the local or relative sea level, which is the elevation of the local sea level relative to land motion, including uplift and subsidence. Globally averaging historic records documented sea-level rise values ranging from ~1.2 to ~1.7 mm/year (4.7 to 6.8 in century) over much of the 20st century [26,27]. These tide gauges are not evenly distributed, however, with most in the northern hemisphere (U.S. and Europe). While tide gauges provide relative or local sea-level rise rates, a recent evaluation of 32 tide gauge records from all U.S. coastlines revealed that, with the exception of the U.S. northeast coast and Alaska, every coastal location in the continental U.S. has experienced an upturn in relative sea-level rise rate since 2013–2014, despite wide differences in the magnitude and trending direction of relative sea-level rise acceleration [28].
In 1993, two satellites were placed in orbit (Topex and Poseidon), followed by Jason-1, -2 and -3, with the objective of measuring global or absolute sea level accurately and precisely from space using lasers. The average sea-level rise rate from these satellite measurements over their 27 years of operation is now 3.4 mm/year (13.4 in./century), but this rate is accelerating [29,30]. More recently, independent data from European satellites [31] has been used in order to increase both the time period covered (1991–2019) as well as the geographic distribution of data (from 66 degrees to 82 degrees latitude). Satellite-based observations now allow us to measure that the average acceleration of sea-level rise, which has been 0.1 mm/year2 between 1991 and 2019. The average rate of rise of 3.4 mm/year over the past 27 years has now increased to about 4.8 mm/year, or approximately 18.9 in./century (Figure 2), based on observations of the past 10 years (https://www.aviso.altimetry.fr/en/data/products/ocean-indicators-products/mean-sea-level.html) (accessed on 1 July 2021)
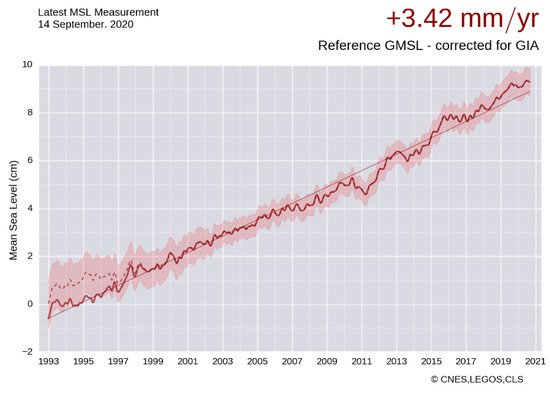
Figure 2. Sea-level rise from satellite altimetry 1993–2020. Source: based on [30], obtained from: https://www.aviso.altimetry.fr/en/data/products/ocean-indicators-products/mean-sea-level.html, accessed on 1 August 2021. The reference global mean sea level (GMSL) is based on data from the TOPEX/Poseidon, Jason-1, Jason-2 and Jason-3 missions from January 1993 to present, after removing the annual and semi-annual signals and applying a 6-month filter. By applying the postglacial rebound correction (−0.3 mm/year), the rise in mean sea level has thus been estimated as 3.4 mm/year (straight line on the figure).
2.2. Future Sea Levels
Tide gauges and satellite-based observations provide a good understanding of past and present sea level. However, the challenge for coastal regions around the planet is projecting sea-level rise and its impacts into the future. This is an important objective of the Intergovernmental Panel on Climate Change (IPCC), but individual geographic entities (local to national governments) are simultaneously involved in developing future sea-level rise projections for their own regions [32]. Future climate projections are developed through global climate models, which include uncertainties and assumptions of future greenhouse gas emissions (i.e., Representative Concentration Pathways) and model the inputs or factors that will affect global climate, including ice melt and consequently sea-level rise [25]. Today, the predictions or projections for the next few decades are in general agreement but estimates for the end-of-century vary between models and depend on Representative Concentration Pathways (RCPs), with increasingly wider uncertainties and ranges by 2100. The latest estimates indicate that values for the end-of-century (2100) range from a low of ~50 cm (~20 inches) to as high as ~310 cm (~10 feet), as a function of greenhouse gas emission scenarios and various probabilities or uncertainties, especially concerning the extent of Greenland and Antarctica ice melt [33] (Figure 3).
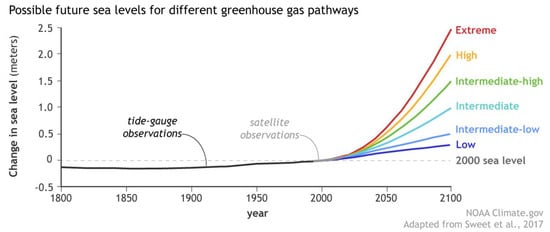
Figure 3. Possible future sea levels for different greenhouse gas emission pathways. Observed sea level from tide gauges (dark gray) and satellites (light gray) from 1800–2015 show historical trajectory. The scenarios differ based on potential future rates of greenhouse gas emissions and differences in the plausible rates of glacier and ice sheet loss. Source: NOAA Climate.gov graph, adapted from Figure 8 in [35].
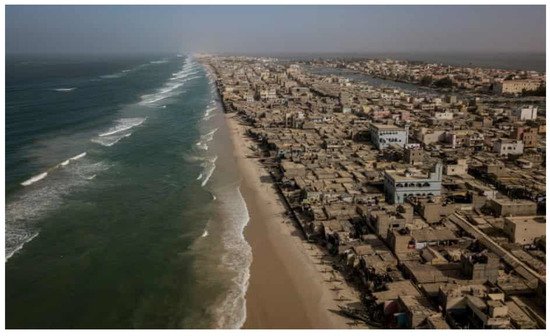
Figure 8. Saint Louis, the old colonial capital of Senegal, faces a flooding threat that has already seen entire villages lost to the Atlantic. Source: The Guardian—https://www.theguardian.com/environment/2020/jan/28/how-the-venice-of-africa-is-losing-its-battle-against-the-rising-ocean, accessed on 1 August 2021.
Understandably, while projections of future sea levels typically only extend out to 2100 due to increasing uncertainties, sea-level rise will not stop then, but will likely continue for decades and even centuries into the future. Even in the absence of further greenhouse emissions, the sea-level rise inertia will continue, and sea levels will increase in the future. There is approximately 66 m (~216 feet) of potential sea-level rise contained in the ice sheets and glaciers of Antarctica, Greenland and the mountain glaciers of the planet (http://www.antarcticglaciers.org/glaciers-and-climate/estimating-glacier-contribution-to-sea-level-rise/, accessed on 1 August 2021). No one believes that these will all melt this century, but this is the total potential that exists if it were all to melt.
In just this century, raising the sea level just 1 m will create substantial issues for developed shorelines around the planet. A recent global assessment determined that approximately 110 million people live below the present high tide today, and 250 million occupy land below current annual flood levels [34]. For the first few meters of sea-level rise, more than 3 million more people are at risk with each vertical 2.5 cm (one inch) of rise. One billion people today, approximately 13% of the entire global population, live less than 10 m (33 feet) above today’s high tide.
3. Effects of Climate Change and Sea-Level Rise in Coastal Areas
3.1. How Future Sea-Level Rise Will Affect Coastal Areas
Looking to the future, the potential loss of public infrastructure and private development due to sea-level rise will have enormous economic impacts on coastal nations globally [1]. Different coastal environments face unique hazards, however, as a result of their geology and topography, regional climatic settings and development patterns. Coasts display a variety of landforms (e.g., estuaries, beaches, dunes, low bluffs, high cliffs and steep mountains) and also differing development patterns (low to high density). Lower-lying shoreline areas are more vulnerable to flooding from wave action, hurricanes and large storm waves acting simultaneously with very high tides and atop the higher sea levels of the future. Higher-elevation areas, such as bluffs, cliffs and coastal mountains, are more vulnerable to coastal erosion from wave attack during high tides or elevated sea levels. Nonetheless, higher sea levels in the future will mean: (1) more frequent and higher elevation flooding of low relief shoreline areas [36,37], followed by permanent inundation and loss of beaches and coastal wetlands [14,38]; and (2) waves reaching and impacting the base of coastal cliffs, bluffs and dunes more often, leading to increased erosion rates.
The economic impacts of coastal hazards will also vary with the degree and type of development and whether it is public or private. Passive erosion, or the gradual loss of beaches from continuing sea-level rise where the back beach has been fixed by a seawall, rock revetment or some other structure, will be a major challenge along highly developed and armored coasts [24,38,39]. Along the intensively developed ~325 km (233-mile) coastline of southern California, for example, where millions of people use the beaches, 38 percent of the entire shoreline has now been armored (Figure 4), and with rising sea levels, the issue of passive erosion and beach loss will become more pressing [40].
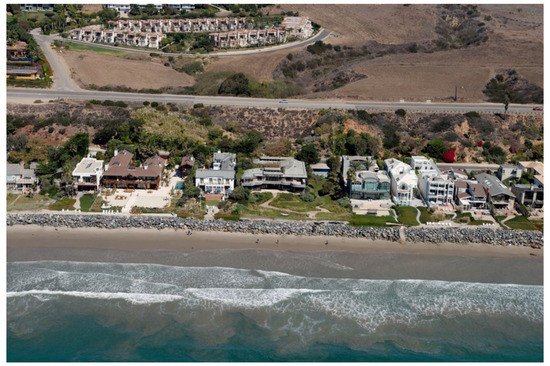
Figure 4. Rip-rap revetment armoring a section of the Malibu, California (USA) shoreline. Courtesy: California Coastal Records Project.
3.2. Nuisance Flooding
To date, much of the research on the impacts of sea-level rise has focused on the occurrence and damage of sea level extremes, such as from tropical cyclones or other storms [41,42,43], as sea-level rise contributes to more flooding by increasing the probability of extreme floods [36,44]. However, nuisance flooding (also known as sunny day floods) has increased on U.S. east coasts in recent decades due to sea-level rise [45,46].
Coastal nuisance flooding is considered to be minor flooding from the sea that causes problems such as flooded roads and overloaded stormwater systems, which can be major inconveniences for people and provide a habitat for bacteria and mosquitoes. Based on over 70 years of observations from the U.S., a study found that the total number of nuisance flooding events caused by tidal changes have increased at an exponential rate since 1950, adding 27% more nuisance flooding occurrences in 2019 [47]. Estuaries show the largest changes because of tide changes associated with anthropogenic alterations, such as the dredging of channels, land reclamation, changes in river flows and other developments.
Frequent high-tide flooding also affects local economic activity. For example, a study in Annapolis, Maryland, found that frequent high-tide floods have reduced visits to the historic downtown by 1.7%, but with 8 and 30 cm (3 and 12 inches) of additional sea-level rise, high-tide floods would reduce visits by 3.6% and 24%, respectively [48]. The impacts of high-tide flooding should also be better characterized and understood in order to help guide efficient local responses and include them in urban planning.
This entry is adapted from the peer-reviewed paper 10.3390/w13162151
This entry is offline, you can click here to edit this entry!