Alzheimer’s disease (AD) is a multifactorial, irreversible, and incurable neurodegenerative disease. The main pathological feature of AD is the deposition of misfolded β-amyloid protein (Aβ) plaques in the brain. The abnormal accumulation of Aβ plaques leads to the loss of some neuron functions, further causing the neuron entanglement and the corresponding functional damage, which has a great impact on memory and cognitive functions. The imaging techniques for the clinical AD diagnosis currently mainly include computed tomography (CT), magnetic resonance imaging (MRI), functional magnetic resonance imaging (fMRI), positron emission tomography (PET), single-photon emission computed tomography (SPECT), magnetic resonance spectroscopy (MRS), and so on. Compared with clinical imaging modalities, optical imaging possesses many advantages (e.g., noninvasiveness, high sensitivity, low cost, high imaging speed, and the ability to carry out three-dimensional imaging with high spatial and temporal resolution), allowing for the detection of biological processes at the cellular or molecular level.
1. Conventional Fluorescence Microscopy Imaging
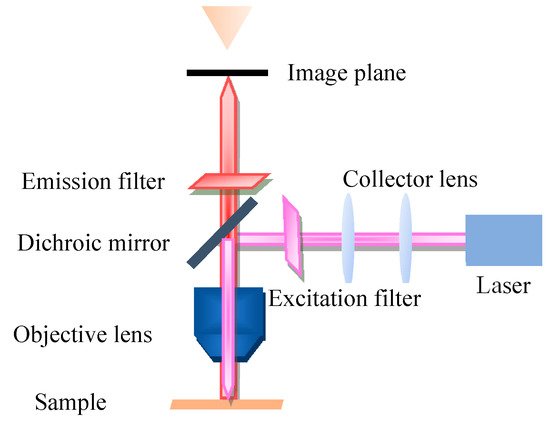
Fluorescence microscopy (FM) is a very powerful tool in biomedicine, which takes ultraviolet as the light source, the wavelength is short, and the resolution is higher than that of ordinary microscopy. The FM principle scheme is shown in Figure 1. FM uses special dichromatic mirrors that reflected shorter wavelengths of light and transmitted longer wavelengths of light. Thus, only the longer wavelength red light from the object can be seen and not the scattered violet light. In addition, FM is commonly used to study the absorption and transportation of intracellular substances, and the distribution and location of chemical substances. Moreover, it has been widely used in the biomedicine field due to its strong detection ability, minor stimulation to the organism, and multiple staining in vivo.
Figure 1. Principle scheme of fluorescence microscopy.
When FM is used in the AD diagnosis field, although Aβ protein itself does not have strong endogenous fluorescence, the specific luminescence mechanism of the fluorescent probe can be used to realize the visualization of Aβ protein. Moreover, an exogenous fluorescent probe can be used to label and visualize Aβ proteins. Fluorescent dyes used for protein labeling can fluoresce brightly at very low concentrations and are generally nontoxic to the body, allowing for in vivo studies. In 2011, Karonyo-Hamaoui et al. [
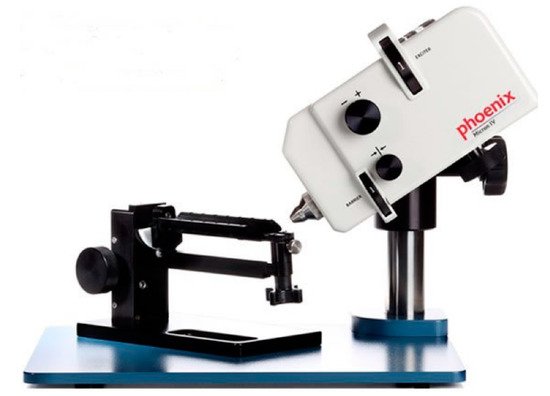
45] reported that Aβ plaques can be found earlier in the retina than that in the brain and accumulate as the disease progresses. They used curcumin as a fluorescent label to perform in vivo fluorescence imaging of Aβ plaques in the retina of AD-Tg mice by utilizing a Micron II rodent retinal imaging microscope (a comprehensive ophthalmology research platform developed by Phoenix Research Labs specially designed for small experimental animals’ eyes, as shown in
Figure 2). Those plaques were not detected in the non-Tg mice. Furthermore, the effect of MOG45D [
46], which has been reported to effectively inhibit Aβ plaque load on retinal plaques was evaluated, and the plaque changes were validated using curcumin as a fluorescent probe. In the 2014 Alzheimer’s Society International Conference, Frost et al. [
47] used a novel system of neurovision imaging and a technique called retinal amyloid imaging to detect Aβ in the eye. The patient also had PET imaging of the Aβ in the brain. The results showed that Aβ levels in the retina were closely related to those in the brain and confirmed that the retina was also an area of high plaque deposition. Furthermore, in 2018, Tes et al. [
48] tested Cy5 and CRANAD-2 (a compound derived from curcumin) as fluorescent probes for observing the growth of plaques in the retina with a fluorescence imaging system. The result shows that CRANAD-2 is a better fluorescent probe for Aβ imaging. Cy5 can colocate with CRANAD-2, which lays a foundation for fluorescence imaging of labeled Aβ.
Figure 2. Physical photos of a Micron II rodent retinal imaging microscope.
In the Aβ imaging of the brain in vitro, Ikonomovic et al. [
49] recently used the FM to compare the ability of two fluorescence probes (i.e., flutemetamol and PiB) to bind to plaques. The results showed that the plaque load of flutemetamol and PiB are strongly correlated, and both of them correspond with the Aβ immunohistochemistry.
2. Confocal Laser Scanning Microscopy Imaging
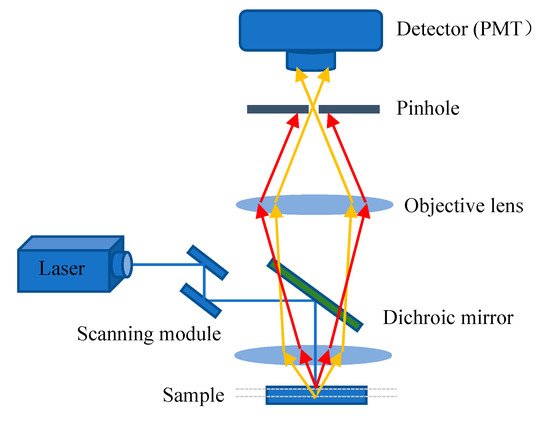
The excitation light, in general, irradiates on the sample to generate fluorescence, and the fluorescence signal is strongest at the focal point of the lens. However, some light scattered by the excitation light will also irradiate other parts of the sample to produce a fluorescence signal on a nonconjugated surface. This will cause fuzzy and faint fluorescence contributions from outside of the focal plane. In addition, a confocal microscope solves the interference of axial and lateral direction of image because the focal point of the objective lens and pinhole point are conjugate points to each other to obtain high resolution (
Figure 3). A pinhole is used to block non-focal plane signals to eliminate focus blurring. Confocal microscopy can filter out signals reaching the detector from out of the focal plane because of the pinhole. This allows for collecting signals from focal planes one by one when changing focus and using the collected images to reconstruct the three-dimensional structure of thick samples. Using confocal microscopy, samples can be scanned and imaged to analyze the three-dimensional spatial structure of cells without damage (
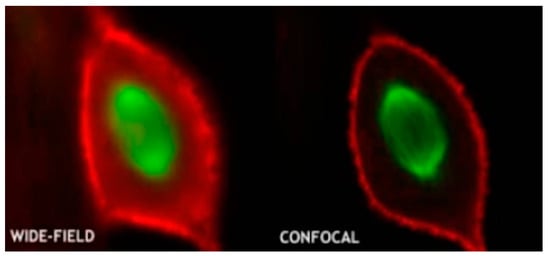
Figure 4) [
50]. This technique allows for the optimum visualization of the brain structures, producing informative images.
Figure 3. Principle scheme of confocal laser scanning microscopy.
Figure 4. Conventional microscopy vs. confocal microscopy (reproduced with permission from the National Institute of Biological Sciences, Beijing).
In the study of the relationship between Aβ plaques and astrocytes or microglia, Li [
51] investigated the variance in the endocytosis, transport, and degradation mechanisms of β-amyloid monomer and oligomer on astrocytes by CLSM, and found that both sAβ
42 and oAβ
42 could enter astrocytes via macrophage. In a later study, Icke et al. [
52] used immunohistochemistry and CLSM to not only collect three-dimensional image datasets from AD mouse models but also automatically detect plaques and their associated microglial responses as well as neuronal damage. Preliminary studies demonstrated that plaque-associated microglia clustering is correlated with plaque size. The data showed that plaque-associated microglia had similar neuroprotective effects on small and large plaques in the early stages of the disease. However, this kind of protection decreased in the late stage. This approach will allow for unbiased quantitative assessment of potential neuroprotective effects in preclinical AD models with Aβ pathology.
Photobiomodulation (PBM) [
53] is a developing field of biomedical research. PBM uses low-level/intensity/power laser or monochromatic light to regulate biological functions and has been used to treat AD and other neurodegenerative diseases in recent years. Hannah et al. [
54] demonstrated that stimulating the eyes of AD mice with a 40-Hz light-emitting diode flash to induce gamma waves eliminated amyloid deposits. Moreover, Singer et al. [
55] have also reached the above conclusion observed through the CLSM. These observations indicate that light induction may cause a systemic effect in the brain, which promoted PBM feasibility in AD treatment. However, further study is still needed to confirm whether it will be therapeutic in human AD.
Alsunusi et al. [
56] used the CLSM in the study of the Aβ aggregation mechanism to detect Aβ localization in PC12. In each PC12 construct, the Aβ immunoreactivity response was found to begin in the neurons at 12 h and to initiate plaque deposition, which indicated that the Aβ accumulation increased with time. However, more studies are needed to determine the deposition and AD pathogenesis caused by intraneuronal Aβ aggregation.
In addition to the study of the brain section, the retinal amyloid deposits have also been found by CLSM. Furthermore, Chibhabha et al. [
57] found that the staining of the curcumin micelles are colocalized with that of the anti-Aβ
42 antibody, and both can excellently stain the plaque region in the hippocampal sections and retina. This study provides a basis for optical imaging of retinal amyloid plaques through the eye in vivo.
However, the spatial resolution of wide-field/confocal FM was limited by the Abbe/Rayleigh limit of light diffraction and could not distinguish structures below 200 nm. Researchers have also recently adopted some new optical imaging methods to improve the image resolution of Aβ plaques. Moreover, Wang et al. [
58] synthesized a series of aggregation-induced emission fluorogens to enhance fluorescence intensity. Both PD-NA and PD-NA-TEG fluorescence probes exhibit excellent binding to Aβ plaques, and the imaging resolution can be improved to <100 nm using the super-resolution fluorescence imaging system, allowing for clearer observation of Aβ deposition. Furthermore, Ni et al. [
59] developed a novel imaging approach by overlaying signals extracted from small focal points to form high-resolution images. Transcranial amyloid deposition can be imaged across the entire brain of mice with AD at a 20-μm resolution by using this large field of view multi-focus FM in combination with a near-infrared dye. To further improve the resolution of the three-dimensional imaging system, Prof. Hui Gong’s team from Wuhan National Research Center for Optoelectronics used the self-developed fluorescence micro-optical sectioning tomography system to image the whole brain and completed the first high-resolution three-dimensional reconstruction of hypothalamic–neurohypophysial system. Immunostaining showed that the detection rate of Aβ plaques larger than 10 μm in diameter was 97.71% ± 0.18%. A dataset of Aβ plaque distributed throughout the brain of 5XFAD transgenic mice was obtained with an imaging resolution of 0.32 × 0.32 × 2 μm [
60]. This approach will contribute to the comprehensive and efficient study of the pathogenesis and efficacy evaluation of AD.
3. Near-Infrared Fluorescence Imaging
Near-infrared fluorescence imaging (NIRF) has been rapidly developed in recent years because of its high sensitivity, noninvasiveness, simple operation, and the ability to avoid the interference of spontaneous fluorescence in biological tissues. NIRF fluorescent imaging mainly includes the development of biocompatible NIR fluorescent dyes and the synthesis of various probes. During conventional fluorescence imaging in the visible range, both excitation and emission are absorbed or scattered by the tissue, resulting in significant attenuation of the detected emission signal. Moreover, the tissue autofluorescence (which is mostly in the visible range) also interferes with the emission signal acquisition. The scattering and absorption of excitation and emission can be effectively reduced and the required lower excitation energy causes less damage to the biological tissue when the wavelength of the probe is located in the near-infrared region (NIR, 650 to 900 nm). The NIRF has become an essential tool for the analysis of biological samples in vitro and in vivo imaging of small animals. Moreover, the use of amyloid-specific excitable fluorescence probes with emission at 600 to 700 nm has the advantage in comparison with conventionally used probes as they are well suited for deep imaging of amyloid plaques in AD mouse brain in vivo [
61,
62]. Therefore, the use of NIRF probes targeting Aβ plaques in the brain is of great significance for preclinical study, histopathological examination, and construction of AD models [
63,
64,
65]. NIRF fluorescent imaging mainly includes the development of biocompatible NIR fluorescent dyes and the synthesis of various probes. The ideal NIRF fluorescent probe should have the following characteristics: (1) targeting Aβ with high selectivity and high affinity, (2) the emission wavelength is in the near-infrared spectral range, (3) rapid penetration of the blood–brain barrier (BBB) and rapid clearance in the organism, (4) high quantum yield, (5) low affinity with bovine serum albumin (BSA), (6) easy synthesis, and most importantly, (7) binding to Aβ plaques, which should significantly change its fluorescence properties (e.g., fluorescence intensity, fluorescence lifetime, emission wavelength, and quantum yield). In this section, the application of NIR probes in Aβ imaging and some commercial NIR imaging instruments will be described.
Raymond et al. [
25,
65] compared specific probes for Aβ with emission wavelengths at 630 and 800 nm and showed that the probes with emission wavelengths at 800 nm had a better signal-to-noise ratio and a higher affinity for Aβ, which would improve the current near-infrared amyloid imaging capability and beyond that of AO1987 (with absorption and emission peaks at 650 and 750 nm, which makes it the most efficient probe for Aβ plaque in the brain at that time). Moreover, curcumin is a specific probe for imaging Aβ plaques. However, its application in near-infrared imaging is limited due to its short emission wavelength and limited transmission through the blood–brain barrier. Furthermore, Ran et al. [
64] designed a NIRF probe derived from curcumin, CRANAD-2, with emission at 805 nm. The fluorescence intensity was significantly increased by 70 times in the presence of Aβ aggregates compared with the fluorescence intensity observed in phosphate-buffered saline (pH 7.4). In addition, CRANAD-2 was colocalized with standard thioflavin T staining signals in an in vitro brain tissue analysis. In in vivo experiments, the fluorescence intensity of the transgenic group was higher than that of the control group, and the plaques were colocalized with histological staining signals.
Schmidt et al. [
66] then developed in 2012 a novel NIRF probe THK-265(Ex = 665 nm, Em = 725 nm, and Kd = 97 nM) to investigate the different stages of Aβ plaques in transgenic mice in vivo by using an Odyssey
® Infrared Imaging System (OIIS, LI-COR Biosciences, Lincoln, NE, USA). The results showed that the intensity of the NIRF signal was closely related to plaque load, indicating its practical value in monitoring directly the progression of Aβ aggregation, and opening the possibility of effective presymptom monitoring of Aβ deposition in the aging brain. In addition, Yang et al. [
32] recently demonstrated that NIRF ocular imaging (NIRFOI), which was performed on IVIS
® Spectrum (PerkinElmer, Hopkinton, MA, USA) could provide higher sensitivity for Aβs than brain NIRF imaging does. By using NIRFOI with a near-infrared probe CRANAD-102 (Ex = 605 nm, and Em = 680 nm), they have observed significant CRANAD-102 expression in APP/PS1 at about 60 min, while WT has not. This high sensitivity is significant for both diagnosis and therapy monitoring.
This entry is adapted from the peer-reviewed paper 10.3390/bios11080255