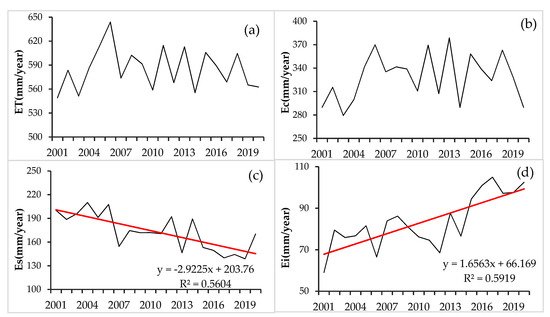
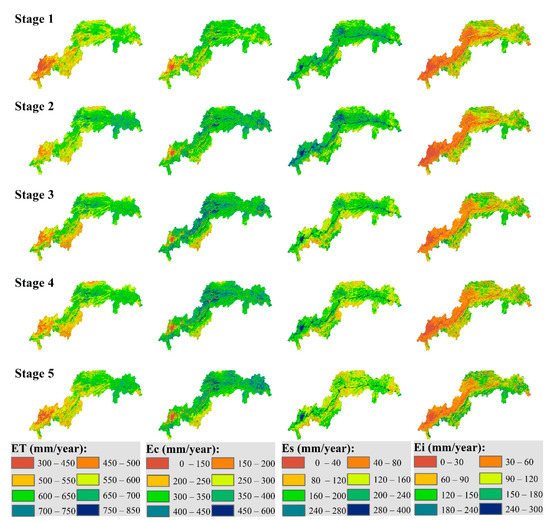
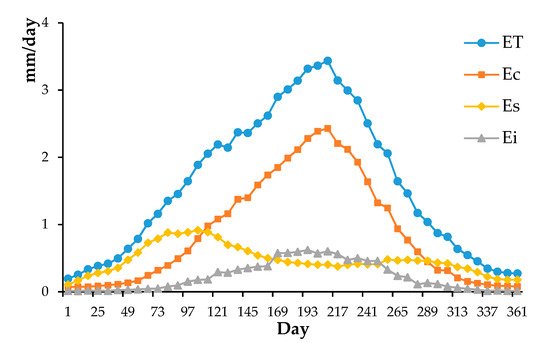
Identifying the spatiotemporal variations and influencing climate factors of evapotranspiration (ET) and its components (vegetation transpiration (Ec), soil evaporation (Es), and canopy interception evaporation (Ei)) can greatly improve our understanding of water cycle, carbon cycle, and biogeochemical processes in a warming climate. As the world′s largest hydropower project, the construction of the Three Gorges Project (TGP) coupled with the significant land use/land cover change affected the regional water and energy exchange in the Three Gorges Reservoir Area (TGRA). This study aimed to reveal the spatiotemporal variations and influencing climate factors in ET and its components using PML-V2 products in TGRA during 2000–2020. Results showed that the mean annual ET, Ec, Es, and Ei in TGRA were 585.12, 328.49, 173.07, and 83.56 mm, respectively. The temporal variation of ET was dominated by Ec, with no significant change in the time trend. Es decreased (2.92 mm/y) and Ei increased (1.66 mm/y) significantly mainly in the cultivated land. ET, Ec, and Ei showed a similar seasonal variation pattern with a single peak, while Es presented a bimodal pattern. From the pre-impoundment to the first impoundment period, ET and Ec mainly increased in the head of TGRA, meanwhile, Es in urban area increased significantly by 27.8%. In the subsequent impoundment periods, ET and Ec changed slightly while Es sharply decreased. The Ei increased persistently during different impoundment period. The dominant climate factors affecting changes in Ec and Es were air temperature, vapor pressure deficit, and sunshine hours, while the variation of Ei was mainly affected by air temperature, vapor pressure deficit, and precipitation.
- evapotranspiration
- components
- climate change
- PML-V2
- Three Gorges Reservoir
1. Introduction
2. Analysis on Results
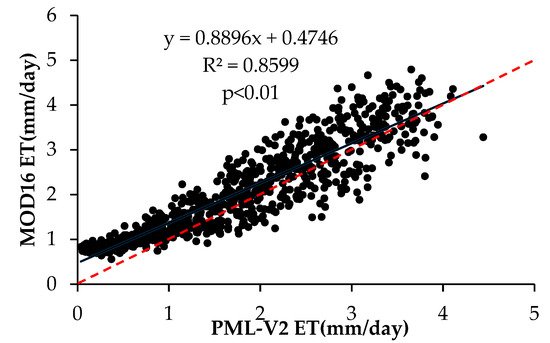
2.1. Model Validation
2.2. Interannual Variation of ET and Its Components
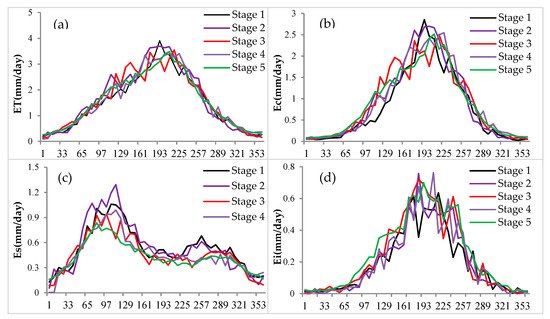
2.3. Seasonal Patterns of ET and Its Components
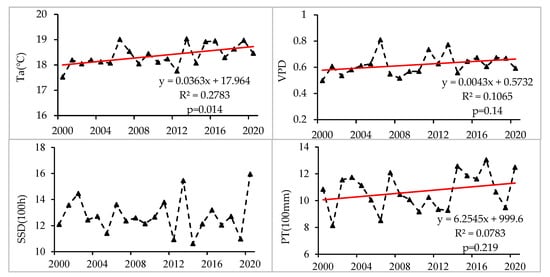
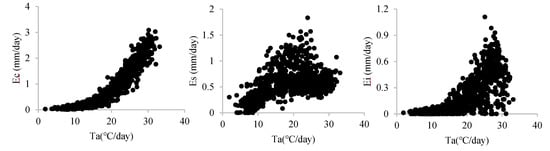
2.4. Response of ET and Its Components Variation to Climate Change
| Station | Var Explained (%) | PT | Ta | WS | VPD | SSD | |
|---|---|---|---|---|---|---|---|
| ET | BD | 89.84 | 0.0922 | 0.6573 | 0.0204 | 0.3740 | 0.1206 |
| CS | 86.21 | 0.1097 | 1.0272 | 0.0138 | 0.4316 | 0.1264 | |
| FD | 88.23 | 0.0930 | 0.7969 | 0.0557 | 0.4015 | 0.1345 | |
| FJ | 89.60 | 0.0967 | 0.7408 | 0.0173 | 0.3404 | 0.1123 | |
| JJ | 86.04 | 0.1121 | 0.7987 | 0.0171 | 0.3271 | 0.1782 | |
| SPB | 73.73 | 0.1085 | 0.8812 | 0.0299 | 0.4329 | 0.1254 | |
| WZ | 89.08 | 0.0862 | 0.8290 | 0.0402 | 0.5208 | 0.1885 | |
| XS | 89.79 | 0.1004 | 0.7454 | 0.0120 | 0.3614 | 0.0831 | |
| Mean | 86.57 | 0.0999 | 0.8096 | 0.0258 | 0.3987 | 0.1336 | |
| Ec | BD | 90.02 | 0.0288 | 0.3951 | 0.0129 | 0.1837 | 0.0780 |
| CS | 84.73 | 0.0271 | 0.5732 | 0.0141 | 0.2514 | 0.0851 | |
| FD | 87.76 | 0.0273 | 0.4418 | 0.0326 | 0.2150 | 0.0940 | |
| FJ | 91.16 | 0.0393 | 0.5359 | 0.0161 | 0.1919 | 0.0839 | |
| JJ | 83.54 | 0.0374 | 0.4638 | 0.0089 | 0.1410 | 0.0851 | |
| SPB | 70.36 | 0.0550 | 0.5373 | 0.0257 | 0.2202 | 0.0723 | |
| WZ | 87.54 | 0.0229 | 0.3838 | 0.0148 | 0.1544 | 0.0876 | |
| XS | 89.89 | 0.0381 | 0.5237 | 0.0091 | 0.2211 | 0.0678 | |
| Mean | 85.63 | 0.0345 | 0.4818 | 0.0168 | 0.1973 | 0.0817 | |
| Es | BD | 35.42 | 0.0083 | 0.0315 | 0.0025 | 0.0255 | 0.0093 |
| CS | 29.66 | 0.0076 | 0.0453 | 0.0007 | 0.0264 | 0.0195 | |
| FD | 26.86 | 0.0040 | 0.0321 | 0.0040 | 0.0185 | 0.0086 | |
| FJ | 33.67 | 0.0060 | 0.0225 | 0.0019 | 0.0169 | 0.0076 | |
| JJ | 53.60 | 0.0232 | 0.0815 | 0.0071 | 0.0571 | 0.0280 | |
| SPB | 39.51 | 0.0140 | 0.0756 | 0.0062 | 0.0547 | 0.0120 | |
| WZ | 67.26 | 0.0207 | 0.1137 | 0.0133 | 0.0978 | 0.0332 | |
| XS | 32.43 | 0.0113 | 0.0431 | 0.0025 | 0.0231 | 0.0064 | |
| Mean | 39.80 | 0.0119 | 0.0557 | 0.0048 | 0.0400 | 0.0156 | |
| Ei | BD | 65.44 | 0.0188 | 0.1020 | 0.0034 | 0.0233 | 0.0069 |
| CS | 62.63 | 0.0220 | 0.1270 | 0.0051 | 0.0314 | 0.0120 | |
| FD | 65.74 | 0.0163 | 0.0957 | 0.0048 | 0.0227 | 0.0097 | |
| FJ | 70.16 | 0.0085 | 0.0331 | 0.0003 | 0.0075 | 0.0046 | |
| JJ | 60.74 | 0.0027 | 0.0116 | 0.0004 | 0.0040 | 0.0022 | |
| SPB | 43.67 | 0.0021 | 0.0156 | 0.0002 | 0.0055 | 0.0038 | |
| WZ | 58.74 | 0.0027 | 0.0118 | 0.0004 | 0.0046 | 0.0026 | |
| XS | 73.21 | 0.0178 | 0.0473 | 0.0008 | 0.0109 | 0.0028 | |
| Mean | 62.54 | 0.0114 | 0.0555 | 0.0019 | 0.0138 | 0.0056 |
| Name | Longitude (°E) |
Latitude (°N) |
Elevation (m a.s.l) |
PT (mm) |
Ta (°C) |
WS (m/s) |
SSD (h) |
VPD |
|---|---|---|---|---|---|---|---|---|
| Badong (BD) | 110.22 | 31.02 | 3340 | 1085.44 | 17.53 | 1.77 | 1602.23 | 0.64 |
| Changshou (CS) | 107.04 | 29.50 | 3776 | 1103.62 | 18.15 | 1.31 | 1126.22 | 0.54 |
| Fengdu (FD) | 107.41 | 29.52 | 2180 | 1035.60 | 18.85 | 1.29 | 1265.67 | 0.64 |
| Fengjie (FJ) | 109.30 | 31.03 | 6073 | 1038.52 | 18.39 | 1.73 | 1372.31 | 0.69 |
| Jiangjin (JJ) | 106.15 | 29.17 | 2614 | 1009.62 | 18.89 | 1.41 | 1087.69 | 0.41 |
| Shapingba (SPB) | 106.28 | 29.35 | 2591 | 1134.39 | 18.96 | 1.40 | 989.72 | 0.63 |
| Wanzhou (WZ) | 108.24 | 30.46 | 1867 | 1177.85 | 18.87 | 0.93 | 1203.34 | 0.41 |
| Xingshan (XS) | 110.46 | 31.14 | 2755 | 962.15 | 17.23 | 1.11 | 1560.64 | 0.46 |
3. Current Insights
This entry is adapted from the peer-reviewed paper 10.3390/w13152111
References
- Wang, X.; de Linage, C.; Famiglietti, J.; Zender, C.S. Gravity Recovery and Climate Experiment (GRACE) detection of water storage changes in the Three Gorges Reservoir of China and comparison with in situ measurements. Water Resour. Res. 2011, 47, W12502.
- Tang, Q.; Bao, Y.; He, X.; Fu, B.; Collins, A.L.; Zhang, X. Flow regulation manipulates contemporary seasonal sedimentary dynamics in the reservoir fluctuation zone of the Three Gorges Reservoir, China. Sci. Total Environ. 2016, 548, 410–420.
- Edmonds, R.L. The Sanxia (3 Gorges) Project—The environmental argument surrounding China super dam. Glob. Ecol. Biogeogr. Lett. 1992, 2, 105–125.
- Fu, B.-J.; Wu, B.-F.; Lue, Y.-H.; Xu, Z.-H.; Cao, J.-H.; Niu, D.; Yang, G.-S.; Zhou, Y.-M. Three Gorges Project: Efforts and challenges for the environment. Prog. Phys. Geogr. Earth Environ. 2010, 34, 741–754.
- Xu, X.; Tan, Y.; Yang, G. Environmental impact assessments of the Three Gorges Project in China: Issues and interventions. Earth Sci. Rev. 2013, 124, 115–125.
- Zhang, Q.; Lou, Z. The environmental changes and mitigation actions in the Three Gorges Reservoir region, China. Environ. Sci. Policy 2011, 14, 1132–1138.
- Wang, H.; Xiao, W.; Zhao, Y.; Wang, Y.; Hou, B.; Zhou, Y.; Yang, H.; Zhang, X.; Cui, H. The spatiotemporal variability of evapotranspiration and its response to climate change and land use/land cover change in the Three Gorges reservoir. Water 2019, 11, 1739.
- Zhang, Y.; Kong, D.; Gan, R.; Chiew, F.H.S.; McVicar, T.R.; Zhang, Q.; Yang, Y. Coupled estimation of 500 m and 8-day resolution global evapotranspiration and gross primary production in 2002–2017. Remote Sens. Environ. 2019, 222, 165–182.
- Li, C.; Zhang, Y.; Shen, Y.; Kong, D.; Zhou, X. LUCC-driven changes in gross primary production and actual evapotranspiration in Northern China. J. Geophys. Res. Atmos. 2020, 125, e2019JD031705.
- Hu, G.; Jia, L.; Menenti, M. Comparison of MOD16 and LSA-SAF MSG evapotranspiration products over Europe for 2011. Remote Sens. Environ. 2015, 156, 510–526.
- Jang, K.; Kang, S.; Lim, Y.-J.; Jeong, S.; Kim, J.; Kimball, J.S.; Hong, S.Y. Monitoring daily evapotranspiration in Northeast Asia using MODIS and a regional Land Data Assimilation System. J. Geophys. Res. Atmos. 2013, 118, 12927–12940.
- Trambauer, P.; Dutra, E.; Maskey, S.; Werner, M.; Pappenberger, F.; van Beek, L.P.H.; Uhlenbrook, S. Comparison of different evaporation estimates over the African continent. Hydrol. Earth Syst. Sci. 2014, 18, 193–212.
- Srivastava, A.; Sahoo, B.; Raghuwanshi, N.S.; Singh, R. Evaluation of variable-infiltration capacity model and MODIS-terra satellite-derived grid-scale evapotranspiration estimates in a river basin with tropical monsoon-type climatology. J. Irrig. Drain. Eng. 2017, 143, 04017028.
- Srivastava, A.; Kumari, N.; Maza, M. Hydrological response to agricultural land use heterogeneity using variable infiltration capacity model. Water Resour. Manag. 2020, 34, 3779–3794.
- Sharma, K.; Irmak, S.; Kukal, M.S. Propagation of soil moisture sensing uncertainty into estimation of total soil water, evapotranspiration and irrigation decision-making. Agric. Water Manag. 2021, 243, 106454.
- Ma, N.; Szilagyi, J.; Zhang, Y.; Liu, W. Complementary-relationship-based modeling of terrestrial evapotranspiration across China during 1982–2012: Validations and spatiotemporal analyses. J. Geophys. Res. Atmos. 2019, 124, 4326–4351.
- Huo, A.; Yang, L.; Luo, P.; Cheng, Y.; Peng, J.; Nover, D. Influence of landfill and land use scenario on runoff, evapotranspiration, and sediment yield over the Chinese Loess Plateau. Ecol. Indic. 2021, 121, 107208.
- Wang, W.; Li, J.; Yu, Z.; Ding, Y.; Xing, W.; Lu, W. Satellite retrieval of actual evapotranspiration in the Tibetan Plateau: Components partitioning, multidecadal trends and dominated factors identifying. J. Hydrol. 2018, 559, 471–485.
- Jasechko, S.; Sharp, Z.D.; Gibson, J.J.; Birks, S.J.; Yi, Y.; Fawcett, P.J. Terrestrial water fluxes dominated by transpiration. Nature 2013, 496, 347.
- Niu, Z.; He, H.; Zhu, G.; Ren, X.; Zhang, L.; Zhang, K. A spatial-temporal continuous dataset of the transpiration to evapotranspiration ratio in China from 1981–2015. Sci. Data 2020, 7, e2020JG005823.
- Lu, J.; Wang, G.; Gong, T.; Hagan, D.F.T.; Wang, Y.; Jiang, T.; Su, B. Changes of actual evapotranspiration and its components in the Yangtze River valley during 1980–2014 from satellite assimilation product. Theor. Appl. Climatol. 2019, 138, 1493–1510.
- Jiang, Z.-Y.; Yang, Z.-G.; Zhang, S.-Y.; Liao, C.-M.; Hu, Z.-M.; Cao, R.-C.; Wu, H.-W. Revealing the spatio-temporal variability of evapotranspiration and its components based on an improved Shuttleworth-Wallace model in the Yellow River Basin. J. Environ. Manag. 2020, 262, 110310.
- Hu, Z.; Wu, G.; Zhang, L.; Li, S.; Zhu, X.; Zheng, H.; Zhang, L.; Sun, X.; Yu, G. Modeling and partitioning of regional evapotranspiration using a satellite-driven water-carbon coupling model. Remote Sens. 2017, 9, 54.
- Zhang, Y.; Pena-Arancibia, J.L.; McVicar, T.R.; Chiew, F.H.S.; Vaze, J.; Liu, C.; Lu, X.; Zheng, H.; Wang, Y.; Liu, Y.Y.; et al. Multi-decadal trends in global terrestrial evapotranspiration and its components. Sci. Rep. 2016, 6, 1–12.
- Lawrence, D.M.; Thornton, P.E.; Oleson, K.W.; Bonan, G.B. The partitioning of evapotranspiration into transpiration, soil evaporation, and canopy evaporation in a GCM: Impacts on land-atmosphere interaction. J. Hydrometeorol. 2007, 8, 862–880.
- Scott, D.F.; Bruijnzeel, L.A.; Vertessy, R.A.; Calder, I.R. HYDROLOGY—Impacts of Forest Plantations on Streamflow. In Encyclopedia of Forest Sciences; Academic Press: Cambridge, MA, USA, 2004.
- Hao, B.; Ma, M.; Li, S.; Li, Q.; Hao, D.; Huang, J.; Ge, Z.; Yang, H.; Han, X. Land use change and climate variation in the Three Gorges reservoir catchment from 2000 to 2015 based on the Google Earth engine. Sensors 2019, 19, 2118.
- Zheng, Y.; Wang, L.; Chen, C.; Fu, Z.; Peng, Z. Using satellite gravity and hydrological data to estimate changes in evapotranspiration induced by water storage fluctuations in the Three Gorges reservoir of China. Remote Sens. 2020, 12, 2143.
- Pascolini-Campbell, M.; Reager, J.T.; Chandanpurkar, H.A.; Rodell, M. A 10 per cent increase in global land evapotranspiration from 2003 to 2019. Nature 2021, 593, 543–547.
- Byrne, M.P.; O’Gorman, P.A. Land-ocean warming contrast over a wide range of climates: Convective quasi-equilibrium theory and idealized simulations. J. Clim. 2013, 26, 4000–4016.
- Penman, H.L. Natural evaporation from open water, bare soil and grass. Proc. R. Soc. Lond. Ser. Math. Phys. Sci. 1948, 193, 120.
- Huang, C.; Huang, X.; Peng, C.; Zhou, Z.; Teng, M.; Wang, P. Land use/cover change in the Three Gorges Reservoir area, China: Reconciling the land use conflicts between development and protection. Catena 2019, 175, 388–399.
- Zhang, J.; Liu, Z.; Sun, X. Changing landscape in the Three Gorges Reservoir area of Yangtze River from 1977 to 2005: Land use/land cover, vegetation cover changes estimated using multi-source satellite data. Int. J. Appl. Earth Obs. Geoinf. 2009, 11, 403–412.
- Shen, M.; Piao, S.; Jeong, S.-J.; Zhou, L.; Zeng, Z.; Ciais, P.; Chen, D.; Huang, M.; Jin, C.-S.; Li, L.Z.X.; et al. Evaporative cooling over the Tibetan Plateau induced by vegetation growth. Proc. Natl. Acad. Sci. USA 2015, 112, 9299–9304.
- Yao, T.; Thompson, L.; Yang, W.; Yu, W.; Gao, Y.; Guo, X.; Yang, X.; Duan, K.; Zhao, H.; Xu, B.; et al. Different glacier status with atmospheric circulations in Tibetan Plateau and surroundings. Nat. Clim. Chang. 2012, 2, 663–667.
- Massmann, A.; Gentine, P.; Lin, C. When does vapor pressure deficit drive or reduce evapotranspiration? J. Adv. Modeling Earth Syst. 2019, 11, 3305–3320.