Magnetic resonance spectroscopy (MRS) is a powerful tool that allows direct quantification of metabolites in tissue or areas of interest. MRS has been applied in both research and clinical studies to assess liver fat noninvasively in vivo. MRS has also demonstrated excellent performance in liver fat assessment with high sensitivity and specificity compared to biopsy and other imaging modalities. Because of these qualities, MRS has been generally accepted as the reference standard for the noninvasive measurement of liver steatosis. MRS is an evolving technique with high potential as a diagnostic tool in the clinical setting.
- magnetic resonance spectroscopy
- liver fat
- hepatic steatosis
- liver fat fraction
- 1H-MRS
1. Introduction
2. The Importance of a Sensitive Method for Liver Fat Assessment Important
Hepatic steatosis or the accumulation of liver fat is the pathological hallmark of NAFLD and has many other clinical implications.
The criterion for the diagnosis of NAFLD is excess fat accumulation in the liver that affects more than 5% of hepatocytes [4]. The degree of liver steatosis is stratified by the percentage of hepatocytes affected by steatosis, as follows: S0 (<5%), S1 (5–33%), S2 (>33–66%), and S3 (>66%) [5].
Currently, the gold standard for identifying more aggressive NASH is a liver biopsy in staging fibrosis and liver steatosis [6]. In addition to providing information for staging liver steatosis, a liver biopsy also assists with identification of the manifestation of other liver diseases that might coexist or have similar characteristics to fatty liver, such as chronic hepatitis C infection [7]. However, the percutaneous liver biopsy is limited by its invasive nature and is not suitable for clinical applications that require real-time monitoring of liver fat levels throughout therapeutic intervention.
Notably, an early stage of NAFLD can easily be reversed with lifestyle modification [8]. While the identification of this early stage may help prevent disease progression, a sensitive and noninvasive method for liver steatosis will prove to be more useful in later stages of NAFLD. Considering the prevalence and severe consequences of advanced NAFLD, sensitive and real-time monitoring tools would help with the evaluation of the therapeutic response that might lead to small changes in liver fat in the early stage of intervention. At present, serum biomarkers and imaging techniques have been proposed as two main approaches for noninvasive liver steatosis assessment [9], and MRS is one of those techniques.
3. Basic Principle for MRS
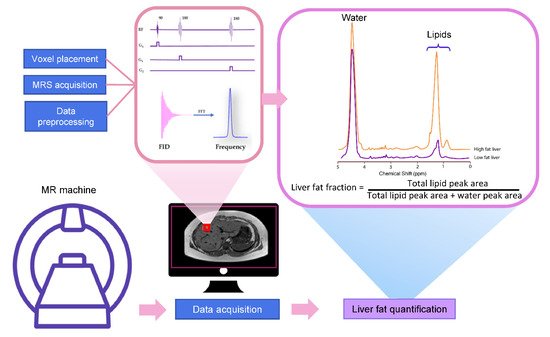
MRS utilizes the MR principle to identify and quantify the metabolite from the tissue of interest. The signal in MRS is obtained in the same way as MR imaging, that is, a radiofrequency (RF) at specific resonance is applied to nuclei (e.g., 1H, 13C, 31P, etc.) in a static magnetic field to generate a signal [10]. The pulse sequence and MR signal acquisition are shown in Figure 1. This signal comes from a specific area of interest or the voxel that is then Fourier transformed from the MR signal to the MR spectrum. Unique chemical properties and environments lead to the unique proton resonance frequency and peak shape of each metabolite. This slight shift of the resonance position along the x-axis of the spectrum is termed the chemical shift, which is measured in ppm [11]. The calculation of ppm is obtained from the distance in Hertz (Hz) relative to a reference peak such as water, divided by the operating frequency of the MR system [11][12]. The proton resonance frequency is proportional to the MR field strength at 63.9 MHz at 1.5 Tesla, 127.8 MHz at 3 Tesla, and 298.2 MHz at 7 Tesla. Therefore, the chemical shift in ppm can be compared across studies irrespective of MR field strength. The MR field strength is also proportional to the improved signal-to-noise ratio (SNR). Thus, the increased field strength of MR machines improves spectral resolution and the separation of metabolite peaks [13].
3.1. Liver MRS Spectrum
Most of the visible peaks in the MRS liver spectrum obtained from the clinical MR scanner (1.5-3 Tesla) are fat and water. While water shows a single peak at approximately 4.7 ppm, fat shows multiple peaks due to its complex chemical components (Table 1) [14][15][16]. Six resonances of fat are usually detected with the main lipid peak at approximately 0.9 to 2.75 ppm. There are also unresolved fat resonances at 4.2 and 5.3 ppm from glycerol and olefinic acid, respectively (Figure 2) [15][16][17]. These two peaks overlap with the water peak signal at 4.7 ppm. While the correct identification of the liver fat peak is possible in MR systems with a high field, it is less feasible in a lower field with lower spectral resolution and broader linewidth. The misidentification of lipid peaks leads to quantification errors in liver fat; therefore, these unresolvable peaks are not qualified for diagnostic purposes [11].
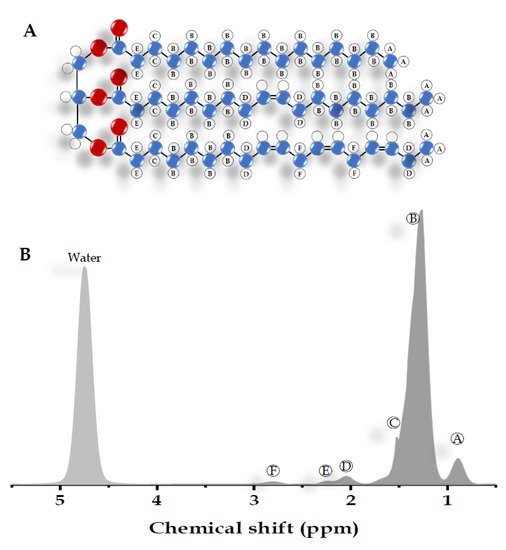
| Peak | Chemical Shift (ppm) | Type | Hydrogen Atom Position (Bold) |
|---|---|---|---|
| A | 0.9 | Methyl | -CH2-CH3 |
| B | 1.3 | Methylene | -(CH2)n- |
| C | 1.59 | β-Carboxyl | -CH2-CH2-COO |
| D | 2.1 | α-olefinic | -CH2-CH=CH- |
| E | 2.25 | α-Carboxyl | -CH2-CH2-COO |
| F | 2.75 | Diacyl | -CH=CH-CH2-CH=CH- |
| - | 4.7 | Water | H2O |
3.2. The Acquisition of Liver MRS Spectrum
MRS liver spectra are often obtained using a single-voxel technique [18][14]. The advantage of the single-voxel technique is that it provides a high SNR from a large volume of liver sampled. While multivoxel spectroscopy allows larger coverage of the liver than other techniques, the distance from the coil to the organ, longer acquisition time, and reduced shim quality limit its application [14][12][19].
A coil with a multichannel coil array receiver is recommended over a body coil for MRS acquisition to maximize the SNR [11][20]. The quality of the MRS spectrum is sensitive to inhomogeneous magnetic fields. Good magnetic field homogeneity is required for good spectral resolution or small line width to distinguish peaks from each other. The use of shimming of the magnetic field is therefore necessary to minimize field inhomogeneity across the voxel. While most commercially available MR machines have automated shimming prior to MRS acquisition, manual shimming can also be performed to improve field homogeneity.
The most common pulse sequences for MRS spectral acquisition are stimulated-echo acquisition mode (STEAM) and point-resolved spectroscopy (PRESS). STEAM is a stimulated echo-based technique that utilizes three 90° angles to create well-defined voxels and reduce contaminating signals outside the voxel [18]. PRESS is a spin echo-based technique that uses a 90° pulse followed by 180°–180° (Figure 1).
3.3. MRS Spectrum Analysis and Liver Fat Quantification
4. Application of MRS for Liver Fat Quantification
4.1. Evaluation of Diffuse Liver Fat Disposition
MRS has been used in clinical trials to investigate liver steatosis grading. Previous studies have applied MRS to investigate liver steatosis grading in a large group of subjects [33][34]. This illustrates the feasibility of MRS for hepatic steatosis grading in the general population.
Moreover, MRS can estimate the subspecies of liver fat from MRS from the lipid subspecies index using an equation based on the oil spectra model [35][36][37]. It has been suggested that the degree of saturation of liver lipids may be associated with liver fat accumulation on hepatocellular damage and disease progression [36][38]. Each peak of lipid spectra reflects the different chemical positions within the triglyceride molecule, including unsaturated, saturated, monounsaturated, and polyunsaturated fatty acids [39]. The fatty acid composition quantification obtained from MRS has also shown good agreement with other MRI-based methods [40][41].
Several studies have demonstrated that MRS can evaluate the efficiency of therapeutic intervention [42]. MRS was previously used in a clinical trial of drugs for NAFLD and was able to evaluate the reduction in liver fat content in a dose-dependent manner [43][44]. In a double-blind study of NAFLD patients, MRS-assessed liver fat showed no alteration from symbiotic treatment while reducing fecal dysbiosis [45]. Additionally, MRS can also be used to assess the effect of dietary and lifestyle changes on liver fat content. A previous MRS study demonstrated that short-term exercise improved liver lipid saturation, insulin sensitivity, and oxidative stress in individuals with known NAFLD [37]. Additionally, MRS is regarded as an accurate noninvasive tool for liver fat quantification in NASH, the more severe form of NALD [46][47].
MRS has also been used to study liver-related diseases that have fat accumulation within hepatocytes, such as human immunodeficiency virus (HIV), hepatitis C virus (HCV), excessive alcohol consumption, and hepatotoxic effects from chemotherapeutic agents or antiretroviral therapy [7][48][49].
Due to the high accuracy and sensitivity of MRS, it has also been used in liver fat assessment for liver transplants. Hepatic steatosis not only influences the outcome of translation but also increases the complication risk of both participants and donors [50].
4.2. Cirrhosis
4.3. Evaluation of Focal Liver Fat Disposition
5. Possible Confounders and Limitation of Liver MRS
6. Conclusions
This entry is adapted from the peer-reviewed paper 10.3390/diagnostics11050842
References
- Di Martino, M.; Pacifico, L.; Bezzi, M.; Di Miscio, R.; Sacconi, B.; Chiesa, C.; Catalano, C. Comparison of magnetic resonance spectroscopy, proton density fat fraction and histological analysis in the quantification of liver steatosis in children and adolescents. World J. Gastroenterol. 2016, 22, 8812.
- Bohte, A.E.; van Werven, J.R.; Bipat, S.; Stoker, J. The diagnostic accuracy of US, CT, MRI and 1 H-MRS for the evaluation of hepatic steatosis compared with liver biopsy: A meta-analysis. Eur. Radiol. 2011, 21, 87–97.
- Kühn, J.P.; Hernando, D.; Mensel, B.; Krüger, P.C.; Ittermann, T.; Mayerle, J.; Hosten, N.; Reeder, S.B. Quantitative chemical shift-encoded MRI is an accurate method to quantify hepatic steatosis. J. Magn. Reson. Imaging 2014, 39, 1494–1501.
- Ozturk, A.; Grajo, J.R.; Gee, M.S.; Benjamin, A.; Zubajlo, R.E.; Thomenius, K.E.; Anthony, B.W.; Samir, A.E.; Dhyani, M. Quantitative Hepatic Fat Quantification in Non-alcoholic Fatty Liver Disease Using Ultrasound-Based Techniques: A Review of Literature and Their Diagnostic Performance. Ultrasound Med. Biol. 2018, 44, 2461–2475.
- Kleiner, D.E.; Brunt, E.M.; Van Natta, M.; Behling, C.; Contos, M.J.; Cummings, O.W.; Ferrell, L.D.; Liu, Y.C.; Torbenson, M.S.; Unalp-Arida, A. Design and validation of a histological scoring system for nonalcoholic fatty liver disease. Hepatology 2005, 41, 1313–1321.
- Chalasani, N.; Younossi, Z.; Lavine, J.E.; Charlton, M.; Cusi, K.; Rinella, M.; Harrison, S.A.; Brunt, E.M.; Sanyal, A.J. The diagnosis and management of nonalcoholic fatty liver disease: Practice guidance from the American Association for the Study of Liver Diseases. Hepatology 2018, 67, 328–357.
- Ma, X.; Holalkere, N.-S.; R, A.K.; Mino-Kenudson, M.; Hahn, P.F.; Sahani, D.V. Imaging-based Quantification of Hepatic Fat: Methods and Clinical Applications. RadioGraphics 2009, 29, 1253–1277.
- Pydyn, N.; Miękus, K.; Jura, J.; Kotlinowski, J. New therapeutic strategies in nonalcoholic fatty liver disease: A focus on promising drugs for nonalcoholic steatohepatitis. Pharmacol. Rep. 2020, 72, 1–12.
- Noureddin, M.; Loomba, R. Nonalcoholic fatty liver disease: Indications for liver biopsy and noninvasive biomarkers. Clin. Liver Dis. 2012, 1, 104.
- Mandal, P.K. Magnetic resonance spectroscopy (MRS) and its application in Alzheimer’s disease. Concepts Magn. Reson. Part. A. Educ. J. 2007, 30, 40–64.
- Fischbach, F.; Bruhn, H. Assessment of in vivo 1H magnetic resonance spectroscopy in the liver: A review. Liver Int. 2008, 28, 297–307.
- Qayyum, A. MR spectroscopy of the liver: Principles and clinical applications. Radiographics 2009, 29, 1653–1664.
- Cecil, K.M. Proton magnetic resonance spectroscopy: Technique for the neuroradiologist. Neuroimaging Clin. N. Am. 2013, 23, 381–392.
- Lee, D.H. Imaging evaluation of non-alcoholic fatty liver disease: Focused on quantification. Clin. Mol. Hepatol. 2017, 23, 290.
- Hamilton, G.; Yokoo, T.; Bydder, M.; Cruite, I.; Schroeder, M.E.; Sirlin, C.B.; Middleton, M.S. In vivo characterization of the liver fat ¹H MR spectrum. NMR Biomed. 2011, 24, 784–790.
- Xavier, A.; Arteaga de Castro, C.; Andia, M.E.; Luijten, P.R.; Klomp, D.W.; Fillmer, A.; Prompers, J.J. Metabolite cycled liver (1) H MRS on a 7 T parallel transmit system. NMR Biomed. 2020, 33, e4343.
- Pasanta, D.; Tungjai, M.; Chancharunee, S.; Sajomsang, W.; Kothan, S. Body mass index and its effects on liver fat content in overweight and obese young adults by proton magnetic resonance spectroscopy technique. World J. Hepatol. 2018, 10, 924.
- Goceri, E.; Shah, Z.K.; Layman, R.; Jiang, X.; Gurcan, M.N. Quantification of liver fat: A comprehensive review. Comput. Biol. Med. 2016, 71, 174.
- Reeder, S.B.; Cruite, I.; Hamilton, G.; Sirlin, C.B. Quantitative assessment of liver fat with magnetic resonance imaging and spectroscopy. J. Magn. Reson. Imaging 2011, 34, 729–749.
- Xu, L.; Gu, S.; Feng, Q.; Liang, C.; Xin, S.X. Quantitative study of liver magnetic resonance spectroscopy quality at 3T using body and phased array coils with physical analysis and clinical evaluation. PLoS ONE 2015, 10, e0122999.
- Vanhamme, L.; van den Boogaart, A.; Van Huffel, S. Improved method for accurate and efficient quantification of MRS data with use of prior knowledge. J. Magn. Reson. 1997, 129, 35–43.
- Maudsley, A.A.; Darkazanli, A.; Alger, J.; Hall, L.; Schuff, N.; Studholme, C.; Yu, Y.; Ebel, A.; Frew, A.; Goldgof, D. Comprehensive processing, display and analysis for in vivo MR spectroscopic imaging. NMR Biomed. 2006, 19, 492–503.
- Mierisová, Š.; Van Den Boogaart, A.; Tkáč, I.; Van Hecke, P.; Vanhamme, L.; Liptaj, T. New approach for quantitation of short echo time in vivo 1H MR spectra of brain using AMARES. NMR Biomed. Int. J. Devoted Dev. Appl. Magn. Reson. In Vivo 1998, 11, 32–39.
- Poullet, J.B.; Sima, D.M.; Simonetti, A.W.; De Neuter, B.; Vanhamme, L.; Lemmerling, P.; Van Huffel, S. An automated quantitation of short echo time MRS spectra in an open source software environment: AQSES. NMR Biomed. Int. J. Devoted Dev. Appl. Magn. Reson. In Vivo 2007, 20, 493–504.
- Lee, S.S.; Park, S.H. Radiologic evaluation of nonalcoholic fatty liver disease. World J. Gastroenterol 2014, 20, 7392–7402.
- Kramer, H.; Pickhardt, P.J.; Kliewer, M.A.; Hernando, D.; Chen, G.-H.; Zagzebski, J.A.; Reeder, S.B. Accuracy of Liver Fat Quantification with Advanced CT, MRI, and Ultrasound Techniques: Prospective Comparison With MR Spectroscopy. Am. J. Roentgenol. 2016, 208, 92–100.
- Yokoo, T.; Serai, S.D.; Pirasteh, A.; Bashir, M.R.; Hamilton, G.; Hernando, D.; Hu, H.H.; Hetterich, H.; Kühn, J.-P.; Kukuk, G.M.; et al. Linearity, Bias, and Precision of Hepatic Proton Density Fat Fraction Measurements by Using MR Imaging: A Meta-Analysis. Radiology 2018, 286, 486–498.
- Papamiltiadous, E.S.; Roberts, S.K.; Nicoll, A.J.; Ryan, M.C.; Itsiopoulos, C.; Salim, A.; Tierney, A.C. A randomised controlled trial of a Mediterranean Dietary Intervention for Adults with Non Alcoholic Fatty Liver Disease (MEDINA): Study protocol. BMC Gastroenterol. 2016, 16, 14.
- Sullivan, S.; Kirk, E.P.; Mittendorfer, B.; Patterson, B.W.; Klein, S. Randomized trial of exercise effect on intrahepatic triglyceride content and lipid kinetics in nonalcoholic fatty liver disease. Hepatology 2012, 55, 1738–1745.
- van Werven, J.R.; Marsman, H.A.; Nederveen, A.J.; Smits, N.J.; ten Kate, F.J.; van Gulik, T.M.; Stoker, J. Assessment of hepatic steatosis in patients undergoing liver resection: Comparison of US, CT, T1-weighted dual-echo MR imaging, and point-resolved 1H MR spectroscopy. Radiology 2010, 256, 159–168.
- Roldan-Valadez, E.; Favila, R.; Martínez-López, M.; Uribe, M.; Ríos, C.; Méndez-Sánchez, N. In vivo 3T spectroscopic quantification of liver fat content in nonalcoholic fatty liver disease: Correlation with biochemical method and morphometry. J. Hepatol. 2010, 53, 732–737.
- Urdzik, J.; Bjerner, T.; Wanders, A.; Weis, J.; Duraj, F.; Haglund, U.; Norén, A. The value of pre-operative magnetic resonance spectroscopy in the assessment of steatohepatitis in patients with colorectal liver metastasis. J. Hepatol. 2012, 56, 640–646.
- Szczepaniak, L.S.; Nurenberg, P.; Leonard, D.; Browning, J.D.; Reingold, J.S.; Grundy, S.; Hobbs, H.H.; Dobbins, R.L. Magnetic resonance spectroscopy to measure hepatic triglyceride content: Prevalence of hepatic steatosis in the general population. Am. J. Physiol. Endocrinol. Metab. 2005, 288, E462–E468.
- Thomas, E.L.; Hamilton, G.; Patel, N.; O’Dwyer, R.; Doré, C.J.; Goldin, R.D.; Bell, J.D.; Taylor-Robinson, S.D. Hepatic triglyceride content and its relation to body adiposity: A magnetic resonance imaging and proton magnetic resonance spectroscopy study. Gut 2005, 54, 122–127.
- Johnson, N.A.; Walton, D.W.; Sachinwalla, T.; Thompson, C.H.; Smith, K.; Ruell, P.A.; Stannard, S.R.; George, J. Noninvasive assessment of hepatic lipid composition: Advancing understanding and management of fatty liver disorders. Hepatology 2008, 47, 1513–1523.
- Erickson, M.L.; Haus, J.M.; Malin, S.K.; Flask, C.A.; McCullough, A.J.; Kirwan, J.P. Non-invasive assessment of hepatic lipid subspecies matched with non-alcoholic fatty liver disease phenotype. Nutr. Metab. Cardiovasc Dis. 2019, 29, 1197–1204.
- Haus, J.M.; Solomon, T.P.J.; Kelly, K.R.; Fealy, C.E.; Kullman, E.L.; Scelsi, A.R.; Lu, L.; Pagadala, M.R.; McCullough, A.J.; Flask, C.A.; et al. Improved Hepatic Lipid Composition Following Short-Term Exercise in Nonalcoholic Fatty Liver Disease. J. Clin. Endocrinol. Metab. 2013, 98, E1181–E1188.
- Alkhouri, N.; Dixon, L.J.; Feldstein, A.E. Lipotoxicity in nonalcoholic fatty liver disease: Not all lipids are created equal. Expert Rev. Gastroenterol. Hepatol. 2009, 3, 445–451.
- Peterson, P.; Trinh, L.; Månsson, S. Quantitative 1H MRI and MRS of fatty acid composition. Magn. Reson. Med. 2021, 85, 49–67.
- Martel, D.; Leporq, B.; Bruno, M.; Regatte, R.R.; Honig, S.; Chang, G. Chemical shift-encoded MRI for assessment of bone marrow adipose tissue fat composition: Pilot study in premenopausal versus postmenopausal women. Magn. Reson. Imaging 2018, 53, 148–155.
- Nemeth, A.; Segrestin, B.; Leporq, B.; Seyssel, K.; Faraz, K.; Sauvinet, V.; Disse, E.; Valette, P.J.; Laville, M.; Ratiney, H. 3D chemical shift-encoded MRI for volume and composition quantification of abdominal adipose tissue during an overfeeding protocol in healthy volunteers. J. Magn. Reson. Imaging 2019, 49, 1587–1599.
- Noureddin, M.; Lam, J.; Peterson, M.R.; Middleton, M.; Hamilton, G.; Le, T.A.; Bettencourt, R.; Changchien, C.; Brenner, D.A.; Sirlin, C.; et al. Utility of magnetic resonance imaging versus histology for quantifying changes in liver fat in nonalcoholic fatty liver disease trials. Hepatology 2013, 58, 1930–1940.
- Safadi, R.; Konikoff, F.M.; Mahamid, M.; Zelber-Sagi, S.; Halpern, M.; Gilat, T.; Oren, R. The fatty acid-bile acid conjugate Aramchol reduces liver fat content in patients with nonalcoholic fatty liver disease. Clin. Gastroenterol. Hepatol. 2014, 12, 2085–2091.e2081.
- Kim, W.; Kim, B.G.; Lee, J.S.; Lee, C.K.; Yeon, J.E.; Chang, M.S.; Kim, J.H.; Kim, H.; Yi, S.; Lee, J.; et al. Randomised clinical trial: The efficacy and safety of oltipraz, a liver X receptor alpha-inhibitory dithiolethione in patients with non-alcoholic fatty liver disease. Aliment. Pharm. 2017, 45, 1073–1083.
- Scorletti, E.; Afolabi, P.R.; Miles, E.A.; Smith, D.E.; Almehmadi, A.; Alshathry, A.; Childs, C.E.; Del Fabbro, S.; Bilson, J.; Moyses, H.E.; et al. Synbiotics Alter Fecal Microbiomes, But Not Liver Fat or Fibrosis, in a Randomized Trial of Patients With Nonalcoholic Fatty Liver Disease. Gastroenterology 2020, 158, 1597–1610.e1597.
- Weiskirchen, R.; Tacke, F. The Role of Radiologic Modalities in Diagnosing Nonalcoholic Steatohepatitis (NASH) and Fibrosis. Curr. Hepatol. Rep. 2018, 17, 324–335.
- Le, T.-A.; Chen, J.; Changchien, C.; Peterson, M.R.; Kono, Y.; Patton, H.; Cohen, B.L.; Brenner, D.; Sirlin, C.; Loomba, R.; et al. Effect of colesevelam on liver fat quantified by magnetic resonance in nonalcoholic steatohepatitis: A randomized controlled trial. Hepatology 2012, 56, 922–932.
- Taouli, B.; Ehman, R.L.; Reeder, S.B. Advanced MRI Methods for Assessment of Chronic Liver Disease. Am. J. Roentgenol. 2009, 193, 14–27.
- Krššák, M.; Hofer, H.; Wrba, F.; Meyerspeer, M.; Brehm, A.; Lohninger, A.; Steindl-Munda, P.; Moser, E.; Ferenci, P.; Roden, M. Non-invasive assessment of hepatic fat accumulation in chronic hepatitis C by 1H magnetic resonance spectroscopy. Eur. J. Radiol. 2010, 74, e60–e66.
- Cheng, Y.F.; Chen, C.L.; Lai, C.-Y.; Chen, T.Y.; Huang, T.L.; Lee, T.Y.; Lin, C.L.; Lord, R.; Chen, Y.; Eng, H.L. ASSESSMENT OF DONOR FATTY LIVERS FOR LIVER TRANSPLANTATION1. Transplantation 2001, 71, 1221–1225.
- Goodman, Z.D. Grading and staging systems for inflammation and fibrosis in chronic liver diseases. J. Hepatol. 2007, 47, 598–607.
- Flemming, J.A.; Yang, J.D.; Vittinghoff, E.; Kim, W.R.; Terrault, N.A. Risk prediction of hepatocellular carcinoma in patients with cirrhosis: The ADRESS-HCC risk model. Cancer 2014, 120, 3485–3493.
- Wang, D.; Li, Y. 1H Magnetic Resonance Spectroscopy Predicts Hepatocellular Carcinoma in a Subset of Patients with Liver Cirrhosis: A Randomized Trial. Medicine 2015, 94, e1066.
- Ruiz-Cabello, J.; Cohen, J.S. Phospholipid metabolites as indicators of cancer cell function. NMR Biomed. 1992, 5, 226–233.
- Tang, Z.-y.; Zhao, J.-n.; Zhong, W.-j.; Luo, Y.-d.; Wu, W.; Chen, W.-j.; Dai, Y.-b. The Value of Proton Magnetic Resonance Spectroscopy in High-Intensity Focused Ultrasound Treatment of Experimental Liver Cancer. Transl. Oncol. 2015, 8, 163–168.
- Bell, J.D.; Jane Cox, I.; Sargentoni, J.; Peden, C.J.; Menon, D.K.; Foster, C.S.; Watanapa, P.; Ales, R.A.; Urenjak, J. A 31P and 1H-NMR investigation in vitro of normal and abnormal human liver. Biochim. Et Biophys. Acta Mol. Basis Dis. 1993, 1225, 71–77.
- Dzik-Jurasz, A.; Murphy, P.; George, M.; Prock, T.; Collins, D.; Swift, I.; Leach, M.; Rowland, I. Human rectal adenocarcinoma: Demonstration of 1H-MR spectra in vivo at 1.5 T. Magn. Reson. Med. Off. J. Int. Soc. Magn. Reson. Med. 2002, 47, 809–811.
- Gajdošík, M.; Chmelík, M.; Halilbasic, E.; Pfleger, L.; Klepochová, R.; Trauner, M.; Trattnig, S.; Krššák, M. In Vivo 1H MR Spectroscopy of Biliary Components of Human Gallbladder at 7T. J. Magn. Reson. Imaging 2021, 53, 98–107.
- Sharma, P.; Martin, D.R.; Pineda, N.; Xu, Q.; Vos, M.; Anania, F.; Hu, X. Quantitative analysis of T2-correction in single-voxel magnetic resonance spectroscopy of hepatic lipid fraction. J. Magn. Reson. Imaging 2009, 29, 629–635.
- Lv, S.; Jiang, S.; Liu, S.; Dong, Q.; Xin, Y.; Xuan, S. Noninvasive Quantitative Detection Methods of Liver Fat Content in Nonalcoholic Fatty Liver Disease. J. Clin. Transl. Hepatol. 2018, 6, 217–221.