Your browser does not fully support modern features. Please upgrade for a smoother experience.
Please note this is an old version of this entry, which may differ significantly from the current revision.
Subjects:
Plant Sciences
Adenylate kinase (ADK) is widely distributed in organisms and plays an important role in cellular energy homeostasis. In plants, ADK has important functions in plant growth and development regulation as well as in adaptation to the environment. However, little information is available about the ADK genes in tomato (Solanum lycopersicum), an important economic crop.
- genome-wide
- tomato
- ADK gene family
- stress
1. Introduction
Adenosine monophosphate (AMP) is one of the four main mononucleotides that make up ribonucleic acid in cells, also known as adenylate. Formation of AMP is often accompanied by the release of energy in organisms [1]. Adenylate metabolism is an essential part of primary metabolism because the change of adenylate content is the main factor affecting cell metabolism [2]. AMP, adenosine diphosphate (ADP), and adenosine triphosphate (ATP) are three important adenylate forms in organisms. The ratio of AMP, ADP, and ATP determines the energy charge ratio and carbohydrate metabolism, which directly affect plant growth and development and the ability to resist stress [3,4].
Adenylate kinase (ADK, EC 2.7.4.3) is a ubiquitous and abundant enzyme found in virtually all living organisms [5]. It catalyzes a reversible transphosphorylation reaction (ATP + AMP ↔ 2ADP) and is considered as a crucial enzyme in maintaining energy metabolism and the pool sizes of various adenylates at equilibrium [6,7]. Usually, ADKs have three domains: a large central CORE domain, a nucleoside monophosphate binding domain, and an ATP-binding domain [8,9]. The activity of ADK enzyme has been demonstrated in many plants such as maize, rice, and potato, and the subcellular localization of ADK (cytosol, mitochondria, plastids, etc.) varies greatly in different plants [10,11,12,13]. Potato is a solanaceous plant abundant in starch. A previous study revealed that content of adenylic acid and production of starch were significantly improved after the suppression of StADK expression in potato plastids [12]. Arabidopsis thaliana, as a good model plant, was widely used for studying plant growth and development. Increased amino acid levels and enhanced root growth were confirmed in Arabidopsis after disruption in one ADK gene At2g37250 with transferred DNA (T-DNA) insertion mutants [13]. Subsequently, another relevant study revealed that disruption of Arabidopsis ADK gene At5g47840 leads to loss of chloroplast integrity, causing a bleached phenotype from early embryo to seedling development [14]. Researchers also found that ADK3 could interact with the chloroplast glyceraldehyde-3-phosphate dehydrogenase to form a stable complex in the chloroplasts of a green alga, which might be a potential mechanism to regulate the crucial ATP–NADPH ratio in the Calvin–Benson cycle [15].
Besides regulation of growth and development, ADK is also widely involved in abiotic stress responses in plants. When roots and stems of maize were treated with solutions of two different ratios of Ca2+/Na+, results showed that ADK content had an essential relationship with salt stress [16]. In tomato, microarray analysis of genes revealed that an ADK homolog (SGN-U214214) was repressed in salt-treated tissues [17]. Other microarray data revealed that the expression of ADK gene (SGN-U232826) was induced by drought stress in drought-tolerant tomato [18]. Taking pea seeds as a model, the balance of adenylate in dehydrating and imbibing seeds was investigated. The results indicated that ADK played a crucial role in building and later using the huge AMP pool, which appears as a signature of the dry state in seeds [19].
Tomato is one of the most important agricultural products worldwide, as well as an important model for studying fleshy fruit development and ripening [20]. Currently, the tomato ADK gene family members have not been identified, and their functions remain to be elucidated. Due to the importance of the ADK genes in regulating plant growth and stress resistance, it would be of interest to make a systematic investigation of the ADK family in tomato. In the present study, we used bioinformatics methods to identify ADK genes from the tomato genome and analyze the phylogenetic relationships, sequence features, gene location, chromosomal locations, evolutionary relationships, and cis-elements in promoters. The comprehensive transcriptomic profiling of the ADK family in various tissues and organs of tomato during different developmental stages were carried out using the online TomExpress platform. Also, the dynamic expression patterns of the ADK family in response to various plant hormones (methyl jasmonate (MeJA), ethylene (Eth), salicylic acid (SA), indole 3-acetic acid (IAA), and abscisic acid (ABA)) and abiotic stresses (drought, cold, and salt stress) were systematically studied in detail using quantitative real-time PCR (qRT-PCR). Furthermore, coexpression and correlation networks between SlADKs and other tomato functional genes were further investigated. Virus-induced gene silencing technology verified the function of SlADK10 under drought stress. In brief, the present results will provide useful information for further functional and regulation mechanism investigations of the ADK family in tomato.
2. Genome-Wide Identification and Expression Analysis of Tomato ADK Gene Family during Development and Stress
2.1. Identification of the ADK Family in Tomato
To identify the ADK family in tomato, unigenes were searched in the SOL Genomics Network, and a hidden Markov model search was used to scan probable proteins. After confirming the existence of the ADK core sequences according to the description in the tomato genome database and the Pfam and SMART programs, a total of 11 ADK genes were identified. Based on their chromosomal locations, the genes were assigned as SlADK1–11. Gene information of each ADK gene and physicochemical properties of matched proteins were predicted with the tomato gene database and the ExPASy online tool, respectively. The names and IDs of genes, chromosomal and strand locations, open reading frame lengths, exon numbers, amino acid numbers, molecular weights (MWs), and isoelectric points (pIs) are listed in Table 1. In detail, the lengths of the SlADK proteins ranged from 630 (SlADK1) to 1989 (SlADK11) amino acids, and the corresponding range for MWs was 22872.10–74110.62 Da. The 11 SlADK genes were distributed on nine tomato chromosomes, with SlADK3 and 4 located in forward strands and the others in reverse strands. The predicted pI values of SlADKs ranged from 5.76 (SlADK1) to 8.83 (SlADK4) (Table 1). For subcellular localization prediction based on four different online tools, most SlADK proteins were presumably located in mitochondria (e.g., SlADK2, 3, 4, and 6); SlADK1 and 5 may have been located in cytoplasm; and SlADK8 and 11 may have been located in chloroplast. Interestingly, SlADK9 may have been located in cytoplasm or the nucleus, and SlADK10 may have been located in chloroplast or mitochondria (Table 2). The coding sequence (CDS) and gene sequence of the SlADK family are provided in Table S1.
Table 1. Features of SlADK family genes identified in tomato.
| Name | Gene ID | Chr | Genomic Location | Strand | ORF | Exon | AA | MW (kDa) | PI |
|---|---|---|---|---|---|---|---|---|---|
| SlADK1 | Solyc01g088480.2.1 | 1 | 83267069–83271080 | – | 630 | 10 | 209 | 22872.10 | 5.76 |
| SlADK2 | Solyc02g093990.2.1 | 2 | 54662319–54663928 | – | 780 | 4 | 259 | 29003.16 | 6.45 |
| SlADK3 | Solyc03g005050.2.1 | 3 | 44287–46883 | + | 852 | 4 | 283 | 31654.06 | 6.46 |
| SlADK4 | Solyc03g083610.2.1 | 3 | 53563661–53567185 | + | 714 | 10 | 237 | 26768.76 | 8.83 |
| SlADK5 | Solyc03g111200.2.1 | 3 | 61838312–61842194 | – | 735 | 6 | 244 | 26669.91 | 8.57 |
| SlADK6 | Solyc04g049690.2.1 | 4 | 43054097–43062321 | – | 810 | 4 | 269 | 30011.55 | 6.90 |
| SlADK7 | Solyc05g014980.2.1 | 5 | 9188640–9193694 | – | 729 | 6 | 242 | 26541.56 | 7.01 |
| SlADK8 | Solyc06g065270.2.1 | 6 | 40705359–40709638 | – | 861 | 7 | 286 | 31970.68 | 6.96 |
| SlADK9 | Solyc08g077300.2.1 | 8 | 61201659–61206762 | – | 651 | 8 | 216 | 24411.10 | 7.63 |
| SlADK10 | Solyc09g007180.2.1 | 9 | 801969–804985 | – | 846 | 4 | 281 | 30520.98 | 6.36 |
| SlADK11 | Solyc12g010380.2.1 | 12 | 3429721–3438938 | – | 1989 | 19 | 662 | 74110.62 | 6.6 |
Chr: chromosome.
Table 2. Predicted subcellular location of SlADK family members.
| Predicted Subcellular Localization | |||||
|---|---|---|---|---|---|
| Locus Name | Name | Wolf PSort | Predotar | TargetP | CELLO |
| Solyc01g088480 | SlADK1 | cyto: 13 | none | other | cyto(2.70) |
| Solyc02g093990 | SlADK2 | mito: 6 | mitochondria | mitochondrial transfer peptide | mito(1.76)/cyto(1.28) |
| Solyc03g005050 | SlADK3 | mito: 8 | mitochondria | mitochondrial transfer peptide | cyto(1.49)/nucl(1.46)/mito(1.15) |
| Solyc03g083610 | SlADK4 | mito: 7.5 | mitochondria | mitochondrial transfer peptide | cyto(2.93) |
| Solyc03g111200 | SlADK5 | cyto: 8 | none | other | cyto(1.83)/mito(1.70) |
| Solyc04g049690 | SlADK6 | mito: 10 | mitochondria | mitochondrial transfer peptide | mito(1.81)/nucl(1.52) |
| Solyc05g014980 | SlADK7 | cyto: 6 | none | other | mito(1.83)/cyto(1.51) |
| Solyc06g065270 | SlADK8 | chlo: 14 | plastid | chloroplast transfer peptide | chlo(2.32) |
| Solyc08g077300 | SlADK9 | cyto: 9 | none | other | nucl(2.74) |
| Solyc09g007180 | SlADK10 | chlo: 11 | mitochondria | mitochondrial transfer peptide | chlo(3.70) |
| Solyc12g010380 | SlADK11 | chlo: 11 | plastid | chloroplast transfer peptide | chlo(3.42) |
For subcellular localization prediction, all the SlADK proteins were analyzed with software Wolf Psort, Predotar, Target P, and CELLO. Localization (cyto—cytoplasmic, nucl—nuclear, chlo—chloroplast, mito—mitochondrial) is followed by probability score in each prediction algorithm.
2.2. Phylogenetic Analysis and Multiple Sequence Alignment of SlADK Genes
The phylogenetic relationship of tomato SlADK proteins, together with seven Arabidopsis AtADKs, twelve potato StADKs, and seven rice OsADKs, were examined by multiple sequence alignment with full lengths of the amino acid sequences (Table S2). Then, a phylogenetic analysis was conducted by MEGA7 based on the aligned results, and the neighbor-joining method was used with bootstrap replications of 1000. The ADK family was divided into six groups (Figure 1A). SlADK6 and 10, together with two potato homologs (Sotub09g006620 and Sotub04g013920), two Arabidopsis homologs (AT2g39270 and AT2g37250), and one rice homolog (Os03t0130400), were phylogenetically distinct and formed the predicted group I of plant ADKs. Group II contained two isoforms of potato (Sotub02g037180 and Sotub03g005270), one of Arabidopsis (AT3g01820), two of rice (Os08t0118900 and Os07t0412400), and two of tomato (SlADK2 and 3). Group III contained three evolutionarily similar subbranches: SlADK1 and Sotub01g028550; SlADK4 and Sotub03g020180; and SlADK9 and Sotub08g022760. Group IV contained two isoforms of potato (Sotub06g024300 and Sotub11g015570), one of Arabidopsis (At5g47840), one of rice (Os08t0109300), and one of tomato (SlADK8). Group V contained four subbranches: At5g50370 and At5g63400; SlADK5 and Sotub03g023880; SlADK7 and Sotub05g016010; and Os12t0236400 and Os11t0312220. At last, SlADK11, together with Sotub12g00740, Os08t0288200, and AT5g35170, formed group VI. Multiple sequence alignment of SlADK proteins was performed using DNAMAN8 software (Figure 1B). Because the amino acid sequence of SlADK11 was much longer than other proteins, the last comparison part, which contained only ADK11 C-terminal amino acids, is not shown in Figure 1B.
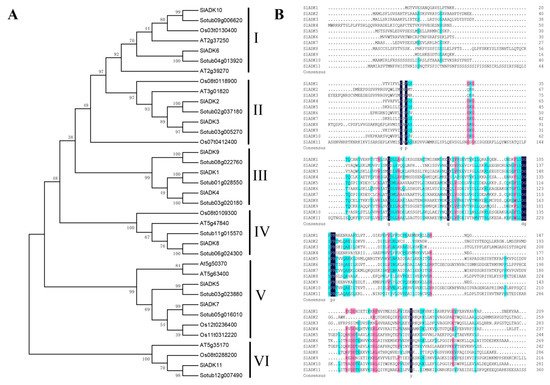
Figure 1. Phylogenetic analysis and multiple sequence alignment of adenylate kinase (ADK). (A) Phylogenetic analysis of tomato ADK family members, together with 7 Arabidopsis ADKs, 12 potato ADKs, and 7 rice ADKs. Full length of ADK proteins in these species were aligned using ClustalW and phylogenetic trees was carried out by the neighbor-joining method on MEGA7. Numbers on branches are bootstrap values calculated from 1000 replicates. Each branch is marked out with Roman numerals. (B) Multiple sequence alignment of SlADKs. SlADK proteins were aligned using DNAMAN8 software. Highlight homology level in 100%, ≥75% and ≥50% with the colors of blue, pink and green, respectively.
2.3. Motif Analysis
According to the amino acid sequences, the MEME web server was used to search the conserved motifs that were shared with the SlADK proteins. A total of 10 distinct conserved motifs were set up and found, and the number of motif residues ranged within 38–50 amino acids; details of the conserved motifs are shown in Figure 2A. Each SlADK protein contained five to eight conserved motifs. It is worth noting that motifs 1, 2, and 4 were fundamental in the ADK domains because they were shared by all SlADKs (Figure 2B). SlADK1 and 9, SlADK2 and 3, and SlADK5 and 7 shared common motif compositions, which was consistent with the grouping results (Figure 1A and Figure 3A left). In addition, motif 7 was unique to SlADK5 and 7 at the N-terminal, and motif 9 was unique to SlADK2 and 3 at the C-terminal. The specific motifs may contribute to the functional divergence of SlADK genes. In order to better annotate the function of genes, the sequence of each motif was performed blast in Pfam and SMART database; the prediction result showed that except for motifs 7 to 10, which were too short to predict, motif 1 to 6 all contained the ADK domain (Table S3).
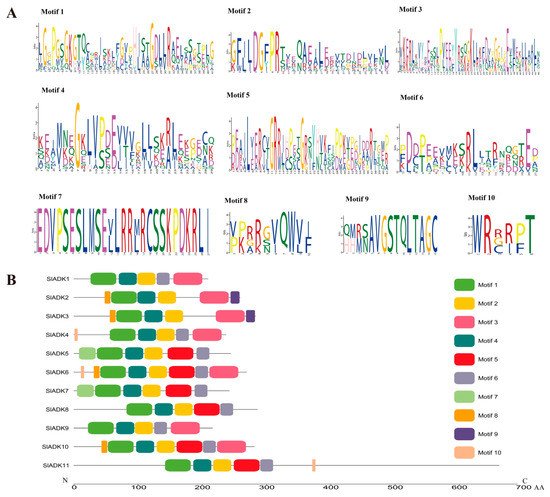
Figure 2. Details of ten conserved motifs and their distributions in SlADK proteins. (A) Details of ten selected motifs. Ten conserved motifs in SlADK proteins were generated by the online MEME tool. The overall height of the stack represents the level of sequence conservation. Heights of residues within a stack indicate the frequency of each residue at the indicated position. (B) The motif composition of tomato SlADK proteins. Ten putative motifs are indicated in different colored boxes. The length of each protein can be estimated using the scale at the bottom.
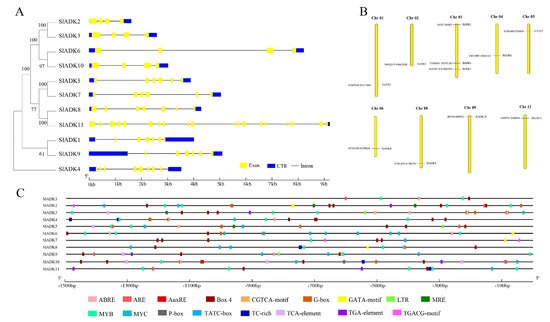
Figure 3. Phylogenetic relationships, gene structures, chromosomal locations, and predicted cis-elements of the SlADK gene family. (A) Phylogenetic tree (left) of 11 SlADK proteins. The unrooted neighbor-joining phylogenetic tree was constructed with MEGA7 using full-length amino acid sequences of 11 SlADK proteins, and the bootstrap test replicate was set as 1000 times. Exon/intron organization (right) of SlADK genes. Yellow boxes represent exons, and black lines with same length represent introns. The UTR region of SlADK genes are indicated in blue boxes. The length of exons can be inferred by the scale at the bottom. (B) Chromosomal location of SlADK genes. The number of chromosomes is indicated at the top of each chromosome. Also, the numbers at the left and right of each chromosome represent genomic locations and names of SlADK genes, respectively. (C) Predicted stress- and hormone-related cis-elements in SlADK promoters. Promoter sequences (−1500 bp) of 11 SlADK genes were analyzed by PlantCARE. The upstream length to the translation start site can be inferred according to the scale at the bottom.
2.4. Gene Structure and Chromosomal Location Analysis of SlADKs
Gene organization plays a vital role in the evolution of multiple gene families [21]. A neighbor-joining phylogenetic tree constructed with MEGA7 is shown in Figure 3A, which is consistent with the result in Figure 1A. Corresponding to each gene, the genomic sequence and cDNA sequence information were submitted to the Gene Structure Display Server ((http://gsds.gao-lab.org/) (accessed on 7 August 2019) together to show the gene structure. Among these genes, the average gene length was 1610–9218 bp. SlADK 11 had the maximum number of exons and the longest gene length, while SlADK2 had the shortest gene length. Each gene had 4–19 exons, and the majority of SlADKs harbored four exons (SlADK2, 3, 6, and 10) (Figure 3A right, Table 1). The results also revealed that genes close to each other in the phylogenetic tree had similar gene structure, such as SlADK2 and 3, SlADK6 and 10, SlADK5 and 7, and SlADK1 and 9. Tomato contains 12 chromosomes; the 11 SlADKs were distributed on 9 of them randomly (Figure 3B). The majority of SlADKs were located on the proximate or distal ends of the chromosomes. Chromosome 03 had the greatest number of predicted SlADKs, with three (SlADK3–5), and no SlADK existed on chromosomes 07, 10, or 11. Only one SlADK existed on each of the other eight chromosomes.
2.5. Cis-Regulatory Elements in SlADK Promoters
To pave the way for further study of potential gene function and regulatory mechanisms of the SlADK family, especially during abiotic stress responses and hormone treatment, the 1500 bp upstream sequences from the translation start sites of SlADKs were submitted to PlantCARE to detect cis-regulatory elements (CREs). After screening, CREs related to stress and hormones were retained; detailed information on these CREs can be found in Table S4. Also, the location and number of 17 representative CREs (ABRE, ARE, AuxRE, Box 4, CGTCA-motif, G-box, GATA-motif, LTR, MRE, MYB, MYC, P-box, TATC-box, TC-rich, TCA-element, TGA-element, TGACG-motif) were visualized on each gene with GSDS software (Figure 3C). The upstream regulatory sequence of promoters contained multiple elements that respond to hormones (such as Box 4 and G-box, TGACG-motif) and stress signals (such as TC-rich, LTR, MYB- and MYC-binding sites), which indicated that expressions of SlADKs were associated with abiotic stresses and hormone signal transduction response. It is worth noting that from the promoter region of −1500 bp to −700 bp, cis-regulatory elements of SlADK11 and 1 seemed to be less distributed and almost nonexistent, respectively (Figure 3C and Table S4).
2.6. Synteny Analysis of SlADK Genes
Synteny analysis of SlADK genes was conducted to investigate the duplication events occurring in the tomato ADK family (Figure 4A). Three duplication events were observed between chr01 and chr08 (SlADK1 and SlADK9), chr02 and chr03 (SlADK2 and SlADK3), and chr04 and chr09 (SlADK6 and SlADK10), which evolved from segment duplication. Interestingly, each gene pair with duplication events belonged to the same subfamily in the phylogenetic tree (Figure 3A). To further infer the phylogenetic mechanisms of tomato ADK gene family, we constructed two comparative syntenic maps of tomato associated with two representative species, rice and potato (Figure 4B). The homology between tomato and potato is closer because they both belong to Solanaceae while rice belongs to Gramineae. Under default parameters (minspan of mcsanx = 30), our results revealed that ten SlADK genes showed syntenic relationship with potato genes (SlADK1 and Sotub01g028550, SlADK2 and Sotub02g037180, SlADK3 and Sotub03g005270, SlADK5 and Sotub03g023880, SlADK6 and Sotub04g013920, SlADK7 and Sotub05g016010, SlADK8 and Sotub06g024300, SlADK9 and Sotub08g022760, SlADK10 and Sotub09g006620, SlADK11 and Sotub12g007490); when the parameter minspan of mcsanx was changed from 30 to 12, previously filtered gene pairs of SlADK4 and Sotub03g020180 also showed syntenic relationships (Figure 4B). However, no collinear relationship existed for ADK genes between rice and tomato (Figure 4B).
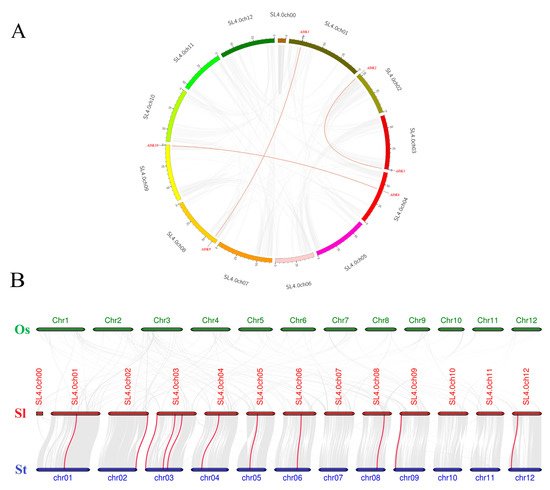
Figure 4. Collinearity analysis of ADK gene family. (A) Synteny analysis of the ADK family in tomato. The gray lines represent the collinearity result of the tomato genome, and red lines linking SlADK genes represent the duplication events occurring in the tomato ADK gene family. Chromosomes are drawn in different colors, and the approximate location of SlADK genes is shown by short black lines on the circle. (B) Synteny analysis of ADK genes between tomato and other two representative plant species. The gray lines in the background represent the collinear blocks within tomato and other plant genomes (potato, rice), while the red lines highlight the syntenic ADK gene pairs. Here the abbreviations “Os”, “Sl”, and “St” indicate Oryza sativa, Solanum lycopersicum, and Solanum tuberosum, respectively.
2.7. Expression Pattern Analysis of SlADKs
Comprehensive transcriptomic profiling of 11 SlADKs in tomato vegetative and reproductive tissues was carried out using the online TomExpress platform and associated data mining tools (http://gbf.toulouse.inra.fr/tomexpress (accessed on 12 August 2019)) (Figure 5A and Figure S1). Gene SlADK1 was seldom expressed in all tomato tissues. Genes SlADK5 and 10 showed higher expression in seed and root than other genes. The expression of SlADK10 was enhanced at the flowering and fruit stages and reached the highest level at the stages of bud at 3 mm and mature green fruit (35 DPA). The expression of SlADK5 was enhanced at the onset of fruit development and reached maximum at mature green fruit (35 DPA); however, during ripening, its expression decreased before increasing again during the red fruit stage. Some genes such as SlADK2 and 6 exhibited relatively moderate expression in all tissues. Of particular interest, SlADK3, 8, and 9 were the most highly expressed during late fruit ripening, displaying a net upregulation at the onset of ripening starting after the mature green stage. This pattern of expression suggests a potential role of these genes in regulating the ripening process.
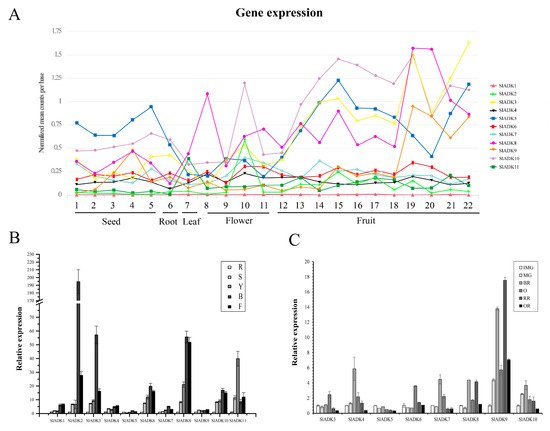
Figure 5. Expression patterns of the SlADK genes in different tissues. (A) Expression patterns of the SlADK genes in various tissues obtained from the TomExpress platform. 1, whole seed of immature green fruit (10 day post anthesis, DPA); 2, whole seed of mature green fruit (35 DPA); 3, whole seed of breaker fruit (38 DPA); 4, whole seed of orange fruit (41 DPA); 5, whole seed of red fruit (44 DPA); 6, whole root; 7, whole leaf; 8, petal of flower; 9, whole flower in the stage of bud; 10, whole flower in the stage of bud at 3 mm; 11, whole flower in the stage of anthesis; 12, whole fruit in the stage of 4 DPA; 13 and 14, flesh and peel of immature green fruit (10 DPA), respectively; 15 and 16, flesh and peel of mature green fruit (35 DPA), respectively; 17 and 18, flesh and peel of breaker fruit (38 DPA), respectively; 19 and 20, flesh and peel of orange fruit (41 DPA), respectively; 21 and 22, flesh and peel of red fruit (44 DPA), respectively. (B) Expression of SlADK genes with real-time PCR detection in various tissues including roots (R), stems (S), fully expanded leaves (L), bud (B), and flowers (F). (C) Expression of SlADK genes with real-time PCR detection at different stages during fruit development and ripening: immature green (IMG), mature green (MG), breaker (Br), orange (O), red ripe (R), and over-ripe (OR). Quantitative PCR data represent mean values for three independent biological replicates (n = 3).
To assess the potential roles of SlADKs throughout tomato development, we conducted detailed quantitative real-time PCR (qRT-PCR) to examine transcription in different tissues (Figure 5B,C). In nonfruit tissues, including root, stem, leaf, bud, and flower, SlADK1 and 4 showed similar expression patterns. Notably, the expression levels of most SlADKs was drastically enhanced in bud compared to other tissues, and expression of SlADK2 was much higher in bud. Genes SlADK2, 3, 6, 7, 8, and 10 also showed similar expression patterns, possibly indicating they have similar gene function. Interestingly, the expression of SlADK11 was higher in leaves than other tissues. Additionally, expression of SlADK5 and 9 showed little difference among tissues (Figure 5B). During the critical stages of fruit development, including the immature green stage (IMG), mature green stage (MG), breaker stage (BR), orange stage (O), red ripe stage (RR) and overripe stage (OR), the expression levels of SlADK4, 7, and 10 were relatively high at BR stage and those of SlADK3 and 6 were relatively high at O stage. It was remarkable that the mRNA level of SlADK9 was significantly upregulated at RR stage, and interestingly, expression of almost all detected genes was relatively low in OR stage. Additionally, low expression of SlADK1, 2, and 11 genes was observed in fruit impeded analysis of gene expression by qPCR (Figure 5C).
2.8. Expression Characteristics of SlADKs under Diverse Abiotic Stresses
To identify potential functions of SlADKs in response to different abiotic stresses, their transcript profiles were assayed under drought, salt, and cold treatments (Figure 6). Following 3 h of treatment with PEG6000, the expression of most SlADKs was obviously upregulated except for SlADK1, 3, and 8. Interestingly, expression of most SlADKs decreased rapidly during 9–12 h after treatment but increased rapidly during 24–48 h. In particular, the transcript levels of SlADK1 and 11 almost linearly increased with time under PEG6000 treatment during 12–72 h (Figure 6A). Under salt treatment, expression levels of most SlADKs were obviously downregulated at the early stage. It should be noted that the expression of almost all SlADKs at 9 and 48 h were higher than that at other time points, whereas only SlADK7 showed the highest expression at 6 and 24 h (Figure 6B). Under cold stress, there was obvious up- and downregulation in expression levels of SlADK3 during 12–24 h and 24–48 h, respectively. For SlADK7, expression showed no significant differences for all time points before 24 h of treatment, but expression rose rapidly during 24–72 h (Figure 6C). Notably, SlADK7 exhibited unique changes under multiple stress treatments, suggesting that it may have a unique role in stress responsiveness. Moreover, the result of gene clustering showed that homologous genes, such as SlADK2 and 3 or SlADK5 and 7, always had similar expression patterns, especially under PEG6000 treatment (Figure 3A left and Figure 6A).
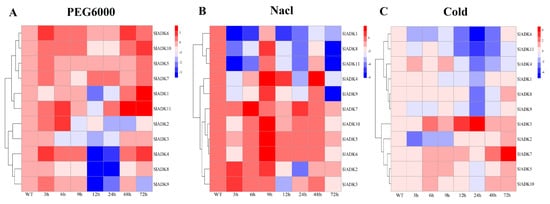
Figure 6. qRT-PCR expression analysis for 11 SlADKs in tomato leaves under diverse abiotic stresses: (A) PEG6000; (B) NaCl; (C) cold. The treated tomato leaves were harvested at the indicated time points. The color scale represents the log2 mean value of relative expression levels from three independent biological replicas (n = 3). Used primers specific for SlADKs are listed in Supplementary Materials Table S5.
2.9. Expression Profiles of SlADKs in Response to Diverse Hormone Treatments
Previous evidence indicated that different hormones play important roles in stress signal transduction and cell responses [22,23,24]. Here, we investigated the expression profiles of SlADKs in response to Eth, IAA, ABA, SA, and MeJA treatments (Figure 7). With Eth treatment, in general, the expression of most SlADKs showed little difference, but that of SlADK1, 2, and 7 increased gradually to different levels during 0–2 h (Figure 7A). With IAA treatment, the expression maxima of SlADK1, 2, and 4 were at 2, 0.5, and 6 h, respectively. Interestingly, SlADK11 showed decreased transcription at the early stage and almost no expression at later time points (Figure 7B). At 0.5 h after ABA treatment, expression of SlADK5, 7, and 10 showed no significant differences; however, expression of SlADK3, 4, 6, 8, 9, and 11 decreased, and that of SlADK1 and 2 increased at the first time point. Moreover, most SlADKs did not change significantly after 1–12 h of treatment. SlADK6 showed decreased transcription at the early stage and almost none at following time points (Figure 7C). With SA treatment, transcription of most SlADKs was repressed in the first 0.5 h. Expression of most SlADKs showed mild change under SA treatment, except for SlADK2, 6, and 7. SlADK2 and 7 showed especially similar expression patterns throughout all time points, with maximum expression at 12 h (Figure 7D). The plant regulator MeJA mediates diverse developmental processes and defense responses. It rapidly induced upregulation of SlADK4 and 2 during 1–6 h and 3–12 h time points, respectively. Expression of SlADK6 increased gradually during 1–6 h, with opposite results for expression of SlADK9 during 0–3 h. As in IAA treatment, SlADK11 showed decreased transcription at the early stage and almost no expression for later time points (Figure 7E). Hence, transcription of SlADKs was responsive to most of the applied stress treatments. Interestingly, SlADK2 and 4 exhibited significant changes under multiple hormone treatments, suggesting that they may have unique roles in hormone regulation. Notably, the result of gene clustering showed that the homologous genes of SlADK6 and 10 had similar expression patterns under treatment with Eth and IAA (Figure 3A left and Figure 7A,B), and SlADK8 and 11 had similar expression patterns under treatment with Eth and ABA (Figure 3A left and Figure 7A,C).
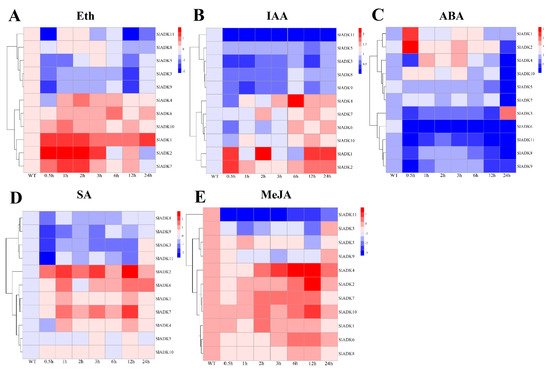
Figure 7. Expression profiles of SlADKs under various hormone treatments by qRT-PCR. The treated tomato leaves were harvested at the indicated time points. To ensure that expression of the same gene in different treatments, as well as expression of different genes in the same treatment, can both be clearly displayed and compared, for treatment with Eth (A), SA (D), and MeJA (E), the color scale represents log2 mean value of relative expression levels from three independent biological replicas (n = 3); for treatment with IAA (B) and ABA (C), the color scale represents mean value of relative expression levels from three independent biological replicas (n = 3). Primers specific for SlADKs are listed in Supplementary Materials Table S5.
2.10. SlADK Expression Patterns under Stress Based on RNA-Seq Data
As introduced above, TomExpress provides a unified and standard method to judge tomato gene expression from released RNA-Seq data sets. Here, SlADKs expression patterns under treatment with different plant hormone and multiple hormones were analyzed (Figure 8 and Figure S2). In general, the expression of most SlADKs (SlADK3, 5, 6, 7, and 10) were lower in leaves (C10 to C17) than in roots (C1–C2, C4–C5, C7–C8) whether these tissues were treated with cytokinin or not. Also, the expression of SlADK1 was lower in many tissues, and even could not be detected in roots (C2, C4, C5, C7) and leaves (C10, C13, C16) under special stress conditions. With the treatment of auxin in tip of roots, the expression of SlADK7 and 10 were downregulated significantly. In fruit, several SlADK genes such as SlADK3, 5, 8, and 10 displayed higher expression levels. Compared with treatment of ACC in fruit, multiple-hormone treatment of ACC + IAA could upregulate the expression of SlADK3 and 5 (Figure S2). Heatmap can be very convenient to show gene clustering. As shown in Figure 8, under treatment with different plant hormone and multiple hormones, SlADK3, 4, 5, 7, and 10 showed similar expression patterns in many tissues, as did the groups of SlADK2, 6, and 11 and of SlADK1, 8, and 9 (Figure 8).
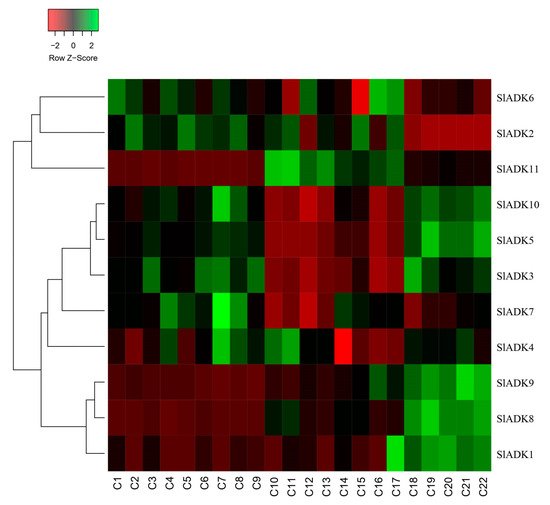
Figure 8. Expression patterns of SlADK genes under stress based on RNA-seq data. Heatmap of the expression pattern of tomato SlADK family genes in root, leaves and fruit with different and multiple hormones treatment. The distance used for the clustering is based on the classical Euclidean distance which allows clustering gene expression by expression levels. For a given row of the heatmap, green and red colors present high and low values of expression of the considered gene, respectively. Details of C1 to C22 are provided in Figure S2.
This entry is adapted from the peer-reviewed paper 10.3390/ijms22147708
This entry is offline, you can click here to edit this entry!