Your browser does not fully support modern features. Please upgrade for a smoother experience.
Please note this is an old version of this entry, which may differ significantly from the current revision.
Subjects:
Engineering, Chemical
Fluidized gasification reactors can be used to produce hydrogen. They are operated in three modes including bubbling, circulating, and dual beds, as depicted inC. In a bubbling fluidized bed (BFB), the fuel is introduced from the bottom or side of the bed. The bed starts bubbling when the velocity of gasification agent is beyond the minimum fluidization velocity.
- hydrogen
- fluidized bed reactor
- supervised machine learning
- review
1. Introduction
The United Nations (UN) has promoted climate neutrality to produce no net greenhouse gas (GHG) emissions for years, as GHG emission has been considered one of the major causes of global warming [1]. GHG emissions in the atmosphere from fossil fuels, generated either by power plants or automobiles, have also risen and become a tremendous threat to environmental sustainability [2][3]. In recent years, a series of efforts shas been made, including using renewable resources or clean energy such as hydrogen fuels to mitigate the situation, reducing carbon dioxide emissions and in realizing sustainable development [4][5][6][7]. However, the conventional generation techniques of hydrogen are adopted from fossil fuels, including steam methane reforming (SMR) and derivations from natural gas, also known as “gray hydrogen” [8]. On a related note, hydrogen production using renewable resources is called “blue hydrogen” or biohydrogen (such as by the means of electrolysis, nuclear, solar photovoltaic-PV, wind, hydro or geothermal technologies), which is regarded as more environmentally friendly [3][5][6][9][10][11][12][13]. The current hydrogen generation technologies from different feedstocks are summarized in Figure 1. Apparently, the balance of feedstock between deploying fossil fuel and renewable resources for hydrogen generation has become lopsided, and this trend will become more prominent in the foreseeable future.
While a large number of techniques are available for hydrogen generation, the employment of those techniques faces great challenges when it comes to considering the more complex factors (e.g., cost-effectiveness, reliability and efficiency). For example, electrolysis is considered to be not cost-effective, and bioprocessing through dark fermentation using biomass as the feedstock is not efficient due to its intrinsic, slow biological processing feature [14]. Recently, biomass gasification by fluidized bed reactors (FBRs) has been found to significantly enhance the efficiency of hydrogen production, but its obvious drawbacks, such as complex reaction mechanisms and catalyst usage, somehow limit its application [15][16]. For fluidized bed operation, many operational parameters (such as the carbon content, residence time, lower heating values and particle size) play vital roles in determining the expected outcomes (e.g., conversions and yield) [17], and there are very few examples in the literature that try to systematically correlate these critical operational parameters with the corresponding performances. Therefore, this initiates our interest in using our developed artificial neural networks, coupled with a response surface methodology (ANNs-RSM) algorithm, to assess the statistical significance of the investigated operational parameters upon the performances of FBRs during hydrogen generation.
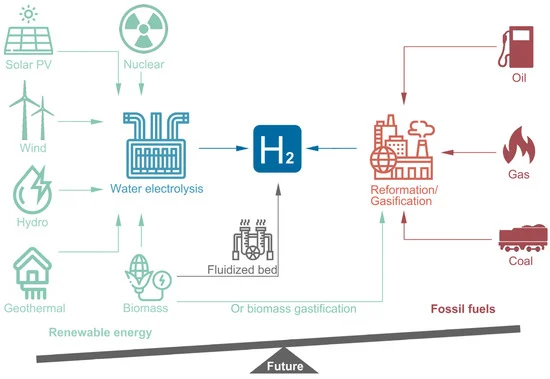 Figure 1. Hydrogen production from different resources via different technical routes. Left: blue hydrogen. Right: gray hydrogen.
2. Statistical Analysis of Parameter upon Output
In this review, among the different operational parameters, we choose seven parameters (temperature, residence time, equivalent ratio, steam-to-biomass ratio, carbon content, lower heating value and particle size) due to availability in reported literatures. Taking the feedstock sources for an example, different sources of feedstock may own various calorific values, carbon content, or moisture content that can significantly affect the conversion rate to hydrogen. The results are summarized in Table 1 and Table 2 (Table 1 for different types of FBGs and Table 2 for general FBGs that the types were not specified in the literatures). Using the collected references as training data set via ANNs-RSM algorithm, the predictions were made against the actual reported values from references. The results are shown in Figure 2. Apart from some values possessing relative higher uncertainties over ±20%, the majority of calculated data fall into the reasonable range, indicating that our constructed network can generate reliable predictions.
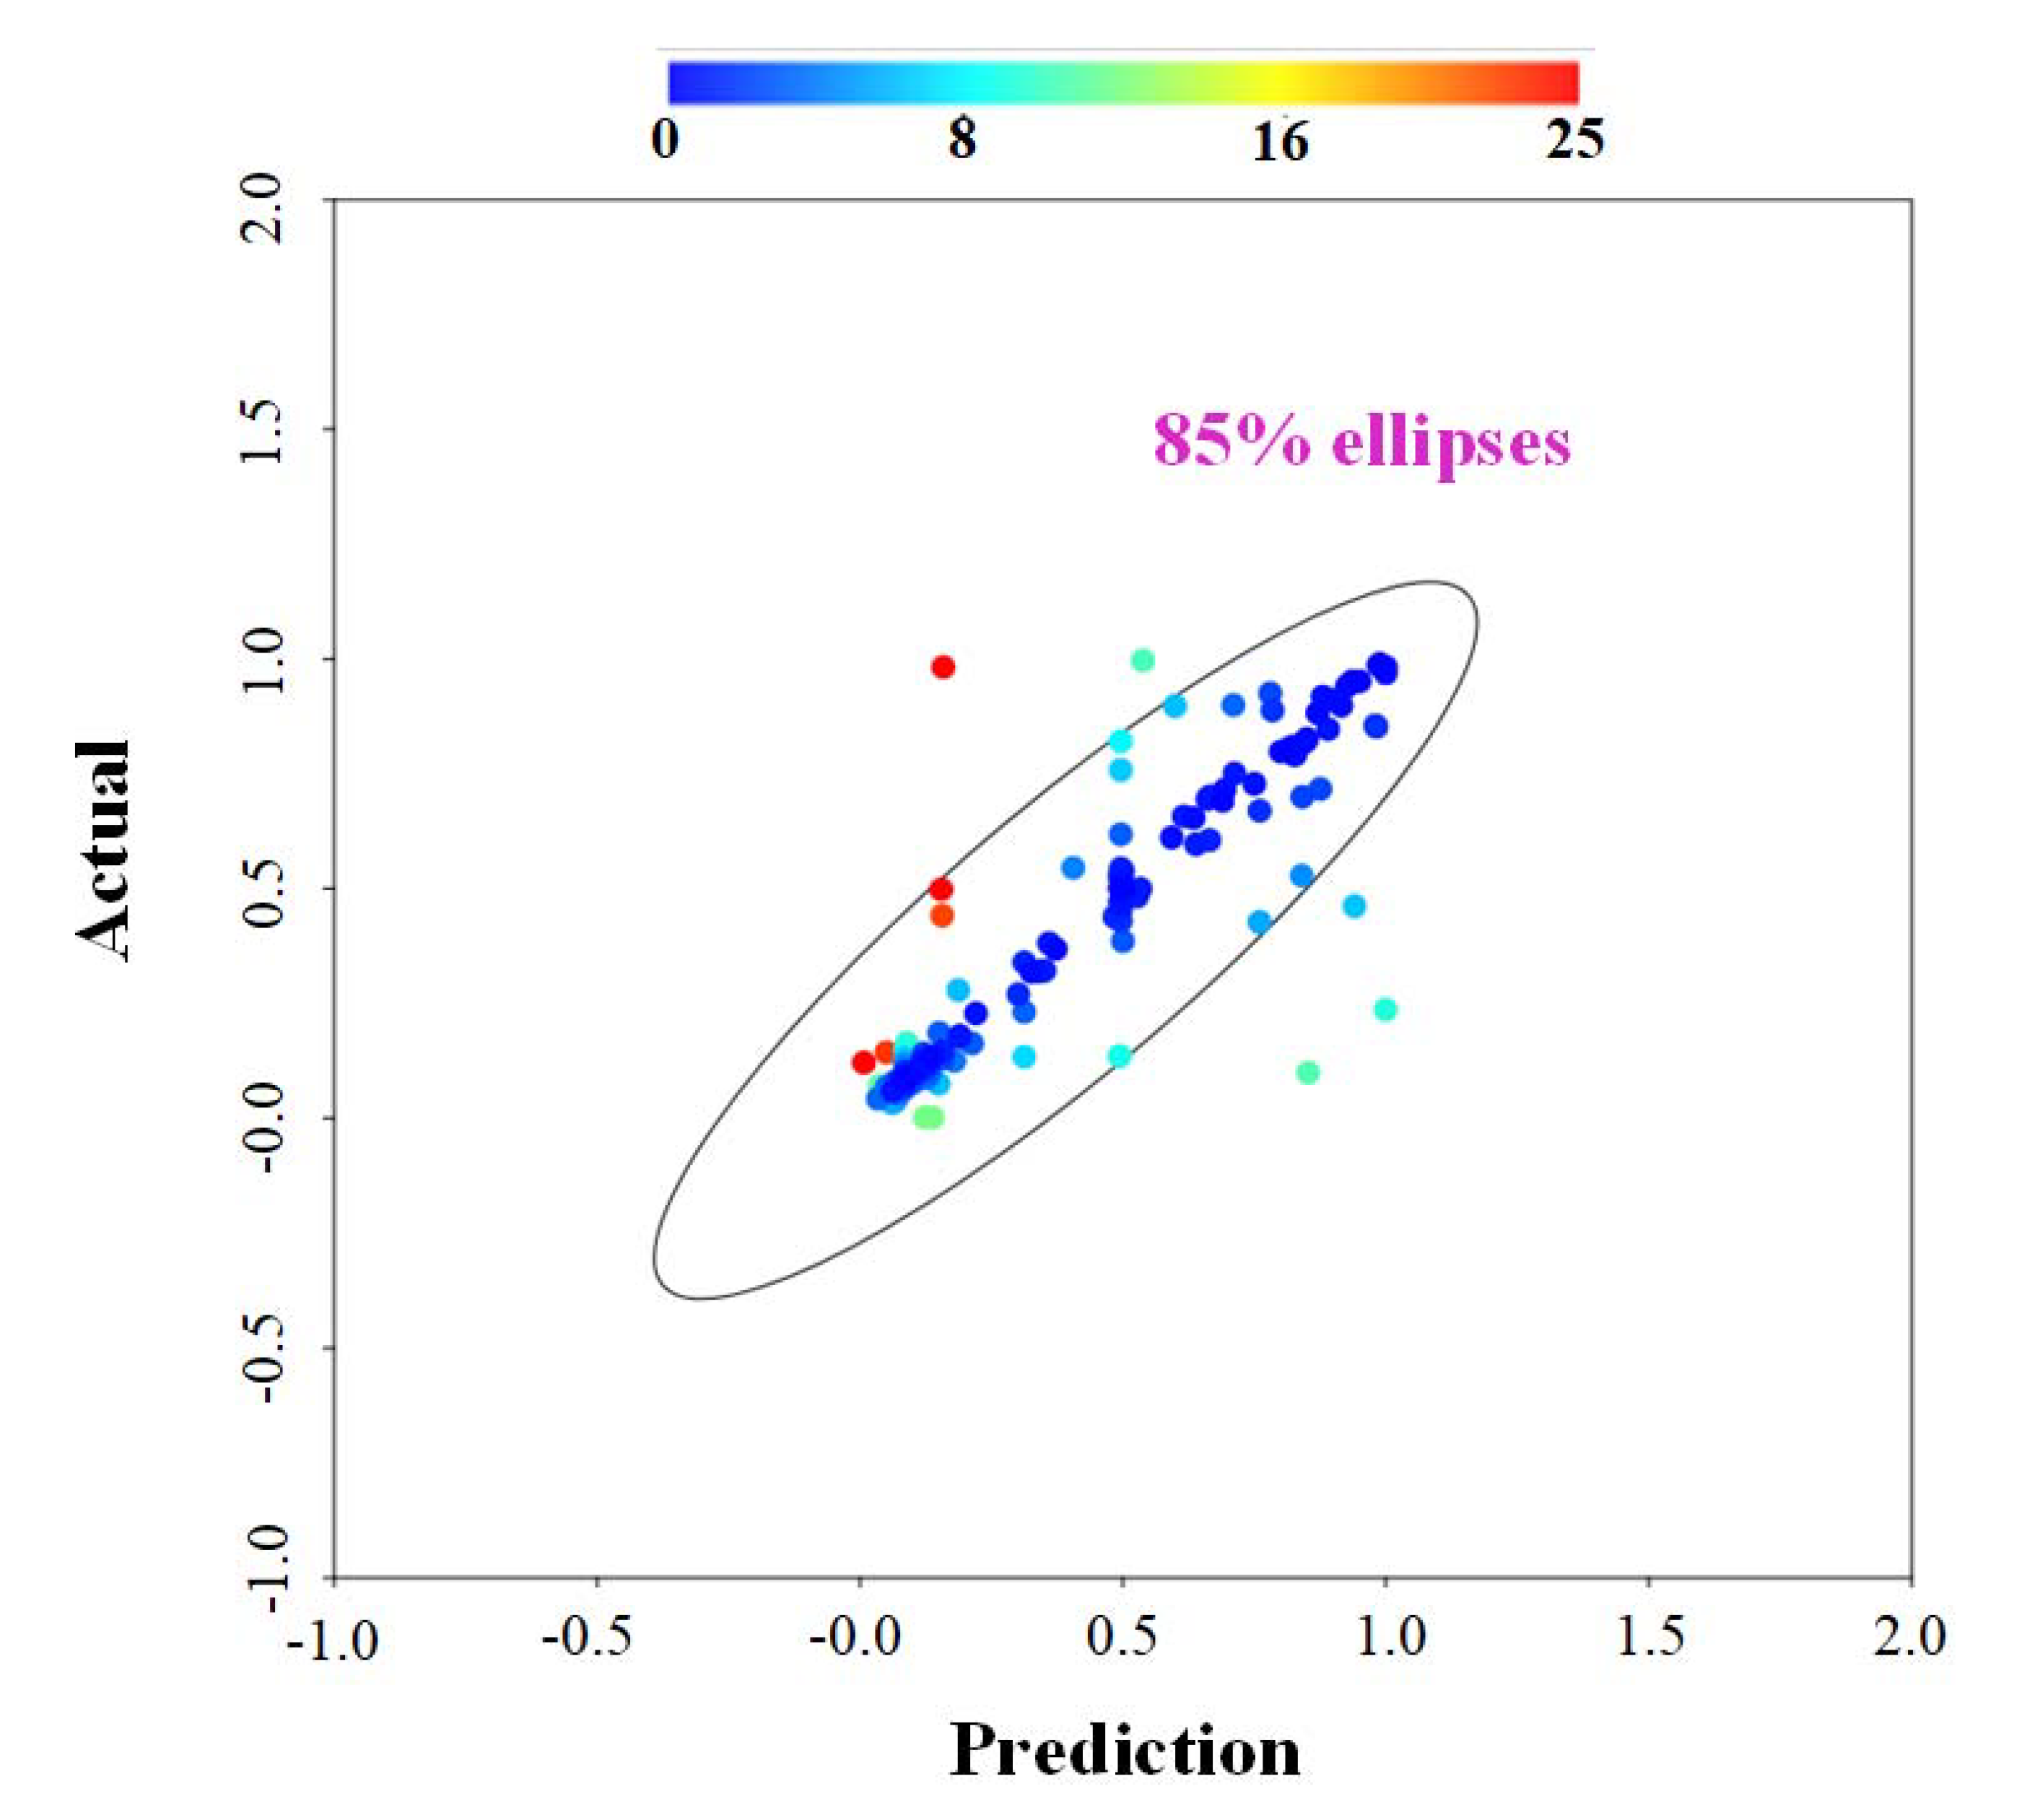 Figure 2. Analysis result—actual versus prediction from ANNs modeling, where color bar represents the uncertainties.
Table 1. Operational parameters versus corresponding hydrogen generation, where - represents the value that is not available from the literature (in this work, for easiness of data handling, the voids were replaced by the average reported value).
| Bed Type | Feedstock | Feedstock Particle Size (µm) | Carbon Content (wt.%) | LHV (MJ/Nm3) | T/°C | Process Time/min | ER | SBR | Yield (Nm3/kg) | Yield H2 Content/vol% | (CCE) % | Reference |
|---|---|---|---|---|---|---|---|---|---|---|---|---|
| Bubbling | Torrefied and raw pine | 468 | 13.80 | - | 800 | 45 | 0.28 | - | 80.56 | 15.13 | - | [18] |
| Wood sawdust | 1500 | - | - | 850 | 300 | - | - | 1.15 | 42.00 | 85.00 | [19] | |
| Rice husk | 7500 | 11.69 | 3.84 | 600 | - | 0.20 | - | 0.50 | 2.70 | 95.00 | [20] | |
| Wood-PET pellets | 6000 | 12.16 | 19.19 | 800 | 90 | 0.28 | - | - | 8.10 | 98.60 | [21] | |
| Rice husk | - | 36.00 | 9.30 | 800 | 60 | 0.30 | - | - | 12.50 | - | [22] | |
| MSW | - | 8.46 | 14.40 | 900 | - | 0.25 | 1.00 | - | - | - | [23] | |
| Cocoa shells | 461 | 21.70 | - | 900 | 60 | 0.23 | 1.20 | 1.49 | 49.10 | 50.00 | [24] | |
| Rice husk and coal | 1575 | 22.37 | - | 850 | 210 | 0.26 | 1.21 | - | 8.64 | 89.00 | [25] | |
| Pine sawdust | - | 12.60 | - | 600 | 120 | - | 0.20 | 1.03 | 38.60 | 71.20 | [26] | |
| - | - | - | 14.30 | 800 | 42 | 0.30 | - | - | 4.00 | 76.00 | [27] | |
| Pine sawdust and brown coal | 4000 | 13.20 | - | 900 | - | 0.20 | 0.50 | - | 50.60 | 84.20 | [28] | |
| Torrefied woodchips | 240 | 22.82 | 19.26 | 850 | 30 | 0.22 | 1.20 | 1.12 | 28.66 | 89.20 | [29] | |
| Carbonaceous feedstock | 15,000 | 11.50 | 20.53 | 785 | 30 | 0.21 | - | 2.10 | 7.10 | 84.10 | [30] | |
| Rice husk | - | 14.99 | - | 850 | - | 0.30 | 0.80 | - | 11.00 | 76.00 | [31] | |
| Cypress wood chips | - | 20.64 | 15.80 | 700 | - | 0.30 | 1.20 | - | 0.59 | - | [32] | |
| Torrefied woodchips | - | 20.18 | 3.00 | 800 | 30 | 0.24 | - | 1.77 | 14.31 | 78.00 | [33] | |
| Poultry litter | 525 | 22.82 | 19.26 | 850 | 90 | - | 1.40 | 1.41 | 43.00 | 87.52 | [34] | |
| - | 310 | 8.81 | 5.36 | 700 | 30 | 0.30 | 0.24 | 1.36 | 17.58 | 88.00 | [35] | |
| Spruce slice | 615 | - | 20.05 | 809 | 60 | 0.20 | - | - | 9.69 | 50.00 | [36] | |
| Miscanthus | 300 | 14.99 | 4.25 | 850 | - | 0.35 | 0.50 | - | 12.30 | - | [37] | |
| Torrefied and raw pine | 630 | - | 5.55 | 915 | 60 | 0.32 | - | - | 10.80 | 91.00 | [38] | |
| Circulating | Torrefied wood residues and mixed wood | 5000 | 24.65 | 11.70 | 850 | 180 | 0.22 | 1.26 | 1.60 | 53.00 | 82.40 | [39] |
| Wood residue and Tabas coal | 175 | 18.20 | - | 850 | 55 | 0.40 | - | - | 52.70 | - | [40] | |
| Methane and biomass | - | - | - | 1000 | - | 0.21 | 1.00 | - | 28.00 | - | [41] | |
| Sub-bituminous coal and sawdust | 3675 | 35.93 | 22.39 | 800 | - | 0.29 | - | 2.11 | 12.63 | 84.00 | [42] | |
| - | 1890 | - | 3.96 | 800 | - | 0.41 | 0.60 | - | 4.00 | - | [43] | |
| Dual | PP plastic pellets, wood chips and plant capsules | 660 | 8.01 | 26.00 | 900 | 10.67 | 0.30 | - | 2.53 | 29.70 | 82.00 | [44] |
| Rice straw | 1250 | 18.74 | - | 800 | 120 | 0.24 | - | 1.20 | 5.38 | 84.77 | [45] | |
| PE plastic bags, sawdust and PP plastic particles | 780 | 5.00 | - | 900 | - | 0.30 | 0.50 | - | 53.10 | - | [46] | |
| PE plastic bags, sawdust and PP plastic particles | 780 | 5.00 | - | 700 | 35 | 0.30 | 0.60 | - | 39.38 | - | [47] | |
| Volatile, fixed carbon and ash | - | 17.16 | 9.90 | 800 | - | 0.19 | 1.56 | 1.72 | 32.34 | 91.50 | [48] | |
| Pine sawdust | 200 | 12.73 | 11.40 | 850 | 120 | - | 0.30 | 10.51 | 47.30 | 64.00 | [49] | |
| Biomass briquette | - | 18.71 | 11.00 | 670 | 300 | 0.19 | - | 1.20 | 24.00 | 98.82 | [50] | |
| PE plastic bags, wood chips and PP particles | 660 | - | - | 900 | 35 | 0.30 | 0.60 | - | 50.96 | 92.59 | [51] |
Table 2. Operational parameters of general fluidized bed (types not specified in literatures) versus corresponding hydrogen generation, where - represents the value that is not available from the literature (in this work, for easiness of data handling, the voids were replaced by the average reported value).
| Catalyst | Feedstock | Feedstock Particle Size (µm) | Carbon Content (wt.%) | LHV (MJ/Nm3) | T/°C | Process Time/min | ER | SBR | Yield (Nm3/kg) | Yield H2 Content/vol% | CCE % | References |
|---|---|---|---|---|---|---|---|---|---|---|---|---|
| ZSM-5 zeolite | Beech-wood and poly | - | - | - | 854 | 90 | 0.30 | 0.63 | - | - | 98.20 | [52] |
| - | Palm kernel shell and sub-bituminous coal | 160 | 40.00 | 21.13 | 800 | 1440 | 0.60 | 0.20 | - | 12.00 | 82.80 | [53] |
| NiO/modified dolomite | Coffee husk | - | - | - | 900 | - | 0.15 | 1.50 | 1.75 | 27.00 | - | [54] |
| - | Carbonaceous feedstock | 275 | 0.80 | - | 820 | - | 0.19 | 1.00 | 2.00 | 40.00 | - | [55] |
| - | Citrus peel | 500 | 40.31 | 4.65 | 750 | 20 | 0.30 | 1.25 | 0.69 | 26.00 | 87.00 | [56] |
| Ni/CeO2/Al2CO3 | Wood residue | - | 49.18 | - | 823 | 44 | 0.17 | 0.71 | 1.66 | 42.52 | 93.56 | [57] |
| - | Straw | 7500 | 17.15 | 14.96 | 850 | 60 | 0.16 | - | 0.90 | 17.00 | 75.00 | [58] |
| Commercial Ni-catalyst *1 | Almond shells | - | 11.00 | - | 815 | 60 | - | 0.49 | 1.70 | 55.30 | - | [59] |
| Ternary molten carbonates | Forestry biomass waste | - | 3.89 | - | 750 | 60 | - | 1.00 | - | 55.00 | - | [60] |
| - | Pine sawdust and MSW | 2000 | 18.82 | - | 850 | - | 0.21 | - | 13.40 | 9.80 | - | [61] |
| High-alumina bauxite | Straw | 7500 | 17.50 | 9.35 | 726 | 60 | 0.16 | - | - | 14.90 | 70.99 | [62] |
| Calcium (Ca) | Rice husk and bamboo dust | 670 | - | 5.05 | 800 | 30 | 0.35 | 0.41 | 1.72 | - | 98.00 | [63] |
| Commercial Zeolite *2 | Empty fruit bunch | 3000 | 8.60 | - | 973 | 30 | - | 2.00 | - | 75.00 | - | [64] |
| Industrial sludge derived catalysts | - | 320 | 10.35 | 4.84 | 800 | 50 | 0.30 | 1.00 | - | 12.46 | 100.00 | [65] |
| SCG ash | - | 1400 | 20.00 | 12.20 | 900 | 30 | - | 0.53 | - | 6.00 | - | [66] |
| Coal bottom ash | Palm kernel shell | 750 | 14.25 | 12.50 | 692 | 60 | - | 1.50 | - | 79.77 | 59.90 | [67] |
| Calcined dolomite | - | 5000 | 35.20 | - | 1000 | 50 | 0.14 | 1.00 | - | 49.10 | 60.80 | [68] |
Company information: *1 Johnson Matthey. *2 Zeolyst, Malaysia Sdn. Bhd., Malaysia.
The types of fluidized bed reactors and their corresponding reported hydrogen contents from Table 1 and Table 2 were summarized and plotted in Figure 3. Obviously, different types of fluidized bed reactors from different reported sources tend to yield different reported values of hydrogen contents. In Figure 3, the top three reported hydrogen contents were annotated. For example, the hydrogen content could reach nearly 80% when almond shell was fed into fluidized bed gasifier using commercial nickel as catalyst. The bubbling fluidized bed reactor also generated hydrogen content reaching around 70% when empty fruit bunch was used as feedstock.
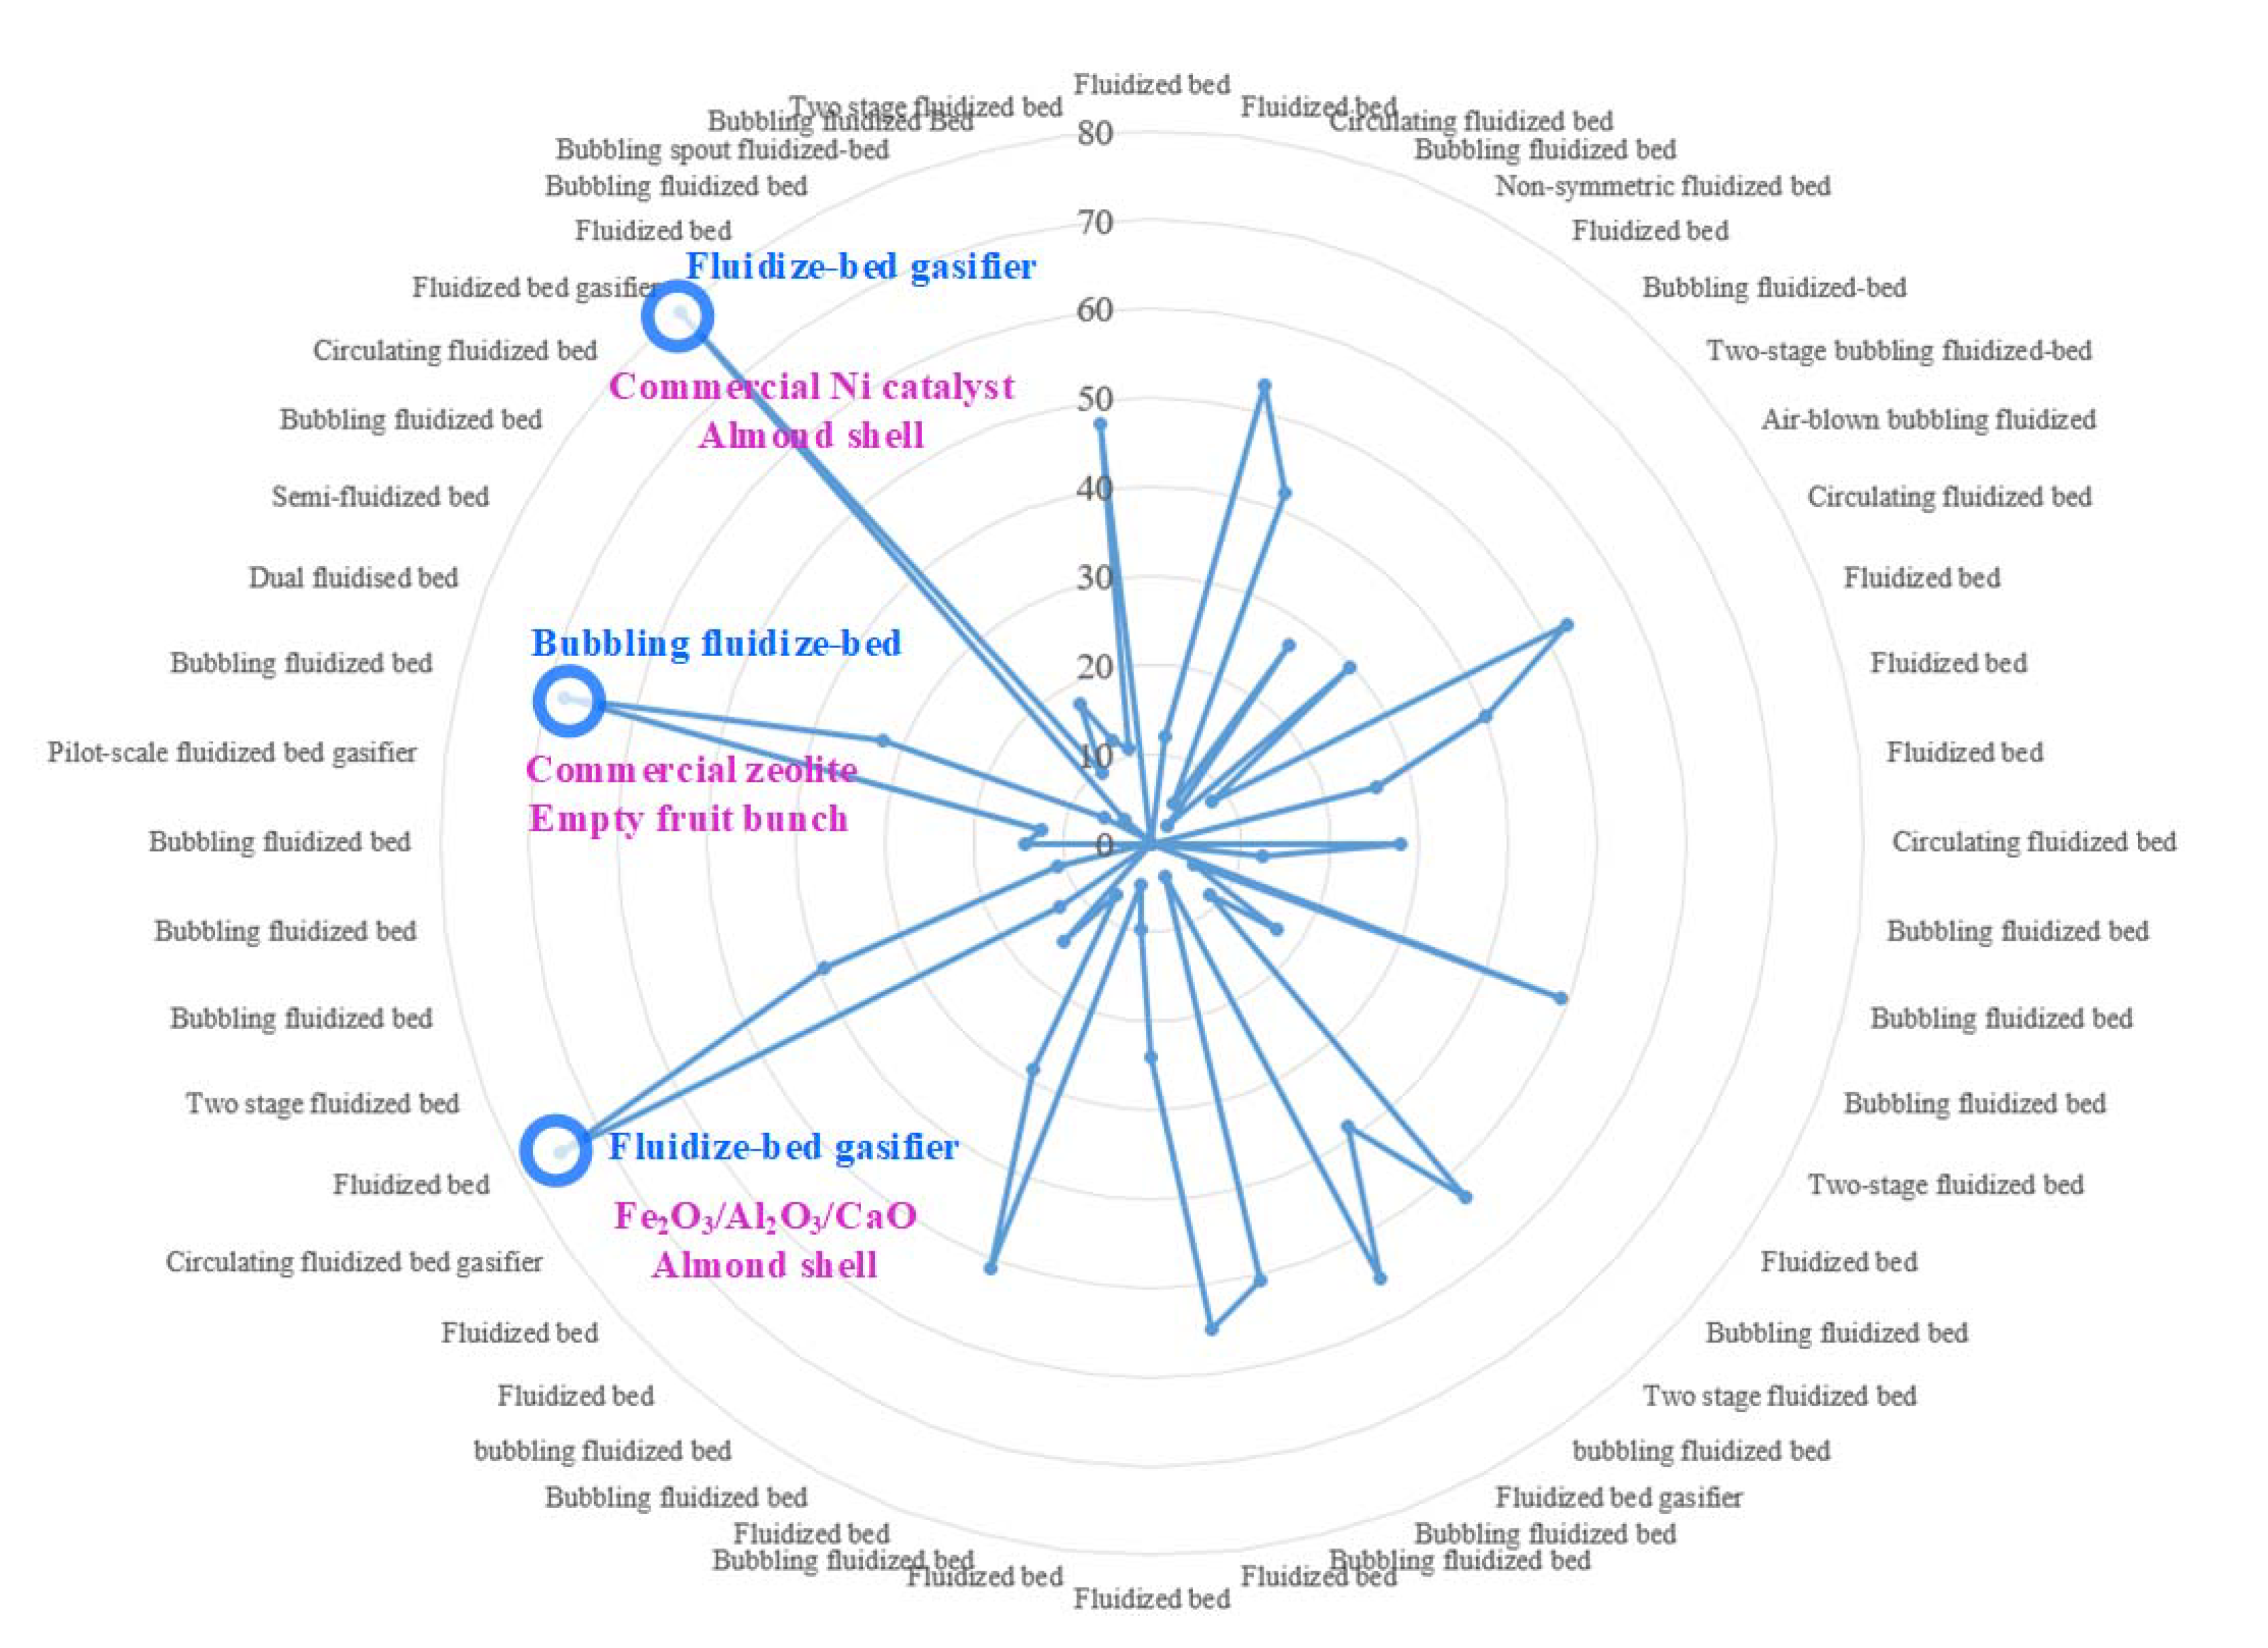 Figure 3. Types of fluidized bed versus hydrogen yield (vol-%), the circles with number labelled represent hydrogen yield (%) and the top three hydrogen yield case are displayed in blue and purple.
3. Conclusions
We compared the commonly used hydrogen production technologies including steam methane reforming, electrolysis, and biomass gasification. Among the technologies, biomass gasification using fluidized bed reactor was thoroughly reviewed, including the types and operating conditions. Biomass gasification can be considered as a promising alternative technology for hydrogen production owing to the renewable, abundant, carbon neutral, and cost-effective nature of the feedstock. Subsequently, biomass gasifiers including entrained flow gasifier, fixed bed and fluidized bed reactor (FBR) were compared. Due to the inherent advantage of enhanced mass and heat transfer, the FBR was identified as the most promising biomass gasification technique for hydrogen production. In addition, to quantitatively assess the pivotal operational parameters of FBR, seven key inputs and three outputs were extracted from the reported literatures as a training data set. These inputs are SBR, ER, temperature, PS of feedstock, residence time, LHV, and CC. The three outputs are HY, HC, and CCE. The results of the statistical analysis indicate that six binary parameters are statistically significant to the outputs. In terms of high HY, SBR, and ER, relatively low values were suggested for efficient reaction and economic considerations. A high HC was proposed based on a shorter reaction time within 180 min under 850 °C for biomass that contained high LHV and fine particle sizes. The optimal CCE values could be obtained within an ER range of 0.15 to 0.35, operating temperature of 700 to 850 °C, reaction time within 180 min, and with CC values beyond 8%, as inputs. This analysis may provide a revealing insight for users who wish to realize high working efficiency using biomass gasification technology for hydrogen production.
This entry is adapted from the peer-reviewed paper 10.3390/j4030022
References
- Sun, Y.; Lin, Z.; Peng, S.H.; Sage, V.; Sun, Z. A Critical Perspective on CO2 Conversions into Chemicals and Fuels. J. Nanosci. Nanotechnol. 2019, 19, 3097–3109.
- Schlapbach, L.; Zuttel, A. Hydrogen-storage materials for mobile applications. Nature 2001, 414, 353–358.
- Sun, Y.; Zhang, J.; Yang, G.; Li, Z. Analysis of trace elements in corncob by microwave Digestion-ICP-AES. Spectrosc. Spect. Anal. 2007, 27, 1424–1427.
- Sun, Y.; He, J.; Yang, G.; Sun, G.; Sage, V. A Review of the Enhancement of Bio-Hydrogen Generation by Chemicals Addition. Catalysts 2019, 9, 353.
- Al-Juboori, O.; Sher, F.; Khalid, U.; Niazi, M.B.K.; Chen, G.Z. Electrochemical Production of Sustainable Hydrocarbon Fuels from CO2 Co-electrolysis in Eutectic Molten Melts. ACS Sustain. Chem. Eng. 2020, 8, 12877–12890.
- Al-Juboori, O.; Sher, F.; Hazafa, A.; Khan, M.K.; Chen, G.Z. The effect of variable operating parameters for hydrocarbon fuel formation from CO2 by molten salts electrolysis. J. CO2 Util. 2020, 40, 101193.
- Sun, Y.; Mang, J.P.; Yang, G.; Li, Z.H. Study on the spectra of spruce lignin with chlorine dioxide oxidation. Spectrosc. Spect. Anal. 2007, 27, 1551–1554.
- Mallapaty, S. How China Could Be Carbon Neutral by Mid-Century. Nature 2020, 586, 482–483.
- YLiu, Y.; Min, J.L.; Feng, X.Y.; He, Y.; Liu, J.Z.; Wang, Y.X.; He, J.; Do, H.N.; Sage, V.; Yang, G.; et al. A Review of Biohydrogen Productions from Lignocellulosic Precursor via Dark Fermentation: Perspective on Hydrolysate Composition and Electron-Equivalent Balance. Energies 2020, 13, 1–27.
- Sun, Y.; Wang, Y.S.; Yang, G.; Sun, Z. Optimization of biohydrogen production using acid pretreated corn stover hydrolysate followed by nickel nanoparticle addition. Int. J. Energy Res. 2020, 44, 1843–1857.
- Sun, Y.; Zhang, J.; Yang, G.; Li, Z. Analysis of trace elements in corn by inductively coupled plasma-atomic emission spectrometry. Food Sci. 2007, 28, 236–237.
- Al-Shara, N.K.; Sher, F.; Yaqoob, A.; Chen, G.Z. Electrochemical investigation of novel reference electrode Ni/Ni(OH)₂ in comparison with silver and platinum inert quasi-reference electrodes for electrolysis in eutectic molten hydroxide. Int. J. Hydrogen Energy 2019, 44, 27224–27236.
- Al-Shara, N.K.; Sher, F.; Iqbal, S.Z.; Sajid, Z.; Chen, G.Z. Electrochemical study of different membrane materials for the fabrication of stable, reproducible and reusable reference electrode. J. Energy Chem. 2020, 49, 33–41.
- Sun, Y.; Yang, G.; Zhang, J.P.; Wen, C.; Sun, Z. Optimization and kinetic modeling of an enhanced bio-hydrogen fermentation with the addition of synergistic biochar and nickel nanoparticle. Int. J. Energy Res. 2019, 43, 983–999.
- Martínez, I.; Grasa, G.; Meyer, J.; Di Felice, L.; Kazi, S.; Sanz, C.; Maury, D.; Voisin, C. Performance and operating limits of a sorbent-catalyst system for sorption-enhanced reforming (SER) in a fluidized bed reactor. Chem. Eng. Sci. 2019, 205, 94–105.
- Di Giuliano, A.; Giancaterino, F.; Courson, C.; Foscolo, P.U.; Gallucci, K. Development of a Ni-CaO-mayenite combined sorbent-catalyst material for multicycle sorption enhanced steam methane reforming. Fuel 2018, 234, 687–699.
- Sun, Y.; Zhang, J.P.; Yang, G.; Li, Z.H. An improved process for preparing activated carbon with large specific surface area from corncob. Chem. Biochem. Eng. Q. 2007, 21, 169–174.
- Kulkarni, A.; Baker, R.; Abdoulmomine, N.; Adhikari, S.; Bhavnani, S. Experimental study of torrefied pine as a gasification fuel using a bubbling fluidized bed gasifier. Renew. Energy 2016, 93, 460–468.
- Valin, S.; Bedel, L.; Guillaudeau, J.; Thiery, S.; Ravel, S. CO2 as a substitute of steam or inert transport gas in a fluidised bed for biomass gasification. Fuel 2016, 177, 288–295.
- Kook, J.W.; Choi, H.M.; Kim, B.H.; Ra, H.W.; Yoon, S.J.; Mun, T.Y.; Kim, J.H.; Kim, Y.K.; Lee, J.G.; Seo, M.W. Gasification and tar removal characteristics of rice husk in a bubbling fluidized bed reactor. Fuel 2016, 181, 942–950.
- Robinson, T.; Bronson, B.; Gogolek, P.; Mehrani, P. Comparison of the air-blown bubbling fluidized bed gasification of wood and wood–PET pellets. Fuel 2016, 178, 263–271.
- Manatura, K.; Lu, J.-H.; Wu, K.-T.; Hsu, H.-T. Exergy analysis on torrefied rice husk pellet in fluidized bed gasification. Appl. Therm. Eng. 2017, 111, 1016–1024.
- Couto, N.; Silva, V.; Cardoso, J.; Rouboa, A. 2nd law analysis of Portuguese municipal solid waste gasification using CO2/air mixtures. J. CO2 Util. 2017, 20, 347–356.
- González-Vázquez, M.P.; García, R.; Gil, M.V.; Pevida, C.; Rubiera, F. Comparison of the gasification performance of multiple biomass types in a bubbling fluidized bed. Energy Convers. Manag. 2018, 176, 309–323.
- Bharath, M.; Raghavan, V.; Prasad, B.V.S.S.S.; Chakravarthy, S.R. Co-gasification of Indian rice husk and Indian coal with high-ash in bubbling fluidized bed gasification reactor. Appl. Therm. Eng. 2018, 137, 608–615.
- Zhang, J.; Wang, M.; Xu, S.; Feng, Y. Hydrogen and methane mixture from biomass gasification coupled with catalytic tar reforming, methanation and adsorption enhanced reforming. Fuel Process. Technol. 2019, 192, 147–153.
- Hervy, M.; Remy, D.; Dufour, A.; Mauviel, G. Air-blown gasification of Solid Recovered Fuels (SRFs) in lab-scale bubbling fluidized-bed: Influence of the operating conditions and of the SRF composition. Energy Convers. Manag. 2019, 181, 584–592.
- Ma, X.; Zhao, X.; Gu, J.; Shi, J. Co-gasification of coal and biomass blends using dolomite and olivine as catalysts. Renew. Energy 2019, 132, 509–514.
- Nguyen, N.M.; Alobaid, F.; May, J.; Peters, J.; Epple, B. Experimental study on steam gasification of torrefied woodchips in a bubbling fluidized bed reactor. Energy 2020, 202, 117744.
- Pio, D.T.; Tarelho, L.A.C.; Tavares, A.M.A.; Matos, M.A.A.; Silva, V. Co-gasification of refused derived fuel and biomass in a pilot-scale bubbling fluidized bed reactor. Energy Convers. Manag. 2020, 206, 112476.
- Gupta, S.; Choudhary, S.; Kumar, S.; De, S. Large eddy simulation of biomass gasification in a bubbling fluidized bed based on the multiphase particle-in-cell method. Renew. Energy 2021, 163, 1455–1466.
- Kartal, F.; Özveren, U. A comparative study for biomass gasification in bubbling bed gasifier using Aspen HYSYS. Bioresour. Technol. Rep. 2021, 13, 100615.
- Porcu, A.; Xu, Y.; Mureddu, M.; Dessì, F.; Shahnam, M.; Rogers, W.A.; Sastri, B.S.; Pettinau, A. Experimental validation of a multiphase flow model of a lab-scale fluidized-bed gasification unit. Appl. Energy 2021, 293, 116933.
- Nguyen, N.M.; Alobaid, F.; Epple, B. Chemical looping gasification of torrefied woodchips in a bubbling fluidized bed test rig using iron-based oxygen carriers. Renew. Energy 2021, 172, 34–45.
- Pandey, D.S.; Kwapinska, M.; Gómez-Barea, A.; Horvat, A.; Fryda, L.E.; Rabou, L.P.L.M.; Leahy, J.J.; Kwapinski, W. Poultry Litter Gasification in a Fluidized Bed Reactor: Effects of Gasifying Agent and Limestone Addition. Energy Fuels 2016, 30, 3085–3096.
- Agu, C.E.; Moldestad, B.M.E.; Pfeifer, C. Assessment of Combustion and Gasification Behavior in a Bubbling Fluidized Bed Reactor: A Comparison between Biomass with and without Chemical Additives. Energy Fuels 2020, 34, 9654–9663.
- Kang, P.; Hu, X.E.; Lu, Y.; Wang, K.; Zhang, R.; Han, L.; Yuan, H.; Chen, H.; Luo, X.; Zhou, Y.J. Modeling and Optimization for Gas Distribution Patterns on Biomass Gasification Performance of a Bubbling Spout Fluidized Bed. Energy Fuels 2020, 34, 1750–1763.
- Lardier, G.; Kaknics, J.; Dufour, A.; Michel, R.; Cluet, B.; Authier, O.; Poirier, J.; Mauviel, G. Gas and Bed Axial Composition in a Bubbling Fluidized Bed Gasifier: Results with Miscanthus and Olivine. Energy Fuels 2016, 30, 8316–8326.
- Di Marcello, M.; Tsalidis, G.A.; Spinelli, G.; de Jong, W.; Kiel, J.H.A. Pilot scale steam-oxygen CFB gasification of commercial torrefied wood pellets. The effect of torrefaction on the gasification performance. Biomass Bioenergy 2017, 105, 411–420.
- Peng, W.-X.; Ge, S.-B.; Ebadi, A.G.; Hisoriev, H.; Esfahani, M.J. Syngas production by catalytic co-gasification of coal-biomass blends in a circulating fluidized bed gasifier. J. Clean. Prod. 2017, 168, 1513–1517.
- Nakyai, T.; Authayanun, S.; Patcharavorachot, Y.; Arpornwichanop, A.; Assabumrungrat, S.; Saebea, D. Exergoeconomics of hydrogen production from biomass air-steam gasification with methane co-feeding. Energy Convers. Manag. 2017, 140, 228–239.
- Mallick, D.; Mahanta, P.; Moholkar, V.S. Co–gasification of coal/biomass blends in 50 kWe circulating fluidized bed gasifier. J. Energy Inst. 2020, 93, 99–111.
- Wan, Z.; Hu, J.; Qi, X. Numerical analysis of hydrodynamics and thermochemical property of biomass gasification in a pilot-scale circulating fluidized bed. Energy 2021, 225, 120254.
- Liu, Z.-S.; Lin, C.-L.; Chang, T.-J.; Weng, W.-C. Waste-gasification efficiency of a two-stage fluidized-bed gasification system. Waste Manag. 2016, 48, 250–256.
- Liu, L.; Huang, Y.; Cao, J.; Liu, C.; Dong, L.; Xu, L.; Zha, J. Experimental study of biomass gasification with oxygen-enriched air in fluidized bed gasifier. Sci. Total. Environ. 2018, 626, 423–433.
- Lin, C.-L.; Wu, M.-H.; Weng, W.-C. Effect of the type of bed material in two-stage fluidized bed gasification reactors on hydrogen gas synthesis and heavy metal distribution. Int. J. Hydrogen Energy 2019, 44, 5633–5639.
- Kuo, J.-H.; Lin, C.-L.; Ho, C.-Y. Effect of fluidization/gasification parameters on hydrogen generation in syngas during fluidized-bed gasification process. Int. J. Hydrogen Energy 2021.
- Cao, Y.; Bai, Y.; Du, J. Air-steam gasification of biomass based on a multi-composition multi-step kinetic model: A clean strategy for hydrogen-enriched syngas production. Sci. Total Environ. 2021, 753, 141690.
- Wang, G.; Xu, S.; Wang, C.; Zhang, J. Biomass Gasification and Hot Gas Upgrading in a Decoupled Dual-Loop Gasifier. Energy Fuels 2017, 31, 8181–8192.
- Niu, M.; Huang, Y.; Jin, B.; Liang, S.; Dong, Q.; Gu, H.; Sun, R. A novel two-stage enriched air biomass gasification for producing low-tar high heating value fuel gas: Pilot verification and performance analysis. Energy 2019, 173, 511–522.
- Lin, C.-L.; Chou, J.-D.; Iu, C.-H. Effects of second-stage bed materials on hydrogen production in the syngas of a two-stage gasification process. Renew. Energy 2020, 154, 903–912.
- Zhu, H.L.; Zhang, Y.S.; Materazzi, M.; Aranda, G.; Brett, D.J.L.; Shearing, P.R.; Manos, G. Co-gasification of beech-wood and polyethylene in a fluidized-bed reactor. Fuel Process. Technol. 2019, 190, 29–37.
- Valdés, C.F.; Chejne, F.; Marrugo, G.; Macias, R.J.; Gómez, C.A.; Montoya, J.I.; Londoño, C.A.; De la Cruz, J.; Arenas, E. Co-gasification of sub-bituminous coal with palm kernel shell in fluidized bed coupled to a ceramic industry process. Appl. Therm. Eng. 2016, 107, 1201–1209.
- Couto, N.; Monteiro, E.; Silva, V.; Rouboa, A. Hydrogen-rich gas from gasification of Portuguese municipal solid wastes. Int. J. Hydrogen Energy 2016, 41, 10619–10630.
- Kaushal, P.; Tyagi, R. Advanced simulation of biomass gasification in a fluidized bed reactor using ASPEN PLUS. Renew. Energy 2017, 101, 629–636.
- Prestipino, M.; Chiodo, V.; Maisano, S.; Zafarana, G.; Urbani, F.; Galvagno, A. Hydrogen rich syngas production by air-steam gasification of citrus peel residues from citrus juice manufacturing: Experimental and simulation activities. Int. J. Hydrogen Energy 2017, 42, 26816–26827.
- Peng, W.X.; Wang, L.S.; Mirzaee, M.; Ahmadi, H.; Esfahani, M.J.; Fremaux, S. Hydrogen and syngas production by catalytic biomass gasification. Energy Convers. Manag. 2017, 135, 270–273.
- Liu, C.; Huang, Y.; Niu, M.; Pei, H.; Liu, L.; Wang, Y.; Dong, L.; Xu, L. Influences of equivalence ratio, oxygen concentration and fluidization velocity on the characteristics of oxygen-enriched gasification products from biomass in a pilot-scale fluidized bed. Int. J. Hydrogen Energy 2018, 43, 14214–14225.
- Savuto, E.; Di Carlo, A.; Steele, A.; Heidenreich, S.; Gallucci, K.; Rapagnà, S. Syngas conditioning by ceramic filter candles filled with catalyst pellets and placed inside the freeboard of a fluidized bed steam gasifier. Fuel Process. Technol. 2019, 191, 44–53.
- Jin, K.; Ji, D.; Xie, Q.; Nie, Y.; Yu, F.; Ji, J. Hydrogen production from steam gasification of tableted biomass in molten eutectic carbonates. Int. J. Hydrogen Energy 2019, 44, 22919–22925.
- Cao, Y.; Fu, L.; Mofrad, A. Combined-gasification of biomass and municipal solid waste in a fluidized bed gasifier. J. Energy Inst. 2019, 92, 1683–1688.
- Ismail, T.M.; Ramos, A.; Monteiro, E.; El-Salam, M.A.; Rouboa, A. Parametric studies in the gasification agent and fluidization velocity during oxygen-enriched gasification of biomass in a pilot-scale fluidized bed: Experimental and numerical assessment. Renew. Energy 2020, 147, 2429–2439.
- Mallick, D.; Mahanta, P.; Moholkar, V.S. Co-gasification of biomass blends: Performance evaluation in circulating fluidized bed gasifier. Energy 2020, 192, 116682.
- Inayat, A.; Khan, Z.; Aslam, M.; Shahbaz, M.; Ahmad, M.M.; Mutalib, M.I.A.; Yusup, S. Integrated adsorption steam gasification for enhanced hydrogen production from palm waste at bench scale plant. Int. J. Hydrogen Energy 2020.
- Chen, Y.-H.; Ngo, T.N.L.T.; Chiang, K.-Y. Enhanced hydrogen production in co-gasification of sewage sludge and industrial wastewater sludge by a pilot-scale fluidized bed gasifier. Int. J. Hydrogen Energy 2021, 46, 14083–14095.
- Kibret, H.A.; Kuo, Y.-L.; Ke, T.-Y.; Tseng, Y.-H. Gasification of spent coffee grounds in a semi-fluidized bed reactor using steam and CO2 gasification medium. J. Taiwan Inst. Chem. Eng. 2021, 119, 115–127.
- Shahbaz, M.; Yusup, S.; Inayat, A.; Patrick, D.O.; Ammar, M.; Pratama, A. Cleaner Production of Hydrogen and Syngas from Catalytic Steam Palm Kernel Shell Gasification Using CaO Sorbent and Coal Bottom Ash as a Catalyst. Energy Fuels 2017, 31, 13824–13833.
- Tian, Y.; Zhou, X.; Lin, S.; Ji, X.; Bai, J.; Xu, M. Syngas production from air-steam gasification of biomass with natural catalysts. Sci. Total Environ. 2018, 645, 518–523.
This entry is offline, you can click here to edit this entry!