Your browser does not fully support modern features. Please upgrade for a smoother experience.
Please note this is an old version of this entry, which may differ significantly from the current revision.
Subjects:
Engineering, Civil
The block shear failure was reported firstly in 1978 for joints with not optimal geometry from an internal forces point of view. The test results proved the potential failure mode of tearing out in the web of the beam. Several studies concerning block shear failure were published in the last twenty years predicting the block shear capacity as a combination of fracture on the tension and shear plane. Block shear rupture is the potential failure mode for gusset plates, fin plates, coped beams, single/double angles and tee connections, where significant tension/shear forces are present.
- structural steel connections
- bolted connections
- finite element method
- component-based FEM
- block shear failure
1. Introduction
The block shear failure was first reported in 1978 in [1] for joints without optimal geometry from an internal forces point of view. The test results proved the potential failure mode of tearing out in the web of the beam. Several studies concerning the block shear failure were published in the last twenty years [2][3][4][5][6][7], predicting the block shear capacity as a combination of fracture on the tension and shear plane (see Figure 1). Block shear rupture is the potential failure mode for gusset plates, fin plates, coped beams, single/double angles and tee connections, where significant tension/shear forces are present.
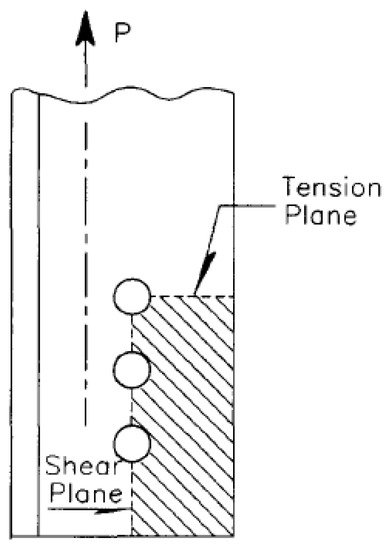
Figure 1. Typical block shear failure mechanism. Reproduced with permission from ref. [8], copyright (1995), Elsevier.
The analytical approaches of designing against block shear failure are described in standards. The design approaches are based on a simple assumption that the block shear capacity is the combination of the yielding along shear planes and rupture on the tensile plane. The analytical models used for verification in this study include currently valid Eurocode EN1993-1-8:2006 [9], US structural steel design code A360-16 [10], 2nd generation of Eurocode prEN1993-1-8 [11], which is planned to be issued after 2020, Canadian structural steel design standard CSA S16-09 [12] and analytical models proposed by Topkaya [5] and Driver [6]. The major advantage of these models is that they can be used in most cases and they are easy to apply, but no studies have dealt with complex loading, including substantial eccentricities and general block failure. Despite the existence of several design approaches to predict block shear capacity, the prediction of failure mode appears to have the same importance.
With the development of computational technology, it is possible to create advanced finite element models. These can be validated by experiments; therefore, the behaviour of numerical simulation is close to the physical test behaviour. Their main advantage is that once the appropriate finite element model is created, it is possible to carry a parametric study on it with minor modifications without the need for carrying out additional physical tests. However, making an accurate finite element model is laborious and, due to many variables, such as the definition of boundary conditions, meshing, etc., the results are not always representative. The finite element analysis of block shear failure has been developed since 2002, when numerical simulations were presented in [7]. The majority of the following numerical models covered the tensile fracture but not the shear rupture and development of a shear crack. The block shear failure, capturing the ductile fracture and combining both shear and tension failure, is presented in [4][13][14]. The prediction of the shear crack development in the bolted connection is presented by the appropriate failure criteria.
The approach, which combines the component method and finite element method, is called component-based FEM (CBFEM). As the name suggests, it combines aspects of the finite element method and component method to provide a satisfactory way of designing steel joints, while simultaneously complying with valid standards. Contrary to complex finite element simulations, it is commonly used for designing steel joints in practice. The CBFEM model is verified by the analytical and research-oriented FEM models comparing the block shear capacity in three levels of complexity.
2. Design-Oriented Finite Element Analysis
2.1. Model
Design-oriented finite element analysis was carried out with the software IDEA StatiCa. The software combines the finite element method with the component method and offers an alternative to conventional analytical models and the laborious component method. Contrary to RFEM, IDEA software uses 2D shell elements for plates, whereas fasteners (welds, bolts, contacts, etc.) are represented by components with pre-defined properties based on experimental findings.
The elastoplastic material with strain hardening was modelled according to EN 1993-1-5:2006. The material behaviour was based on the von Mises yield criterion. It was assumed to be elastic before reaching the yield strength fy. The ultimate limit state criterion for regions not susceptible to buckling is reaching a limiting value of the principal membrane strain. A value of 5% is recommended.
Plates were modelled by 4-node quadrangle shell elements. Each node had 6 degrees of freedom. The deformations of the element consisted of membrane and flexural contributions. Rotations perpendicular to the element were included by a full 3D formulation of the element. The formulation of the membrane behaviour was based on the study by Ibrahimbegovic [15]. The deformation of the nodes was represented by a bilinear stress–strain diagram. A quadratic basis function was considered along the element edges. The basis function represented the rotation perpendicular to the element. The flexural deformation was based on the Mindlin hypothesis, considering shear deformation, specifically on the MITC4 element [16]. A normal axis rotation of the plate was described by bilinear functions. The shear deformation was constant along the element edge. The resulting internal forces in the nodes and the element stiffness matrix were calculated by integrating over four Gauss points. The plastic behaviour was solved in each integration point. Every point was split into 5 integration points along the thickness of the element (Gauss–Lobatto integration). The nonlinear elastic-plastic stage of material was analysed in each layer based on the known strains.
Contact elements were used to transmit the pressure forces between plates. The standard penalty method was used for modelling the contact between the plates. The penalty stiffness was considered between the node and the opposite plate, when penetration into the opposite contact surface was detected. The penalty stiffness was controlled by a heuristic algorithm during the nonlinear calculation to ensure the convergence of the iteration. The solver detected the contact points and created an interpolation link between the penetrating nodes and the nodes on the opposite plate. The advantage of the penalty method is the automatic assembly of the model. The contact between the plates has a major impact on the redistribution of the forces in the connection [17].
Bolts were divided into three sub-components, which simulated the tensile behaviour of the bolt shank, the contact between the plate and the bolt head, nut or washer and the contact between the bolt shank and the plate. The bolt shank was modelled as a nonlinear spring, which did not transfer pressure forces. The pressure was transmitted by contact elements between the connected plates. The second sub-component transmitted tensile forces from the bolt to the plate. An interpolation link (a multi-point constraint) was inserted between the bolt shank and the flange nodes. The third sub-component ensured the shear transmission. The shear forces were transferred on the shank–hole face. This was modelled with the aid of contact elements between the node of the bolt shank and the nodes of the edges of the opening. The bolt shank transferred compression forces in the bolt hole. The stiffness of the shell elements around the opening was designed in such a way that a corresponding bearing strength was achieved when the plastic material of the plate was used. More about the design approach of a T-stub component by the component-based finite element method (CBFEM) is in [18].
Two CBFEM models with geometries and materials corresponding to the physical tests described in Section 2 were created. The models are shown in Figure 2.
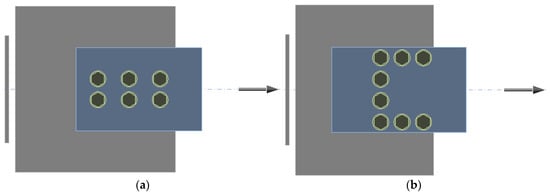
Figure 2. CBFEM model of (a) specimen T1 and (b) specimen T2.
The default configuration AISC 360-16 was used, material factors were equal to 1.0 and the finite element size was set to vary from 5 to 10 mm. The ultimate load for CBFEM models was assumed to appear when the plastic strain reached 5%.
2.2. Verification
The comparison of RFEM, CBFEM and analytical models is shown in Figure 3 and Figure 4. The most conservative is the model in EN1993-1-8:2006 because, unlike other models, it uses the net shear plane in combination with yield stress, while yielding in the gross shear plane is observed in experiments and numerical models. In the next generation of Eurocodes (prEN1993-1-8), the formula for block shear resistance will be changed. The stiffness of the CBFEM model is lower compared to the RFEM model. The RFEM model disregards any slip, but in CBFEM, the shear model of bolts is according to a standard approximated with the assumption of regular bolt holes.
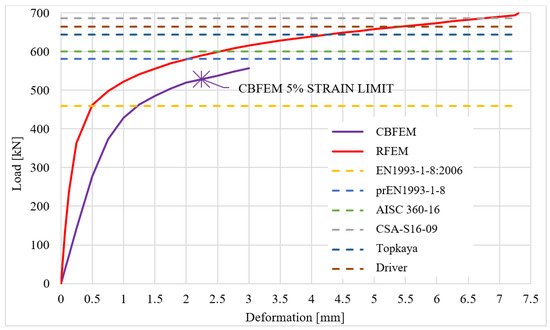
Figure 3. Comparison of RFEM, CBFEM and analytical models for specimen T1.
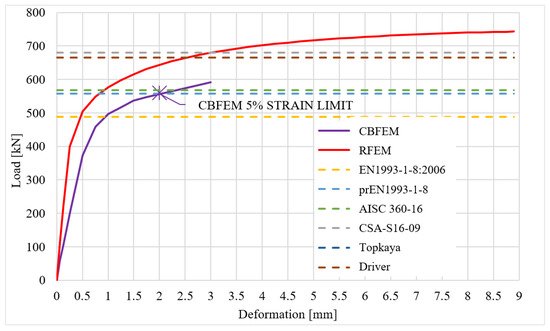
Figure 4. Comparison of RFEM, CBFEM and analytical models for specimen T2.
The results show that the CBFEM model is conservative compared to analytical models, except the current valid EN1993-1-8:2006. There is also a very high rate of compliance with the upcoming prEN1993-1-8 (90% and 99%) and with AISC 360-16 (87% and 98%). As was mentioned before, the EN1993-1-8:2006 does not consider two possible modes of block tearing progress and, unlike other models, it uses the net shear plane in combination with yield stress.
The correlation between design-oriented and research-oriented models is very good and the CBFEM results are on the safe side, except the F0.05 value. The comparison of CBFEM and RFEM models are in Table 1 for specimen T1, the initial stiffness Nj,ini seems overly conservative when compared to the RFEM model, even though the higher rate of difference is acceptable in the case of initial stiffness. This may be caused by the different meshing of each model, more advanced material description in the RFEM model (plastic hardening), component representation of bolts in the case of CBFEM instead of infinitely rigid remote displacement used in RFEM and deformation of splice plates in the CBFEM model.
Table 1. Comparison of CBFEM and RFEM models for specimen T1.
| T1 Specimen | Values | CBFEM/RFEM Ratio (-) | ||
|---|---|---|---|---|
| Compared Parameters | Units | RFEM | CBFEM | |
| Nj,ini | (MN/m) | 2153.4 | 594.3 | 0.28 |
| Fpeak | (kN) | 698.1 | 523.0 | 0.75 |
| F2mm | (kN) | 580.1 | 519.7 | 0.90 |
| F0.05 | (kN) | 486.3 | 523.0 | 1.08 |
| F2/3 | (kN) | 654.5 | 519.7 | 0.79 |
The distinction between F0.05 values is probably caused by the fact that the strain is a local characteristic and it is highly dependent on the mesh element size. The difference between mesh density of the research-oriented model and the design-oriented model is significant and causes the increased plastic strain in RFEM.
3. Sensitivity Study
The CBFEM model T1 was used to study the influence of input parameters on the resistance of the joint. The tested parameters were the pitch distance and plate thickness. The output value subjected to comparison was the ultimate strength of the joint, which was compared to the results obtained by different design standards.
The CBFEM model ultimate resistances were calculated according to AISC 360-16 standard with the LRFD method. The ultimate resistance for the CBFEM model was assumed to appear when the strain reached 5%. The CBFEM results were plotted together with the analytical model results of recent/upcoming codes—EN1993-1-8:2006, AISC 360-16, prEN1993-1-8.
Specimen T1 was used to study the influence of the bolt pitch (Figure 5) and the plate thickness (Figure 6) on the block shear resistance. The bolt pitch was successively set to 56, 66, 76, 86, 96 and 106 mm. The study was carried out on 6 different plate thicknesses: 4.6; 5.6; 6.6; 7.6; 8.6 and 9.6 mm. The models provide expected results and show the increase in block shear resistance with increased parameters in the case of symmetrical loading. The EN1993-1-8:2006 is the most conservative, followed by CBFEM, prEN1993-1-8 and AISC 360-16.
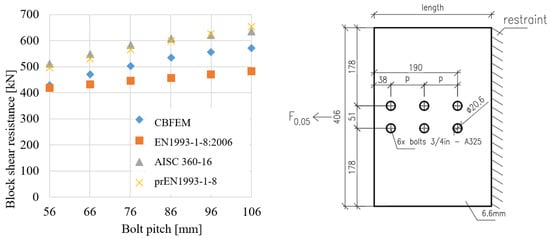
Figure 5. Sensitivity study of block shear resistance for bolt pitch, dimensions in mm.
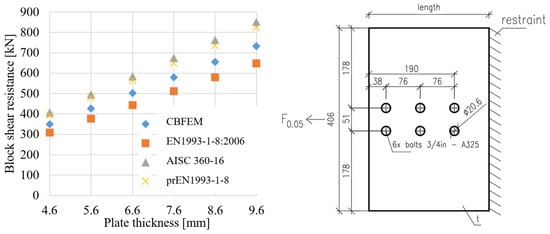
Figure 6. Sensitivity study of block shear resistance for plate thickness, dimensions in mm.
The steel grade S235 and bolts M22 grade 10.9 were used in the sensitivity study of eccentrically loaded bolted connection. Material safety factors were set to one. The geometry of the joint is shown in Figure 7. The load deflection curves of CBFEM and analytical models are shown in Figure 8. The analytical models used in codes use a constant reduction factor regardless of the magnitude of the eccentricity. It was claimed in [5][6] that the effect of in-plane eccentricity is not crucial for the total resistance, up to a 10% reduction. The reduction in resistance is significantly higher for analytical models used in the current codes. The results of the CBFEM model lie between the models presented in [5][6] and those used in codes. In contrast to analytical models where a constant reduction in resistance is used, CBFEM models employ finite element analysis for the calculations which may be advantageous in covering the actual size of the eccentricity.
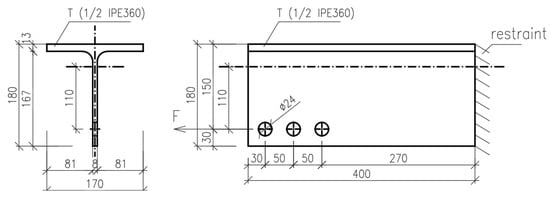
Figure 7. Geometry of the eccentrically loaded bolted connection used for FEM simulation, dimensions in mm.
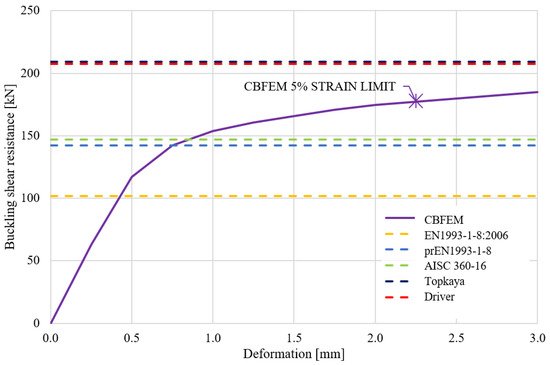
Figure 8. Load–deflection curve of eccentric bolted connection.
CBFEM models were created and compared to analytical models. If the currently valid EN 1993-1-8:2006 is excluded from the comparison, in the case of concentric connections, the CBFEM models have a good rate of compliance with analytical models and, except for one case, they are on the safe side. Models calculated according to prEN1993-1-8:2020 and AISC 360-16 were used. The study was carried out for four different pitch distances p = 56; 66; 76 and 86 mm, and six different plate thicknesses t = 4.6; 5.6; 6.6; 7.6; 8.6 and 9.6 mm. The bolt grade was A325 and 10.9 according to the relevant design standards. The results of sensitivity studies for concentric and eccentric bolted connections are summarised and shown in Figure 9. The CBFEM method is conservative for concentric connections and predicts up to 13.3% lower resistance. The validated models for eccentric connections predict up to 21% higher resistance.
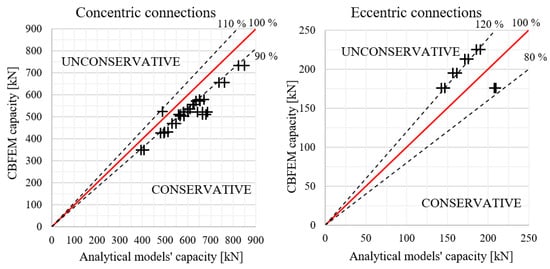
Figure 9. Comparison between analytical models and CBFEM.
The CBFEM model uses a bilinear material diagram with negligible strain hardening. On the other hand, the analytical models use a combination of yield and ultimate strengths in their formulas. The CBFEM model provides lower block shear resistances compared to the analytical models if a steel grade with a high ratio of ultimate to yield strength is used. Mesh refinement slightly decreases the block shear resistance; however, the mesh size near bolt holes is fixed.
4. Conclusions
In this study, research-oriented and design-oriented numerical models on block shear in gusset plate bolted connections were analysed. The experimental data published by [7] served for validations of the research-oriented models. The validated model correlated well with the experimental data in terms of failure modes, initial stiffness and resistance. A component-based finite element model was created and verified on the RFEM model. Load–deflection curves were plotted and the block shear resistance and initial stiffness were compared. The verification confirmed the CBFEM model as an appropriate numerical approach to predict the behaviour of gusset plate connections subjected to block shear failure and offers safe standard approval of resistance. The CBFEM is unconservative compared to all available codes in the case of eccentric connections. However, compared to models by Topkaya and Driver, it is conservative. There is a possibility to extend the study and continue the research in this way. The resistance of the gusset plate connections with various bolt pitches and plate thicknesses was explored and summarised for concentric and eccentric assemblies.
This entry is adapted from the peer-reviewed paper 10.3390/met11071088
References
- Birkemoe, P.C.; Gilmor, M.I. Behavior of Bearing Critical Double-Angle Beam Connections. Eng. J. 1978, 15, 109–115.
- Clements, D.A.; Teh, L.H. Active Shear Planes of Bolted Connections Failing in Block Shear. J. Struct. Eng. 2013, 139.
- Teh, L.H.; Uz, M.E. Block shear failure planes of bolted connections—Direct experimental verifications. J. Constr. Steel Res. 2015, 111, 70–74.
- Wen, H.; Mahmoud, H. Simulation of block shear fracture in bolted connections. J. Constr. Steel Res. 2017, 134, 1–16.
- Topkaya, C.A. Finite Element Parametric Study on Block Shear Failure of Steel Tension Members. J. Constr. Steel Res. 2004, 60, 1615–1635.
- Driver, R.G.; Grondin, G.Y.; Kulak, G.L. Unified block shear equation for achieving consistent reliability. J. Constr. Steel Res. 2006, 62, 210–222.
- Grondin, G.Y.; Huns, B.B.S.; Driver, R.G. Block Shear Behaviour of Bolted Gusset Plates; Structural engineering report No. 248; University of Alberta: Edmonton, AB, Canada, 2002.
- Cunningham, T.J.; Orbison, J.G.; Ziemian, R.D. Assessment of American block shear load capacity predictions. J. Constr. Steel Res. 1995, 35, 323–338.
- CEN. Eurocode 3: Design of Steel Structures—Part 1–8: Design of Joints; EN1993-1-8; CEN: Brussels, Belgien, 2006.
- American Institute of Steel Construction. Specification for Structural Steel Buildings; ANSI/AISC 360-16; American Institute of Steel Construction: Chicago, IL, USA, 2016.
- CEN. Eurocode 3: Design of Steel Structures—Part 1–8: Design of Joints; prEN1993-1-8; Final draft; CEN: Brussels, Belgien, 2020.
- Canadian Standard Association. Design of Steel Structures, CSA S16-09; Canadian Standard Association: Mississauga, ON, Canada, 2009.
- Kim, T.; Kuwamura, H. Finite element modelling of bolted connections in thin walled stainless steel plates under static shear. Thin Walled Struct. 2007, 45, 407–421.
- Adewole, J.J.; Joy, O.O. Finite-element block shear failure deformation-to-fracture failure analysis. Can. J. Civ. Eng. 2020, 47, 418–427.
- Ibrahimbegovic, A.; Taylor, R.L.; Wilson, E.L. A robust quadrilateral membrane finite element with drilling degrees of freedom. Int. J. Numer. Methods Eng. 1990, 30, 445–457.
- Dvorkin, E.N.; Bathe, K.J. A continuum mechanics based four-node shell element for general non-linear analysis. Eng. Comput. 1984, 1, 77–88.
- Wald, F.; Vild, M.; Kuříková, M.; Kabeláč, J.; Sekal, D.; Maier, N.; Da Silva Seco, L.; Couchaux, M. Finite-Element-Bemessung von Stahlverbindungen basierend auf der Komponentenmethode. Stahlbau 2020, 89, 482–495.
- Gödrich, L.; Wald, F.; Kabeláč, J.; Kuříková, M. Design finite element model of a bolted T-stub connection component. J. Constr. Steel Res. 2019, 157, 198–206.
This entry is offline, you can click here to edit this entry!
