Your browser does not fully support modern features. Please upgrade for a smoother experience.
Please note this is an old version of this entry, which may differ significantly from the current revision.
Subjects:
Pathology
There is limited evidence on the standard care for painful obstructive chronic pancreatitis (CP), while comparisons of endoscopic and surgical modes for pain relief have yielded conflicting results from small sample sizes.
- pancreatitis
- systematic review
- meta-analysis
Note: The following contents are extract from your paper. The entry will be online only after author check and submit it.
1. Introduction
Chronic pancreatitis is a prevailing health topic in the western countries, with a reported prevalence of around 50/100,000 persons [1,2]. Contributed by increasing societal affluence, alcohol consumption, and availability of diagnostic imaging, this condition is becoming more common also in the developing countries, ranging from 13.5 to 125 per 100,000 persons [3,4]. Alcohol is the single most common risk factor for chronic pancreatitis [1,5,6], and it predominantly affects men aged 40–60 years, imposing substantial socio-economic burdens. In the United Kingdom, it has been estimated that the direct and indirect costs relating to chronic pancreatitis totaled GBP 285.3 million per year [7]. Apart from alcoholic pancreatitis, autoimmune, metabolic, toxic, hereditary, and idiopathic pancreatitis constitute to the remaining number of the patient, and their symptoms typically recur despite medications or lifestyle modification. Abdominal pain is a leading cause of hospitalization in patients with chronic pancreatitis. Data from North American Pancreatitis Study 2 Continuation and Validation, a prospective multi-center study, showed that 66.8% of the patients experienced severe abdominal pain [8]. Such pain is commonly a result of pancreatic ductal obstruction secondary to stricture and stone formation although repetitive parenchymal inflammation also plays a major role in some non-obstructive cases. Medical treatments such as opioid-based analgesics or drugs that modulate neuropathic pain are effective for short term pain suppression, while more lasting pain control requires adequate pancreatic ductal drainage, which is chiefly done by endoscopic or surgical approach.
Stepwise escalation of treatment aggressiveness has been advocated [9,10], starting from oral analgesic regimens [11], followed by less invasive endoscopic drainage with or without extracorporeal shockwave lithotripsy for painful obstructive chronic pancreatitis. If these measures are deemed unsuccessful, surgery will be contemplated as the last resort [12,13]. The upside of this approach is that major surgery is avoided when the endoscopic treatment succeeds. A large multi-center retrospective study reported that endoscopic treatment resulted in long-term pain improvement in 80% of the patients [14]. However, a couple of studies reported that a significant proportion of patients remained in significant pain after a period of endoscopic treatment [15,16] and eventually needed a surgical procedure. In the literature, there are retrospective studies [17,18,19,20] and prospective randomized controlled trials (RCTs) [21,22,23] carried out to investigate the efficacy of different approaches to pain control in chronic pancreatitis. Moreover, recent RCT showed early surgery had lower pain scores compared with endoscopy-first approach [21].
2. Pain Relief after Endoscopic and Surgical Treatment
As to pain relief assessment, three studies [19,21,22] used the Izbicki pain score [29], one [23] used Melzack score [30], one [17] used reduction in dosage, and two [18,20] did not report their methods of pain relief assessment. Three studies [17,18,22] found no difference in pain relief between the two modalities, while four studies [19,20,21,23] reported superior pain relief with the surgical approach. Our meta-analysis of these seven studies demonstrated that surgical drainage was associated with better overall pain relief (complete and partial) as the primary outcome [OR 0.33, 95% CI 0.23–0.47, p < 0.001, I2 = 4%] (Figure 1). Four studies [18,21,22,23] reported both complete pain relief (Figure 2) and partial pain relief (Figure 3) as the secondary outcome. Although statistical difference was not demonstrable between the two treatment approaches regarding complete [OR 0.57, 95% CI 0.32–1.01, p = 0.054, I2 = 0%] and partial [OR 0.67, 95% CI 0.37–1.22, p = 0.19, I2 = 0%] pain relief, it was noted that surgical drainage tends to have a higher rate of complete pain relief (Figure 2).
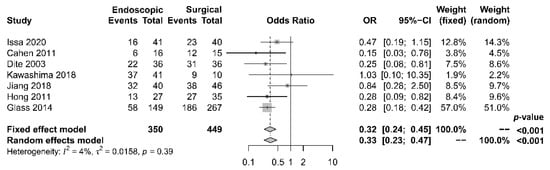
Figure 1. Forrest plot of the effect of endoscopy and surgery on overall (complete and partial) pain relief.
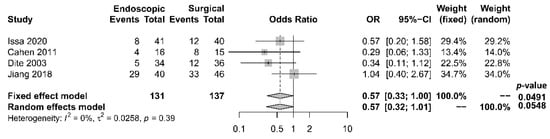
Figure 2. Forrest plot of the effect of endoscopy and surgery on complete pain relief.
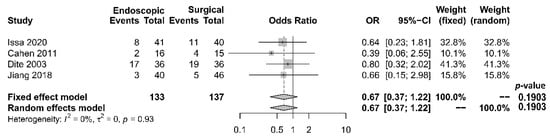
Figure 3. Forrest plot of the effect of endoscopy and surgery on partial pain relief.
3. Other Treatment Outcomes
3.1. Hospital Stay, Procedure-Related Complications, and Mortality
The length of hospital stay was reported in five studies [17,18,19,21,22], with a tendency of shorter stay in the endoscopic group. The median period of stay was 28.4 days in the endoscopic group and 36.8 days in the surgical group. Four [17,19,21,22] out of the five studies reported shorter stay in the endoscopic group, while one [18] reported that the total mean stay was longer in the endoscopic group, which had more hospital admissions. The single mean hospital stay was significantly shorter in the endoscopic group. Our meta-analysis, however, found no significant difference in length of hospital stay between the two groups [OR −0.54, 95% CI −1.23–0.15, p = 0.13, I2 = 87%] (Figure 4).
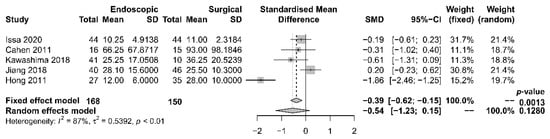
Figure 4. Forrest plot of the effect of endoscopy and surgery on length of hospital stay.
Rates of complication and mortality were reported in five studies [17,18,19,21,22]. The procedural mortality rate was 1.2% in the endoscopic group and 0.6% in the surgical group. No statistically significant difference in the occurrence of overall complication between the two groups was observed [OR 1.00, 95% CI 0.41–2.46, p = 0.99, I2 = 49%] (Figure 5).
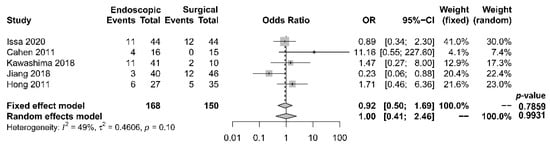
Figure 5. Forrest plot of the effect of endoscopy and surgery on complication rate.
3.2. Endocrine and Exocrine Insufficiency
Five papers [17,18,19,21,22] provided comparative data regarding endocrine insufficiency. It was noted that different definitions of endocrine insufficiency were adopted. Four studies [18,19,21,22] defined it as a new onset of diabetes mellitus or the need for glycemic control, whereas the other study [17] used the increase in HbA1c level > 6.1% as the definition. Despite the heterogeneity in the definitions adopted, all these studies reported superior outcomes with the surgical approach. The overall incidence of endocrine insufficiency was 29.8% in the endoscopic drainage group versus 20.0% in the surgical drainage group. The difference was statistically significant [OR 2.10, 95% CI 1.20–3.67, p = 0.01, I2 = 0%] (Figure 6).
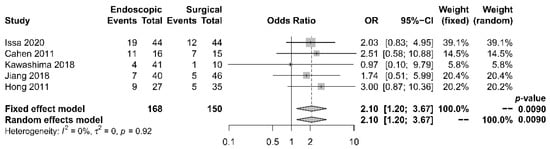
Figure 6. Forrest plot of the effect of endoscopy and surgery on endocrine insufficiency.
Six papers [17,18,19,20,21,22] reported data regarding exocrine insufficiency; similarly, different definitions were adopted. Exocrine insufficiency was defined as fecal elastase <200 μg/g in two studies [21,22], as new onset of steatorrhea in another [18], and as pancreatic functioning diagnosant level <70% in yet another [17]. The other two studies [19,20] did not report the assessment method for exocrine function. Meta-analysis was not possible due to the gross inconsistency of definitions. Nonetheless, these papers demonstrated slightly superior outcomes in the surgical group (Table 1). The overall incidence of exocrine insufficiency was 54.5% after endoscopy and 44.5% after surgery. The difference was, however, not statistically significant [p = 0.46].
4. Qualitative Assessment of the Included Studies
The three RCTs [21,22,23] had a mean Jadad score [27] of 2.67 (range 2–3), indicating medium quality (Table 1). Their methods of randomization were suitable and clearly defined. Two [21,22] out of the three papers reported withdrawal and dropout rates. However, treatment involving endoscopy and surgery made blinding impossible, which limited the quality of the three studies.
Table 1. Quality assessment for the included studies.
| Study | Design | Method of Grading | Jadad Scale | Newcastle–Ottawa Score | ||||||||
|---|---|---|---|---|---|---|---|---|---|---|---|---|
| Randomization | Blinding | Withdrawal and Dropout | Method of Randomization | Method of Blinding | Total | Selection | Comparability | Outcome | Total | |||
| Issa et al. (2020) | RCT | Jadad Scale | 1 | 0 | 1 | 1 | 0 | 3 | - | - | - | - |
| Cahen et al. (2011) | RCT | Jadad Scale | 1 | 0 | 1 | 1 | 0 | 3 | - | - | - | - |
| Dite et al. (2003) | RCT | Jadad Scale | 1 | 0 | 0 | 1 | 0 | 2 | - | - | - | - |
| Kawashima et al. (2018) | Retrospective, comparative cohort study | Newcastle–Ottawa Score | - | - | - | - | - | - | 2 | 2 | 2 | 6 |
| Jiang et al. (2018) | Retrospective, comparative cohort study | Newcastle–Ottawa Score | - | - | - | - | - | - | 4 | 2 | 3 | 9 |
| Hong et al. (2011) | Retrospective, comparative cohort study | Newcastle–Ottawa Score | - | - | - | - | - | - | 4 | 2 | 2 | 8 |
| Glass et al. (2014) | Retrospective, comparative cohort study | Newcastle–Ottawa Score | - | - | - | - | - | - | 3 | 1 | 2 | 6 |
The four retrospective cohort studies [17,18,19,20] had a mean NOS of 7.25 (range 6–9) (Table 2). The overall quality of the studies was satisfactory. Patient selection and treatment outcomes were clearly documented. Nonetheless, the study populations were not fully comparable due to treatment preferences concerning patients’ clinical situations. A brief follow-up period and a high dropout rate also limited the quality of a couple of the studies [17,23].
5. Assessment of Publication Bias of the Included Studies
Regarding the effect of drainage approach on pain relief (partial or complete), results from four studies [19,20,22,23] favored surgical drainage while those from three studies [17,18,21] favored endoscopic drainage. The funnel plot demonstrated an even distribution of the seven studies, suggesting insignificant publication bias [Eggar’s test p = 0.40] (Figure 7). Sensitivity analysis was performed to test the validity of I-square value in the pooled result (random effect model) of primary outcome. The optimal specificity and sensitivity (in the Youden index sense) for summary ROC curve are 0.8 and 0.523, respectively, resulting in a value of 0.677 for the area under the summary ROC curve, signifying consistent heterogeneity with the I-square test value (Figure 8).
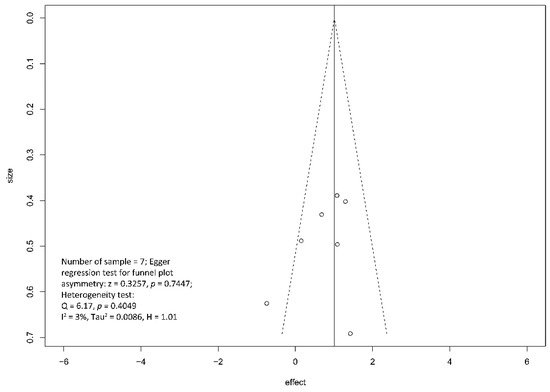
Figure 7. Funnel plot for the assessment of the presence of publication bias for pain relief (complete and partial) meta-analysis.
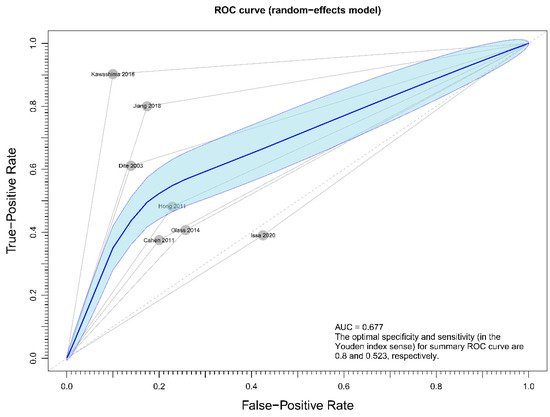
Figure 8. Figure showing sensitivity analysis on primary outcome (overall pain relief).
This entry is adapted from the peer-reviewed paper 10.3390/jcm10122636
This entry is offline, you can click here to edit this entry!